• Обзор
  • Отзывы (45)
  • Обсуждение (78)
  • Что нового

RSI Divergence Full

4.58

RSI Divergence Full   +10 other divergence indicators

  • This is the Full Version, to download the free version click here.
  • The free version works on “EURAUD” chart.
  • Contact me after payment to send you the User-Manual PDF File.
  • Also you can download the >>>  Hybrid Trading EA <<< that is designed and implemented based on RSI Divergence Indicator.

RSI is a pretty useful indicator in itself but it's even more effective when you trade divergence patterns with that. Because the divergence signal of the RSI indicator is one of the most powerful signals among the indicators.

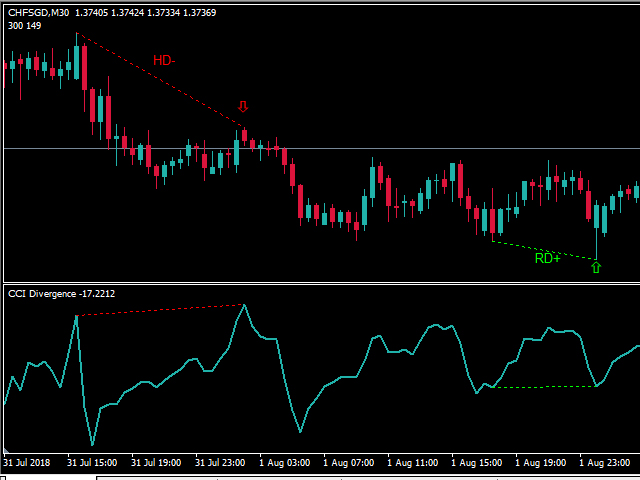
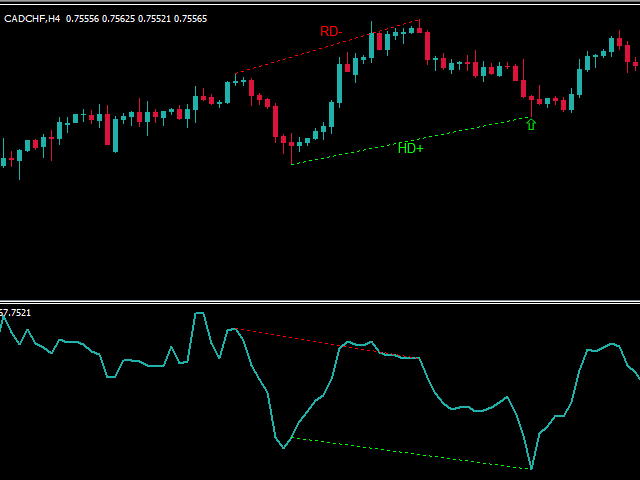
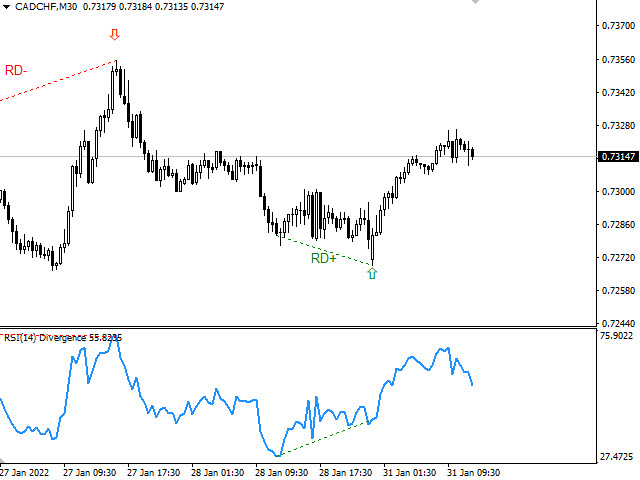
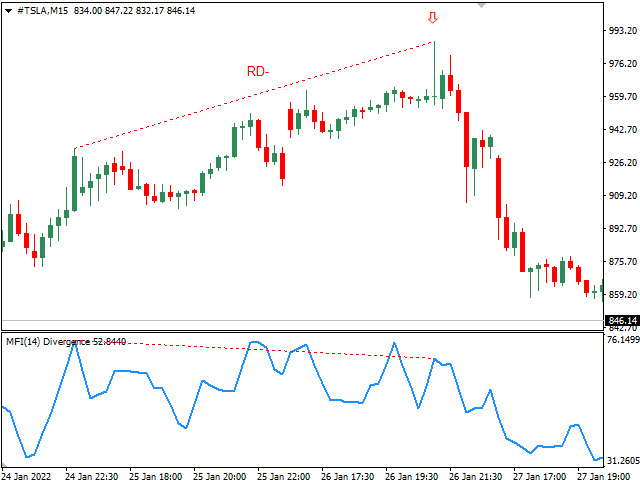
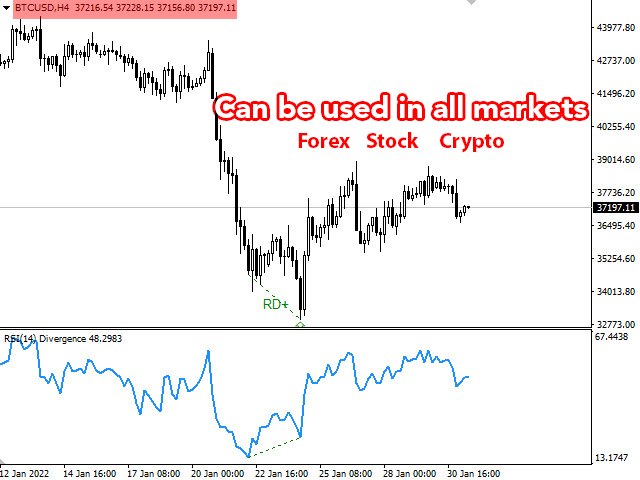
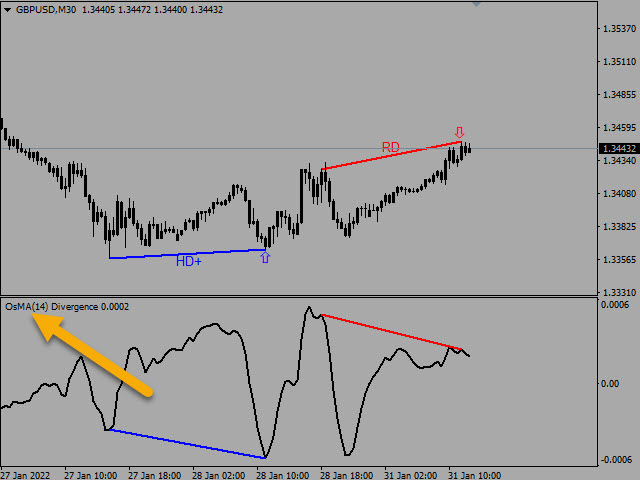
Divergences signal a potential reversal point because directional momentum does not confirm the price. A bullish divergence occurs when the underlying security makes a lower low and RSI forms a higher low, which shows less downside momentum. A bearish divergence forms when the security records a higher high and RSI forms a lower high, which shows less upside momentum.

The indicator also finds hidden divergences (HD). Hidden divergences are created in the direction of the trend, and are often strong signals for the trading.

This indicator is very functional and can greatly improve the outcome of your trading.


Detection method

Indicator detects price pivots and checks the corresponding value of pivots on RSI indicator.

When a divergence is detected (price movement and oscillator in the opposite direction), it is plotted bylines in the chart and oscillator.


Indicator Parameters

  • RSI Period
  • Type Of Drawing RSI (Line or Histogram)
  • Color Of RSI Lines/Bars
  • Bullish Divergences (Choose a color to draw bullish divergences)
  • Bearish Divergences (Choose a color to draw bearish divergences)
  • RSI lines/Bars Thickness
  • Divergences Lines Thickness
  • Divergences Lines Style (Enter a number to solid, dashed, etc.)
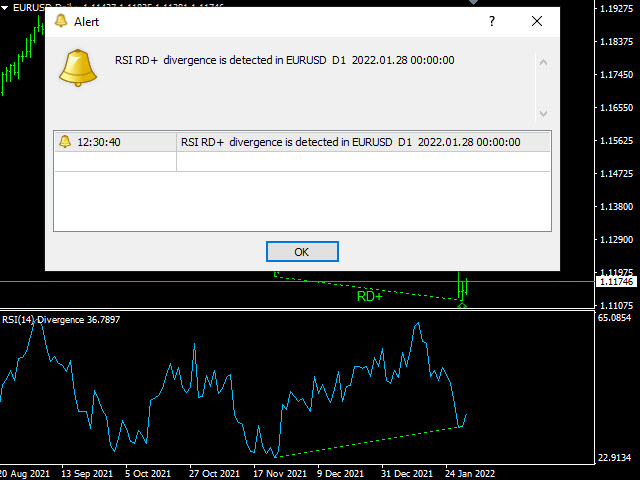
  • Alert (ON/OFF)
  • Divergences Filter (You can choose to show regular or hidden divergences or both)
  • Sending Push Notifications (To know when divergence occurs. The user can choose to send push notifications or not

/////////////////////////////////////////////////////////////////////

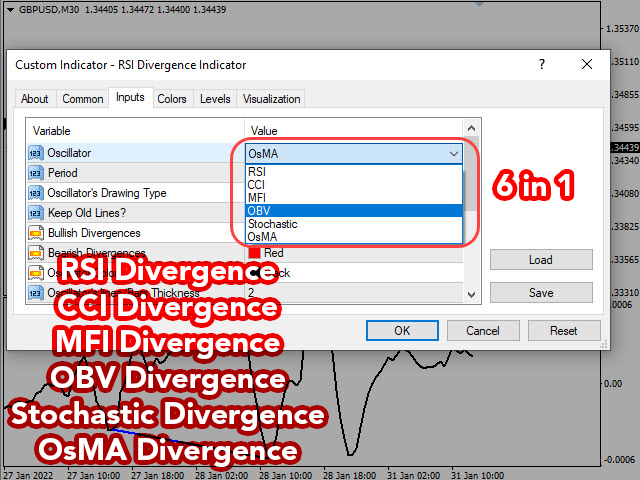
RSIMFI and OBV divergences detector are added in the new version, enjoy. 


Отзывы 20
Arnold Theisz
253
Arnold Theisz 2023.05.11 09:04 
 

Hi, I bought your indicator, could you send me the indicator guide file, please? Thnx

Mohammed.
38
Mohammed. 2023.04.07 20:47 
 

I will write my experience with this indicator At the outset, I would really like to thank Mr. Mihails Babuskins This indicator is the biggest benefit you put with your trading strategies Remember, it is a utility only, not just one that can be relied upon It must be combined with your own tools I repeat my thanks to Mr. Mihails Babuskins

lightswitchx
173
lightswitchx 2023.03.30 21:40 
 

Hello, just purchased this indicator, I loved the limited demo version and I can't wait to start using it on more pairs. The indicator is quite accurate, the most accurate I have ever used. May I get the PDF strategy guide you have? Cheers April

Рекомендуем также
Master scalping M1 -инновационный индикатор, использующий алгоритм для быстрого и точного определения тренда.Индикатор рассчитывает время открытия и закрытия позиций, алгоритмы индикатора позволяют находить идеальные моменты для входа в сделку (покупки или продажи актива), повышающие успешность сделок у большинства трейдеров. Преимущества индикатора: Прост в использовании, не перегружает график не нужной информацией. Возможность использования  как фильтр для любой стратегии. Работает на рынке
30 USD
Noize Absorption Index - is the manual trading system that measures the difference of pressure between bears forces and bulls forces. Green line - is a noize free index that showing curent situation. Zero value of index shows totally choppy/flat market.Values above zero level shows how powerfull bullish wave is and values below zero measures bearish forces.Up arrow appears on bearish market when it's ready to reverse, dn arrow appears on weak bullish market, as a result of reverse expectation. S
199 USD
TWO PAIRS SQUARE HEDGE METER INDICATOR Try this brilliant 2 pairs square indicator It draws a square wave of the relation between your two inputs symbols when square wave indicates -1 then it is very great opportunity to SELL pair1 and BUY Pair2 when square wave indicates +1 then it is very great opportunity to BUY pair1 and SELL Pair2 the inputs are : 2 pairs of symbols         then index value : i use 20 for M30 charts ( you can try other values : 40/50 for M15 , : 30 for M30 , : 10 for H1 ,
10 USD
Осциллятор MACD с расширенной фильтрацией тренда и индикацией предупреждений. Он определяет тренд, отфильтровываются слабые тренды и указывается новая сила тренда. Осциллятор MACD работает на любых таймфреймах и на всех инструментах (валюты, индексы, нефть, металлы, акции, опционы, офлайн-графики ренко) 1. Пользователь может изменить значение MACD, 2. Фильтр минимального уровня MACD, 3. Значение деления отфильтрует соотношение мощностей, при котором требуется индикация изменения тренда на любом
45 USD
Trend Trading - это индикатор, предназначенный для получения максимальной прибыли от трендов, происходящих на рынке, путем определения времени отката и прорыва. Он находит торговые возможности, анализируя, что делает цена во время установленных тенденций. [ Руководство по установке | Руководство по обновлению | Устранение неполадок | FAQ | Все продукты ] Торгуйте на финансовых рынках с уверенностью и эффективностью Прибыль от устоявшихся тенденций без проволочек Признать прибыльные откаты,
175 USD
Daily Candle Predictor - это индикатор, который предсказывает цену закрытия свечи. Прежде всего индикатор предназначен для использования на графиках D1. Данный индикатор подходит как для традиционной форекс торговли, так и для торговли бинарными опционами. Индикатор может использоваться как самостоятельная торговая система, так может выступать в качестве дополнения к вашей уже имеющейся торговой системе. Данный индикатор производит анализ текущей свечи, рассчитывая определенные факторы силы внут
65 USD
Forex Gump
Andrey Kozak
2.83 (6)
Forex Gump - это полностью готовая полуавтоматическая торговая система. В виде стрелок на экран выводятся сигналы для открытия и закрытия сделок. Все, что вам нужно, это следовать указаниям индикатора. Когда индикатор показывает синюю стрелку, Вам нужно открывать ордер на покупку. Когда индикатор показывает красную стрелку, нужно открывать ордер на продажу. Закрываем ордера когда индикатор рисует желтый крестик. Для того, чтобы получить максимально эффективный результат, рекомендуем использовать
147 USD
To get access to MT5 version please click here . - This is the exact conversion from TradingView: "Stochastic Momentum Index" By "UCSgears". - This is a popular version of stochastic oscillator on tradingview. - This is a light-load processing and non-repaint indicator. - Buffers are available for the lines on chart. - You can message in private chat for further changes you need. Thanks for downloading
40 USD
Индикатор отображает на графике данные стохастик-осцилятора более старшего временного интервала. Основная и сигнальная линии отображаются в дополнительном окне. Ступенчатая характеристика не сглажена. Индикатор удобен для отработки "ручных" стратегий форекс-торговли, использующих данные от нескольких экранов с различными временными интервалами одного инструмента. В индикаторе используются настройки, аналогичные стандартному и выпадающий список для выбора тайм-фрейма. Параметры индикатора TimeF
30 USD
Индикаторы [ZhiBiCCI] подходят для всех циклов использования, а также подходят для всех разновидностей рынка. [ZhiBiCCI] Зеленая сплошная линия - разворот бычьей дивергенции. Зеленая пунктирная линия - классическая бычья дивергенция. [ZhiBiCCI] Сплошная линия к красному - обратная медвежья дивергенция. Красная пунктирная линия - классическая медвежья дивергенция. [ZhiBiCCI] можно установить в параметрах (Предупреждение, Отправить почту, Отправить уведомление), установить на (true) для отпр
58 USD
Индикатор RTrends делает две вещи: во-первых, производит автоматическую (на лету) разметку графика цены путем нанесения линий трендов и, во-вторых, дает медвежьи и бычьи сигналы. Разметка отражает фрактальную природу рынка. На график одновременно наносятся тренды с разных временных горизонтов. Таким образом, трейдер, имея перед глазами только один график, может видеть линии трендов со старших таймфреймов. Линии, в зависимости от горизонта, различаются по цвету и толщине: чем старше горизонт, тем
60 USD
Это трендовый индикатор без перерисовки Разработан вместо стратегии бля бинарках опционов (по цвету свечи мартингейл) Так же хорошо работает в торговле на рынке форекс Когда открывать сделки ( бинарные опционы ) Сигнал появится в месте с свечой сигналит на текущую свечу  Открывать сделку стоит на одну свечу текущего таймфрейма рекомендуется м1 и М5 При появлении синей точки открываем сделку вверх При появлении красной точки открываем сделку в низ. Как открывать сделки на Форекс. При полу
1 000 USD
Trade with Gann on your side!! MASTER CIRCLE 360 CIRCLE CHART, originally created by Gann admitted that this is “The Mother of all charts”. It is one of the last studies that this great trader left for us. The numeric tab le is apparently quite simple like all the tables and is based on square numbers, the SQUARE OF 12 and is by evolution, one of the most important square numbers. Here we can find CYCLE, PRICE AND TIME thanks to angles and grades, to show past and future support and resistance.
149.99 USD
Индикатор определяет и отображает на графике гармоничный паттерн Акула согласно схеме, приведенной на скриншоте. Выделение паттерна производится по вершинам индикатора ZigZag (включен в ресурсы, не требует дополнительной установки). В момент распознавания паттерна выводится сообщение во всплывающем окне, отправляются оповещения на мобильное устройство и электронный почтовый ящик. Индикатор выделяет не только завершенную фигуру, но и момент ее формирования. На этапе формирования фигура отображает
30 USD
Super Gator
Agustinus Biotamalo Lumbantoruan
This indi shows the following 1. Supertrend 2. Alligator (Not a regular alligator) 3. ZigZag 4. Moving Average 5. Trend Continuation/Mini correction Signal (plotted in X) (See screenshots in green background color 6. Early Signal Detection (See screenshots in green background color) You may treat Alligator as the lagging indicator The leading indicator is the supertrend. The zig zag is based on the leading indicator where it gets plotted when the leading indicator got broken to the opposite.
150 USD
Trend Bilio - стрелочный индикатор без перерисовки показывает потенциальные точки входа в рынок в виде стрелок соответствующего цвета: стрелки вверх красные предлагают открыть покупку, зеленые стрелки вниз – продажу. Предполагается вход на следующем баре после указателя. Стрелочный индикатор Trend Bilio визуально «разгружает» ценовой график и экономит время анализа: нет сигнала – нет сделки, если появился обратный сигнал, то текущую сделку стоит закрыть. Именно Trend Bilio считается хорошим в
140 USD
The Fibonacci Magic Pivot Levels is a powerful yet easy to use indicator . It continuously monitor s intra-day price action and uses complex algorithms to calculate and detect key support, resistance and pivot levels, using the D1 timeframe as a filter. The   Fibonacci Magic Pivot Levels is optimized for H4, H1, M30, M15, M5 & M1 timeframes and can be used on ALL Currencies, Indices, Commodities, and Cryptocurrency pairs . Trade with improved confidence and maximize your success rate. Benefits o
99 USD
Tunafish EA MT4
Ismaele Daniele Lodetti
Tunafish EA is the most efficient EA on my profile. I spent a lot of time and effort to make this software sophisticated with possibilities of high potential returns while keeping the drawdown below 25%. The algorithms of the robot provide investors of any level of training with an investment opportunity that is both safe and aggressive. Tunafish EA imitating the work of the brain, capable of learning and adapting to changing conditions and predicting situations. When applied to trading in fina
69 USD
Усовершенствованная версия бесплатного индикатора HMA Trend (для MetaTrader 4) , с возможностью статистического анализа. HMA Trend - трендовый индикатор, базирующийся на скользящей средней Хала (Hull Moving Average - HMA) с двумя периодами. HMA с медленным периодом определяет тренд, HMA с быстрым периодом - краткосрочные движения и сигналы в сторону тренда. Главные отличия от бесплатного варианта: Возможность предсказать вероятность разворота тренда с помощью анализа исторических данных; Постр
30 USD
Индикатор Point61 - результат многолетнего наблюдения за поведением цены валютных пар и металлов. Не секрет, что в моменты неопределенности трейдеры ищут возможные уровни поддержки и сопротивления - точки, где цена должна остановить движение. В этих точках возможны 2 сценария: 1. Разворот (коррекция) в обратную сторону; 2. Пробой для продолжения движения. Очень часто эти точки используются для установки стоп-ордеров - ТейкПрофит или СтопЛосс. И важно определять эти точки для максимизации прибыли
249 USD
This is not Th3Eng PipFinite indicator It is Th3Eng PipFinite PRO ==> based on another logic and algorithms (Th3Eng PipFinite Original is here ) Attention: New update arrived for Th3Eng PipFinite PRO EA. So please contact us to get the new one. The Th3Eng PipFinite Pro indicator is based on an analysis of the right trend direction with perfect custom algorithms. It show the true direction and the best point of the trend. With Stop Loss point and Three Take Profit points. Also it show the righ
150 USD
Индикатор паттерна 31 ("Длинный остров") из книги Томас Н. Булковский "Полная энциклопедия графических ценовых моделей". Второй гэп в обратном направлении. Параметры: Alerts - Включение алертов при появлении стрелки   Push - Отправка Push-уведомления при появлении стрелки (требуется настройка в терминале) GapSize - Минимальный размер гэпа в пунктах ArrowType - Значок: от 1 до 17 ArrowVShift - Сдвиг значков по вертикали в пунктах   ShowLevels - Показывать уровни ColUp - Цвет линий вверх ColD
30 USD
Buy Sell Strength (BSS) (For MT4 ) is a stock technical analysis oscillator, showing bullish (buy) and bearish (sell) strength by comparing upward and downward stock momentum movements. The BSS is easy to interpret: 1. When BBS Histogram is moving Upward, it is bullish, when it is Downward, it is bearish. 2. When the Orange rectangle is changing shorter and shorter, it shows the trend will change direction. when it dispears, it shows Buy or Sell signals. 3. BSS is considered overbought whe
30 USD
Индикатор тренда с расчетом динамических уровней и сигнализацией их пересечения. Описание входных параметров: StepTF = true; - Расчет индикатора по закрытии бара (true) или по каждому тику (false) BarsCount  = 300; - Количество расчетных баров Price = PRICE_CLOSE; - Тип используемой цены TimeFrame = PERIOD_CURRENT; - Расчетный таймфрейм TrendPeriod = 9; - Период расчета тренда TrendDeviations = 4.9; - Коэффициент девиации PeriodTrendSmooth = 1; - Период сглаживания тренда ModeTrendSmooth = MOD
30 USD
Индикаторы МТ4. Автоматически рисуются три уровня поддержки и сопротивления Фибоначчи. Они есть: Уровень месяца: средняя орхидея Недельный уровень: оранжевый красный Уровень дня: бирюзовый Цвет можно настроить по параметрам. MT5 Version: https://www.mql5.com/EN/market/product/80068 Этот индикатор в основном используется для анализа будущих уровней поддержки и сопротивления для лучшего анализа торговли. Если уровень поддержки эффективно поддерживается много раз, рынок пробьет предыду
40 USD
Индикатор "Two Moving Average Crossover" для MetaTrader 4 (MT4 - это инструмент технического анализа, который отображает две скользящие средние и уведомляет, когда скользящие средние пересекают друг друга. Индикатор рассчитывает и строит график двух скользящих средних, одна из которых быстрее, а другая медленнее. Когда более быстрая скользящая средняя пересекается выше более медленной скользящей средней, это считается бычьим сигналом, указывающим на потенциальный разворот тренда или начало новог
30 USD
LordMACDSignal is an indicator for META TRADER that uses the MACD trend of the financial market by default and principle. LordMACDSignal has been optimized with MACD indicator to analyze the trend through candles and detect the next movement. LordMACDSignal sends signal alerts about a trend of upward or downward divergence, and also reports possible reverse situations in overloaded pairs. Made with love and care, Join Telegram Group: https://t.me/expertlord
30 USD
KT Renko Patterns MT4
KEENBASE SOFTWARE SOLUTIONS
2.33 (3)
KT Renko Patterns scans the Renko chart brick by brick to find some famous chart patterns that are frequently used by traders across the various financial markets. Compared to the time-based charts, patterns based trading is easier and more evident on Renko charts due to their uncluttered appearance. KT Renko Patterns features multiple Renko patterns, and many of these patterns are extensively explained in the book titled Profitable Trading with Renko Charts by Prashant Shah. A 100% automate
145 USD
Об индикаторе Lyne Lyne-это индикатор Metatrader 4 (MT4), суть которого заключается в преобразовании накопленных исторических данных. Индикатор Lyne дает возможность обнаружить различные особенности и паттерны в динамике цены, невидимые невооруженным глазом. Основываясь на этой информации, трейдеры могут предполагать дальнейшее движение цены и соответствующим образом корректировать свою стратегию. Данный индикатор хорошо зарекомендовал себя в стратегии скальпинг. Индикатор работает без перекраск
30 USD
The Th3Eng PipFinite indicator is based on a very excellent analysis of the right trend direction with perfect custom algorithms. It show the true direction and the best point to start trading. With StopLoss point and Three Take Profit points. Also it show the right pivot of the price and small points to order to replace the dynamic support and resistance channel, Which surrounds the price. And Finally it draws a very helpful Box on the left side on the chart includes (take profits and Stop loss
89 USD
С этим продуктом покупают
СЕЙЧАС $147 ($602 СКИДКА) - ОПЛАТА ОДИН РАЗ, ИСПОЛЬЗОВАНИЕ НАВСЕГДА - БЕЗЛИМИТНЫЕ АККАУНТЫ Руководство пользователя + Обучающие видео + Доступ к приватному Discord-каналу + VIP-статус и мобильная версия + Лицензия на 5 ПК с неограниченным количеством аккаунтов и терминалов MT4. Сколько раз вы покупали индикатор торговли с замечательными обратными тестами, доказательствами производительности на живых счетах и зашикарными цифрами и статистикой, но после использования на своем счете вы оказыва
147 USD
ICT, SMC, SMART MONEY CONCEPTS, SMART MONEY, Smart Money Concept, Support and Resistance, Trend Analysis, Price Action, Market Structure, Order Blocks, BOS/CHoCH,   Breaker Blocks ,  Momentum Shift, Supply&Demand Zone/Order Blocks , Strong Imbalance, HH/LL/HL/LH,    Fair Value Gap, FVG,  Premium  &   Discount   Zones, Fibonacci Retracement, OTE, Buy Side Liquidity, Sell Side Liquidity, BSL/SSL Taken, Equal Highs & Lows, MTF Dashboard, Multiple Time Frame, BigBar, HTF OB, HTF Market Structure,  L
65 USD
В НАСТОЯЩЕЕ ВРЕМЯ СКИДКА 26% Лучшее решение для новичка или трейдера-эксперта! Этот индикатор является уникальным, высококачественным и доступным торговым инструментом, поскольку мы включили в него ряд собственных функций и новую формулу. С помощью всего лишь ОДНОГО графика вы можете определить силу валюты для 28 пар Форекс! Представьте, как улучшится ваша торговля, потому что вы сможете точно определить точку запуска нового тренда или возможность скальпирования? Руководство пользователя:
148 USD
Advanced Supply Demand
Bernhard Schweigert
4.93 (295)
Этот индикатор является уникальным, качественным и доступным инструментом для торговли, включающим в себя наши собственные разработки и новую формулу. В обновленной версии появилась возможность отображать зоны двух таймфреймов. Это означает, что вам будут доступны зоны не только на старшем ТФ, а сразу с двух таймфреймов - таймфрейма графика и старшего: отображение вложенных зон. Обновление обязательно понравится всем трейдерам, торгующим по зонам спроса и предложения. Важная информация Для мак
148 USD
Gold Stuff
Vasiliy Strukov
4.88 (169)
Gold Stuff - трендовый индикатор, разработанный специально для золота, также может использоваться на любых финансовых инструментах. Индикатор не перерисовывается и не запаздывает. Рекомендуемый тайм-фрейм H1.  По данному индикатору написан советник EA Gold Stuff, Вы можете найти его в моем профиле. Свяжитесь со мной сразу после покупки для получения   персонального бонуса! Настройки и мануал  здесь ПАРАМЕТРЫ Draw Arrow - вкл.выкл. отрисовку стрелок на графике. Alerts - вкл.выкл.звуковые оповещен
50 USD
В настоящее время скидка 20%! Лучшее решение для новичка или трейдера-эксперта! Эта приборная панель работает на 28 валютных парах. Он основан на 2 наших основных индикаторах (Advanced Currency Strength 28 и Advanced Currency Impulse). Он дает отличный обзор всего рынка Forex. Он показывает значения Advanced Currency Strength, скорость движения валюты и сигналы для 28 пар Forex на всех (9) таймфреймах. Представьте, как улучшится ваша торговля, когда вы сможете наблюдать за всем рынком с пом
199 USD
СЕЙЧАС СКИДКА 31% !!! Лучшее решение для новичка или трейдера-эксперта! Этот индикатор является уникальным, высококачественным и доступным торговым инструментом, поскольку мы включили в него ряд собственных функций и секретную формулу. Всего на ОДНОМ графике он выдает алерты по всем 28 валютным парам. Представьте, как улучшится ваша торговля, ведь вы сможете точно определить точку запуска нового тренда или возможность скальпирования! Построенный на новых базовых алгоритмах, он позволяет е
88 USD
Станьте Breaker Trader и получайте прибыль от изменений структуры рынка по мере изменения цены. Индикатор выключателя блока ордеров определяет, когда тренд или движение цены приближаются к истощению и готовы развернуться. Он предупреждает вас об изменениях в структуре рынка, которые обычно происходят, когда произойдет разворот или серьезный откат. Индикатор использует собственный расчет, который определяет прорывы и ценовой импульс. Каждый раз, когда новый максимум формируется около возможн
49 USD
Топовый индикатор МТ4, дающий сигналы для входа в сделки без перерисовки! Идеальные точки входа в сделки   для  валют, крипты, металлов, акций, индексов !  Смотрите  видео  (6:22) с примером отработки всего одного сигнала, окупившего индикатор. Версия индикатора для MT5 Преимущества индикатора Сигналы на вход без перерисовки Если сигнал появился, он никуда НЕ исчезает! В отличие от индикаторов с перерисовкой, которые ведут к потере депозита, потому что могут показать сигнал, а потом убрать его.
125 USD
Ultimate Sniper Dashboard
Hispraise Chinedum Abraham
4.65 (23)
Скидка $299! Цены могут вырасти в будущем! Читайте описание ниже! Лучшая система ввода для Ultimate Sniper Dashboard: ПРЕДЕЛЬНЫЕ ДИНАМИЧЕСКИЕ УРОВНИ. (Пожалуйста, проверьте мои продукты) Ultimate Sniper Dashboard работает ТОЛЬКО на реальных рынках из-за ограничений мультивалютного тестирования MT4. Представляем вам Ultimate-Sniper Dashboard! Наша самая лучшая панель, которая содержит HA-Sniper, MA-Sniper и множество специальных режимов. Ultimate Sniper Dashboard - это абсолютный зверь!
299 USD
Индикатор разворота ADR сразу показывает, где в настоящее время торгуется цена относительно своего нормального среднего дневного диапазона. Вы будете получать мгновенные оповещения через всплывающие окна, электронную почту или push-уведомления, когда цена превышает свой средний диапазон и уровни выше него по вашему выбору, чтобы вы могли быстро переходить к откатам и разворотам. Индикатор рисует на графике горизонтальные линии на экстремумах среднего дневного диапазона, а также расширения выше
49 USD
Автоматическое построение уровней поддержки и сопротивления ПЛЮС разрывы между свечами на вашем графике, чтобы вы могли видеть, куда цена, скорее всего, направится дальше и/или потенциально может развернуться. Этот индикатор разработан для использования в рамках методики позиционной торговли, которая преподается на моем сайте (The Market Structure Trader), и отображает ключевую информацию для таргетинга и потенциальных входов. В индикаторе есть 2 основные функции и 4 дополнительные: ОСНОВНА
49 USD
Currency Strength Wizard — очень мощный индикатор, предоставляющий вам комплексное решение для успешной торговли. Индикатор рассчитывает силу той или иной форекс-пары, используя данные всех валют на нескольких тайм фреймах. Эти данные представлены в виде простых в использовании индексов валют и линий силы валют, которые вы можете использовать, чтобы увидеть силу той или иной валюты. Все, что вам нужно, это прикрепить индикатор к графику, на котором вы хотите торговать, и индикатор покажет вам ре
55 USD
PRO Renko System - это высокоточная система торговли на графиках RENKO. Система универсальна. Данная торговая система может применяться к различным торговым инструментам. Система эффективно нейтрализует так называемый рыночный шум, открывая доступ к точным разворотным сигналам. Индикатор прост в использовании и имеет лишь один параметр, отвечающий за генерацию сигналов. Вы легко можете адаптировать алгоритм к интересующему вас торговому инструменту и размеру ренко бара. Всем покупателям с удовол
75 USD
A top and bottom indicator that can intuitively identify the trend of the band. It is the best choice for manual trading, without redrawing or drifting. How to get this indicator for free: Learn more For any novice and programming trading friend, you can write the signal into the EA to play freely. Array 3 and array 4, for example, 3>4 turns green, 3<4 turns red. If you don't understand, please contact me. ====================Parameter introduction:============== KQuantity                // Disp
79 USD
Инструкция работы с индикатором |  Стратегия Owl Smart Levels |  Версия MT5  | Как установить?  | FAQ Индикатор Owl Smart Levels   – это полноценная торговая система внутри одного индикатора, которая включает в себя такие популярные инструменты анализа рынка как усовершенствованные   фракталы Билла Вильямса , Valable ZigZag, который строит   правильную волновую структуру   рынка, а также  уровни Фибоначчи,   которые   отмечают точные уровни входа в рынок и места взятия прибыли. Подробное описан
97 USD
TakePropips Donchian Trend Pro
Eric John Pajarillaga Aldana
4.75 (12)
TakePropips Donchian Trend Pro   (MT4) — это мощный и эффективный инструмент, который автоматически определяет направление тренда с помощью канала Дончиана и предоставляет вам торговые сигналы для входа и выхода! Этот многофункциональный индикатор включает в себя сканер тренда, торговые сигналы, статистическую панель, скринер, торговые сессии и панель истории предупреждений. Он разработан, чтобы предоставить вам торговые сигналы и сэкономить время на анализе графиков! Вы можете скачать руководст
99 USD
Панель предупреждений RSI / TDI позволяет вам одновременно отслеживать RSI (выбирается вами) по каждой основной паре, которой вы торгуете. Вы можете использовать его двумя способами: 1. Выберите несколько таймфреймов, и тире покажет вам, когда несколько таймфреймов выходят за рамки обычных торговых условий. Отличный индикатор того, что цена в последнее время сильно подросла, поскольку она достигла уровня перекупленности или перепроданности в нескольких временных рамках, поэтому вскоре ожи
49 USD
Scalper Vault — это профессиональная торговая система, которая дает вам все необходимое для успешного скальпинга. Этот индикатор представляет собой полную торговую систему, которую могут использовать трейдеры форекс и бинарных опционов. Рекомендуемый тайм фрейм М5. Система дает точные стрелочные сигналы в направлении тренда. Она также предоставляет вам сигналы выхода и рассчитывает рыночные уровни Ганна. Индикатор дает все типы оповещений, включая PUSH-уведомления. Пожалуйста, напишите мне после
65 USD
Ultimate Dynamic Levels
Hispraise Chinedum Abraham
4.88 (8)
В настоящее время праздничная скидка составляет $399! Цены могут вырасти в будущем. Читайте описание ниже!   Представляем Ultimate Dynamic Levels - ЛУЧШИЙ индикатор входов для Ultimate Sniper Dashboard! Чрезвычайно низкий риск своевременных входов и высокий RR!!! Найдите Ultimate Sniper Dashboard ЗДЕСЬ. Самая важная способность как для начинающих, так и для профессиональных трейдеров - точно определить, где и когда рынок, скорее всего, развернется, и как безопасно войти в рынок и выйти из нег
199 USD
AW Trend Predictor
Alexander Nechaev
4.7 (33)
Сочетание тренда и пробоя уровней в одной системе. Продвинутый алгоритм индикатора фильтрует рыночный шум, определяет тренд, точки входа, а также возможные уровни выхода из позиции. Сигналы индикатора записываются в статистический модуль, который позволяет выбирать наиболее подходящие инструменты, показывая эффективность истории сигналов. Индикатор рассчитывает отметки ТейкПрофитов и стоплосса. Руководство пользователя -> Здесь  / MT5 версия -> Здесь Как торговать с индикатором: Торговля с Tre
55 USD
Эта информационная панель представляет собой инструмент оповещения для использования с индикатором разворота структуры рынка. Его основная цель - предупредить вас о возможностях разворота на определенных временных рамках, а также о повторных проверках предупреждений (подтверждении), как это делает индикатор. Панель инструментов предназначена для самостоятельного размещения на графике и работы в фоновом режиме, чтобы отправлять вам оповещения о выбранных вами парах и таймфреймах. Он был разработ
49 USD
Trend Screener
STE S.S.COMPANY
4.76 (59)
Индикатор тренда, революционное уникальное решение для торговли и фильтрации тренда со всеми важными функциями тренда, встроенными в один инструмент! Это 100% неперерисовывающийся мультитаймфреймный и мультивалютный индикатор, который можно использовать на всех инструментах/инструментах: форекс, товары, криптовалюты, индексы, акции. Trend Screener - это эффективный индикатор, следующий за трендом, который выдает сигналы тренда в виде стрелок с точками на графике. Функции, доступные в индикаторе
50 USD
GOLD Impulse with Alert
Bernhard Schweigert
3.67 (3)
Этот индикатор является супер комбинацией двух наших продуктов Advanced Currency IMPULSE with ALERT  +   Currency Strength Exotics . Он работает на всех временных рамках и графически показывает импульс силы или слабости для 8 основных валют плюс один символ! Этот индикатор специализирован для отображения ускорения силы валюты для любых символов, таких как золото, экзотические пары, товары, индексы или фьючерсы. Первый в своем роде, любой символ может быть добавлен в 9-ю строку, чтобы пока
149 USD
В НАСТОЯЩЕЕ ВРЕМЯ СКИДКА 20%! Лучшее решение для новичка или трейдера-эксперта! Этот индикатор специализирован для отображения силы валюты для любых символов, таких как экзотические пары, товары, индексы или фьючерсы. Впервые в своем роде, любой символ может быть добавлен в 9-ю строку, чтобы показать истинную силу валюты золота, серебра, нефти, DAX, US30, MXN, TRY, CNH и т.д. Это уникальный, высококачественный и доступный торговый инструмент, потому что мы включили в него ряд собственных функци
128 USD
Представляем       Quantum Breakout PRO   , новаторский индикатор MQL5, который меняет ваш способ торговли в зонах прорыва! Разработанная командой опытных трейдеров с опытом торговли более 13 лет,   Quantum Breakout PRO   предназначена для того, чтобы вывести ваше торговое путешествие на новые высоты благодаря своей инновационной и динамичной стратегии зон прорыва. АКЦИЯ ЗАПУСК Цена только       50.00 долларов США       ! Quantum Breakout Indicator покажет вам сигнальные стрелки на зона
59.99 USD
Italo Volume Indicator
Italo Santana Gomes
4.95 (75)
BUY INDICATOR AND GET EA FOR FREE AS A BONUS + SOME OTHER GIFTS! ITALO VOLUME INDICATOR  is the best volume indicator ever created, and why is that? The Indicator works on all time-frames and assets, indicator built after 6 years of experience on forex and many other markets. You know many volume indicators around the internet are not complete, does not help, and it's difficult to trade, but the Italo Volume Indicator is different , the Italo Volume Indicator shows the wave volume, when market
65 USD
А. Что такое A2SR?   * Это опережающий технический индикатор (без перерисовки, без запаздывания) . -- Учебники : -- на https://www.mql5.com/ru/blogs/post/734748/page4#comment_16532516   -- и https://www.mql5.com/ru/users/yohana/blog A2SR имеет особую технику определения уровней Поддержки (спроса) и Сопротивления (предложения). В отличие от обычного способа, который мы видели в сети, A2SR имеет оригинальную концепцию определения фактических уровней SR. Оригинальная техника не была взята из Инте
386 USD
MetaBands M4
Vahidreza Heidar Gholami
5 (1)
MetaBands использует мощные и уникальные алгоритмы для построения каналов и обнаружения тенденций, чтобы предоставлять трейдерам потенциальные точки для входа и выхода из сделок. Это индикатор канала плюс мощный индикатор тенденций. Он включает различные типы каналов, которые могут быть объединены для создания новых каналов, просто используя параметры ввода. MetaBands использует все типы оповещений, чтобы уведомлять пользователей о событиях на рынке. Особенности Поддерживает большинство алгоритм
129 USD
В настоящее время скидка 20%! Эта приборная панель - очень мощное программное обеспечение, работающее на нескольких символах и до 9 таймфреймов. Он основан на нашем основном индикаторе (Лучшие отзывы: Advanced Supply Demand ).   Приборная панель дает отличный обзор. Она показывает:  Отфильтрованные значения спроса и предложения, включая рейтинг силы зон, расстояния между пунктами в зонах и внутри зон, Выделяются вложенные зоны, Выдает 4 вида предупреждений для выбранных символов на всех (9)
199 USD
Другие продукты этого автора
>>> Contact me after the purchase to send you the guide file and add you in "Hybrid Trading EA Group", share your experiences with other users. Full Automated trading robot, for the first time on the market, an Expert Advisor is designed based on divergence. Using divergences is one of the most common and practical trading methods. Because we see a divergence in most places where there is potential for price return. Diagnosis and trading based on them has a higher efficiency than many metho
149 USD
This is the Full Version, to download the free version click here. The free version works on “XAUUSD” and “BTCUSD” charts. Contact me after payment to send you the User-Manual PDF File. 5W Pattern  introduction The 5W pattern occurs when the price forms an alternating 5-wave cycle with its volatility. In fact, the 5W  pattern is a price series of alternating HH or LL (higher high or lower low), which is the main characteristic of a trend. The pattern of 5W should have the characteristic of non-
49 USD
This is the Full Version, to download the free version click here. The free version works on “CADCHF” and “AUDJPY” charts. Contact me after payment to send you the User-Manual PDF File. ADVANCE PRICE ACTION TRADING CONCEPT. To test the indicator, you can download the demo version on my product list. it’s free (only shows patterns that have occurred in the past of the market). Quasimodo is  a reversal trading pattern  that appears at the end of an uptrend. As a price formation, the Quasimodo pat
49 USD
This is the full version of the indicator, to testing please download the demo version(It's free and you can download it on my product pages  ). harmonic patterns   Harmonic patterns can be used to spot new trading opportunities and pricing trends – but only if you know exactly what you are looking for. Harmonic patterns are formed by combining geometric shapes and Fibonacci levels. As a result, Fibonacci levels are the key concept of these patterns. Identifying harmonic patterns requires more
30 USD
This is the Full Version, to download the free version click here. The free version works on “XAUUSD” and “BTCUSD” charts. Contact me after payment to send you the User-Manual PDF File. Triangle Pattern Sometimes the price cannot make higher highs or lower lows and it moves in a converging price range and waves are shorter than before until the movement creates a geometric shape of a symmetrical triangle, which indicates It is maybe the end of the trend. The triangle pattern is a well-known
39 USD
Contact me after the purchase to send you the guide file and add you in "123 Pattern scanner Group", share your experiences with other users. 2 00 X 8 = 1600 Symbols-Timeframes Full scan on the moment !!! This Indicator does   Not repaint   and   N ot lag . How To Test To test the indicator please download demo version (  the demo version scans charts in W1 and MN1 time-frames )  it's free. 123 Pattern Breakout Trend is your friend, trade along the trend, but how do we identify tren
30 USD
Contact me after the purchase to send you the guide file and add you in "Volume Profile Group", share your experiences with other users. Volume Profile FR(Fixed Range) supply and demand This is the full version of the indicator, to test please download the   demo version here   (It's free on BTCUSD or EURAUD charts) Using volume as a fundamental parameter in the analysis is very common.  A typical volume indicator works on a time axis. With it you can determine the volume of each candle, bu
39 USD
Contact me after the purchase to send you the guide file and add you in "Volume Profile Indicator Group", share your experiences with other users. Volume Profile FR(Fixed Range) supply and demand This is the full version of the indicator, to test please download the demo version here (It's free on EURCAD chart) Using volume as a fundamental parameter in the analysis is very common.  A typical volume indicator works on a time axis. With it you can determine the volume of each candle, but to
30 USD
Calculation of Lot Size for many traders is a big challenge. A case that is very important in money management. What many traders ignore. Choosing an appropriate Lot Size in trades can improve results and it will ultimately lead to success. This indicator calculates the authorized Lot Size for your trades. The indicator uses the following values to get the appropriate Lot Size for positioning: The distance of Stop Loss. The Pip Value. The amount of Risk Allowed For Each Trade. T
FREE
This is the Full Version, to download the free version click here. The free version works on “GBPCAD” and “BTCUSD” charts. Contact me after payment to send you the User-Manual PDF File. Harmonic Trading The secret is the Fibonacci. It has been proven in the markets that price always reacts to Fibonacci levels. Fibonacci levels are one of the most important indicators of price changes. Sometimes the sequence of reactions to these levels in the chart make geometric shapes, which are called harmon
39 USD
This is the free Version, to download the full version click here. The free version works on “XAUUSD” and “BTCUSD” charts. Contact me after payment to send you the User-Manual PDF File. Triangle Pattern Sometimes the price cannot make higher highs or lower lows and it moves in a converging price range and waves are shorter than before until the movement creates a geometric shape of a symmetrical triangle, which indicates It is maybe the end of the trend. The triangle pattern is a well-known
FREE
2 00 X 8 = 1600   Symbols-Timeframes  Full scan on the moment !!! This Indicator does   Not repaint   and   N ot lag . Download directly  the indicator file here. (if you can't open on MT4) This is the demo version,   the demo version scans charts in W1 and MN1 time-frames , to unlimited access and scan full symbol-timeframes, please download the full version. Download   full version here. 123 Pattern Breakout Trend is your friend, trade along the trend, but how do we identify trends? Some
FREE
Volume Profile FR(Fixed Range) supply and demand This is the demo version(It's free on  EURCAD   chart), for unlimited features , download the full version here.  sing volume as a fundamental parameter in the analysis is very common. A typical volume indicator works on a time axis. With it you can determine the volume of each candle, but to get the volume of price levels you need something more than a normal volume indicator: Volume Profile Indicator A functional and useful tool that can impr
FREE
This is the Free Version, to download the Full version click here. The free version works on “XAUUSD” and “BTCUSD” charts. Contact me after payment to send you the User-Manual PDF File. 5W Pattern  introduction The 5W pattern occurs when the price forms an alternating 5-wave cycle with its volatility. In fact, the 5W pattern is a price series of alternating HH or LL (higher high or lower low), which is the main characteristic of a trend. The pattern of 5W should have the characteristic of non-o
FREE
Contact me after the purchase to send you the guide file and add you in "Volume Profile Indicator Group", share your experiences with other users. Volume Profile FR(Fixed Range) supply and demand This is the demo version(It's free on BTCUSD or  EURAUD   chart), for unlimited features , download the   full version here.  sing volume as a fundamental parameter in the analysis is very common. A typical volume indicator works on a time axis. With it you can determine the volume of each c
FREE
Contact me after the purchase to send you the guide file and add you in "MACD Divergence Group", share your experiences with other users. Divergence detection indicator with a special algorithm. ///////////////////////////////////////////////////////////////////////////////// Using divergences is very common in trading strategies. But finding opportunities for trading with the eyes is very difficult and sometimes we lose those opportunities. The indicator finds all the regular and hidden di
30 USD
This is the Full Version, to download the free version click here. The free version works on “XAUUSD” and “BTCUSD” charts. Contact me after payment to send you the User-Manual PDF File. Double Top/Bottom Pattern Double top and bottom patterns are chart patterns that occur when the underlying investment moves in a similar pattern to the letter "W" (double bottom) or "M" (double top). Double top and bottom analysis are used in technical analysis to explain movements in a security or other inve
30 USD
200 X 8 = 1600  Symbols-Timeframes Full scan on the moment !!! This Indicator does  Not error  and  Not lag . Download directly   the indicator file here. (if you can't open on MT4).   This is the demo version of the indicator ( This version only shows patterns that have occurred in the past of the market (for testing). Download  full version here.   Harmonic patterns   Harmonic patterns can be used to spot new trading opportunities and pricing trends – but only if you know exactly what you
FREE
Pip Value One way to manage risk in trading (Money Management) is choosing the appropriate size of lots in terms of distance stop loss(risk). To calculate the appropriate size of lots, we need to know how much profit or lose a pair will give us when it moves a pip. That we call it "Pip Value". And this is an indicator for calculating it.   Pip Value Calculator Pip Value Indicator
FREE
This is the free Version, to download the   Full version   click here. The free version works on   “GBPCAD”   and   “BTCUSD”   charts. Contact me after payment   to send you the User-Manual PDF File. Harmonic Trading The secret is the Fibonacci. It has been proven in the markets that price always reacts to Fibonacci levels. Fibonacci levels are one of the most important indicators of price changes. Sometimes the sequence of reactions to these levels in the chart make geometric shapes, which are
FREE
Contact me after the purchase to send you the guide file and add you in "Waves Follower Group", share your experiences with other users. This indicator gives a signal when the probability of starting a trend is high. To calculate entry points, it uses a combination of some indicators like "Moving Average", "ADX", RSI with support and resistance points. This indicator is a trend follower and it doesn't determine that TP because it is not necessary, it uses the stop-loss trailing system (Of c
30 USD
MACD Divergences Demo(use on EURAUD ) The full version of the indicator is available   here  Using divergences is very common in trading strategies. But finding opportunities for trading with the eyes is very difficult and sometimes we lose those opportunities. The indicator finds all the regular and hidden divergences. (RD & HD) It uses an advanced method to specify divergence. This indicator is very functional and can greatly improve the outcome of your trading. This is a multi-time-frame indi
FREE
Download directly the indicator file here. (if you can't open on MT4) MACD Indicator is one of the most popular momentum indicators among users. Searching and detecting MACD signals by the eye may not be easy. Scan Full Charts Dashboard Indicator with simple user interface and search customization panel saves time and scans all charts for MACD signals search and notifies the user with high accuracy. After finding the signal, the user was aware of the result by alerts and notifications. This ind
FREE
Sometimes a trader needs to know when a candle will close and a new one appears to make the right decisions, this indicator calculates and displays the remaining of current candle time . It is simple to use, just drag it on the chart. Please use and express your opinion, expressing your opinions will promote the products. To see other free products, please  visit  my page.  
FREE
RSI Signal Scanner The primary trend of the stock or asset is an important tool in making sure the indicator's readings are properly understood. For example, some of the technical analysts, have promoted the idea that an oversold reading on the RSI in an uptrend is likely much higher than 30%, and an overbought reading on the RSI during a downtrend is much lower than the 70% level. This indicator notifies you of RSI important levels breakouts (30% and 70%) by searching among the symbols and chec
FREE
Currency Strength Gauge incicator Download the demo version here . It’s available for CHF , CAD , JPY and NZD currencies.   The currency strength gauge is an indicator to measure of the strength or weakness of currencies in the Forex market. Comparing the strength of currencies in a graphic representation will lead to a good overview of the market and its future trends. You will see in a graphic chart both the strength of the currencies and their correlation, and this will help you in your
30 USD
This utility manage your position risk by trailing stop with "Parabolic SAR" indicator value. Indicator Parameters SAR step(Parabolic SAR step value) SAR maximum(Parabolic SAR maximum value) Timeframes(Choose timeframes). Stop Place(put SL in current(open) candle or last close candle). Is the spread considered?(Set SL with considering to Spread or not, the choice is with you). Working with this utility is very simple, Just drag it onto the chart. There is no problem with multi-part trades. It is
FREE
Ichimoku Signals Dashboard To test the indicator please download demo version  here. Find Ichimoku signals as easy as you can. Ichimoku is one of the most powerful trends recognition indicators. And it has valid signals for the trades. This indicator scans several symbols and time-frames by the Ichimoku to find all the signals that you want and show in a dashboard. It's easy to use, just drag it onto the chart. It's better to add  Ichimoku indicator  to chart before adding this indicator. Ichimo
30 USD
Ichimoku Signals Scanner This is the Demo version, please download Full version  here. Find Ichimoku signals as easy as you can. Ichimoku is one of the most powerful trends recognition indicators. And it has valid signals for the trades. This indicator scans several symbols and time-frames by the Ichimoku to find all the signals that you want and show in a dashboard. It's easy to use, just drag it onto the chart. It's better to add  Ichimoku indicator  to chart before adding this indicator. Ichi
FREE
Currency Strength Gauge Indicator Demo Download the full version here . Use without restrictions.   The currency strength gauge is an indicator to measure of the strength or weakness of currencies in the Forex market. Comparing the strength of currencies in a graphic representation will lead to a good overview of the market and its future trends. You will see in a graphic chart both the strength of the currencies and their correlation, and this will help you in your decisions to get better t
FREE
Фильтр:
Arnold Theisz
253
Arnold Theisz 2023.05.11 09:04 
 

Hi, I bought your indicator, could you send me the indicator guide file, please? Thnx

Mihails Babuskins
57249
Ответ разработчика Mihails Babuskins 2023.05.12 16:38
I sent you.
Please check your PV. ☘️🌺 🙏
Xiaodi Zhang
671
Xiaodi Zhang 2023.05.03 12:07 
 

Can you send me the instructions?

Mihails Babuskins
57249
Ответ разработчика Mihails Babuskins 2023.05.03 22:37
Thank you ☘️🌺 🙏
And please check your PV.
Mohammed.
38
Mohammed. 2023.04.07 20:47 
 

I will write my experience with this indicator At the outset, I would really like to thank Mr. Mihails Babuskins This indicator is the biggest benefit you put with your trading strategies Remember, it is a utility only, not just one that can be relied upon It must be combined with your own tools I repeat my thanks to Mr. Mihails Babuskins

Mihails Babuskins
57249
Ответ разработчика Mihails Babuskins 2023.04.07 21:53
Thank you ☘️🌺 🙏
It's kind of you.
younissadam111
29
younissadam111 2023.04.05 06:13 
 

hello, I bought your indicator, could you send me the indicator guide file, please?

Mihails Babuskins
57249
Ответ разработчика Mihails Babuskins 2023.04.07 21:52
Thank you ☘️🌺 🙏
And please check your PV.
lightswitchx
173
lightswitchx 2023.03.30 21:40 
 

Hello, just purchased this indicator, I loved the limited demo version and I can't wait to start using it on more pairs. The indicator is quite accurate, the most accurate I have ever used. May I get the PDF strategy guide you have? Cheers April

Mihails Babuskins
57249
Ответ разработчика Mihails Babuskins 2023.04.01 20:00
Thank you ☘️🌺 🙏
And please check your PV.
Mario Soattini
859
Mario Soattini 2023.03.28 06:08 
 

ciao ottimo indicatore puoi inviarmi il file con le strategie ) grazie

Mihails Babuskins
57249
Ответ разработчика Mihails Babuskins 2023.04.01 20:00
Thank you ☘️🌺 🙏
And please check your PV.
1533309
86
1533309 2023.03.10 18:01 
 

hello , I bought your indicator ,could you send me the indicator guide file please i trade with rsi ini but need your guide

Mihails Babuskins
57249
Ответ разработчика Mihails Babuskins 2023.03.13 10:08
Thank you ☘️🌺 🙏
And please check your PV.
Olga Snizhko
914
Olga Snizhko 2023.02.28 10:09 
 

Useful indicator.

Mihails Babuskins
57249
Ответ разработчика Mihails Babuskins 2023.02.28 12:32
hank you very much ☘️🌺 🙏.
OssZ.tFx
91
OssZ.tFx 2023.02.27 19:09 
 

Hello bro, hope you doing great so far. This is my 3rd indicator of yours and i´m super happy with Harmonic pattern and 123 patterns, however this one will support my strategy pretty good, thanks. Can you send me said PDF please? To fully comprehend the settings

Mihails Babuskins
57249
Ответ разработчика Mihails Babuskins 2023.02.28 12:28
Thank you very much ☘️🌺 🙏
I also sent you the indicator guide PDF file.
Please read it.
highly recommend.
Philiip
42
Philiip 2023.02.26 12:46 
 

Пользователь не оставил комментарий к оценке

Mihails Babuskins
57249
Ответ разработчика Mihails Babuskins 2023.02.26 15:14
Thank you very much 🙏
I also sent you the indicator guide PDF file.
Please read it.
highly recommend.
⭐️⭐️⭐️⭐️⭐️
volga99
145
volga99 2023.02.24 17:57 
 

привет.я купил индикатор но руководство не прислали.почему такой игнор.кстати после активации стала глючить и зависать торговая платформа.работать невозможно

Mihails Babuskins
57249
Ответ разработчика Mihails Babuskins 2023.02.24 21:24
Hi Volga, you didn't ask me to send you the PDF file.
I sent the user-guide PDF file to your PV. ☘️ 🌹 🙏
Ukrit Taesuwan
189
Ukrit Taesuwan 2023.02.21 13:13 
 

Hi, I just bought your indicator today, would you mind sending me the user manual the guide? thank you

Mihails Babuskins
57249
Ответ разработчика Mihails Babuskins 2023.02.21 17:46
Thank you so much. 🌺🙏☘️
Please check your PV.
SkystheLimit 986
3879
SkystheLimit 986 2023.02.20 12:49 
 

Nice

Mihails Babuskins
57249
Ответ разработчика Mihails Babuskins 2023.02.20 12:51
Thank you so much. 🌺🙏☘️
Jungle Juice
38
Jungle Juice 2023.02.18 07:04 
 

Hi, I have purchased the indicator, please can you send me a profitable strategie guide. Thank you

Mihails Babuskins
57249
Ответ разработчика Mihails Babuskins 2023.02.20 12:51
Thank you so much. 🌺🙏☘️
Please check your PV.
elite luis
3037
elite luis 2023.02.17 04:36 
 

Simply the best and excellent support from Author with continuous update and improvement, well worth best purchase 2023!

Mihails Babuskins
57249
Ответ разработчика Mihails Babuskins 2023.02.17 19:46
Thank you so much. 🌺🙏☘️
kadir260409
24
kadir260409 2023.02.04 18:28 
 

hi, bought the indicator reading so many positive comments. I'm sure they are very happy with it. I have very high expectations too. please send the file.

Mihails Babuskins
57249
Ответ разработчика Mihails Babuskins 2023.02.05 17:14
Thank you ⭐️⭐️⭐️⭐️⭐️
I sent you the guide file , Please check your PV. 👈
Jack Hudson
193
Jack Hudson 2023.01.17 14:19 
 

I tried the limited version yesterday and saw quality divergence signals. I just loaded it and combined with my S/D zones just like the limited version it gave high quality signals. Thrilled to have it to add to my trade plan. Very low cost for something with this quality. Also please send guide.

Spyro
72
Spyro 2022.12.28 12:49 
 

Hi, I have purchased the indicator, please can you send me a profitable strategie guide. Thank you

Mihails Babuskins
57249
Ответ разработчика Mihails Babuskins 2022.12.28 13:28
Thank you. 🌹☘️🙏.
Please check your private messages.
dev1981
246
dev1981 2022.11.11 05:51 
 

hello bought it yesterday and looking to use it with my strategy...please send me detailed guide for more info

Mihails Babuskins
57249
Ответ разработчика Mihails Babuskins 2022.11.29 06:43
Thank you ⭐️⭐️⭐️⭐️⭐️
I sent you the guide file , Please check your PV. 👈
pllm2708
1904
pllm2708 2022.09.22 07:30 
 

Hi Mihalis,

Just bought this indicator. I think it has huge potential but I think it needs improving. Please see screen shot. My other divergence indicator which I also bought from MQ5 site gave an alert of Bullish Regular Divergence on the NZDJPY 4H chart. I immediately opened the NZDJPY 4H chart and its very clear that there was indeed a Bullish Regular Divergence on it (please see screen shot where I high lighted with green lines). But sadly and very disappointingly, your indicator totally failed to catch it when it was so obvious and clear. I used the same 14 period in both indicators. However, in your indicator, I could only change the period and nothing else. The only reason why I purchased your product was because yours is the only one which visually draws out the divergence lines and to me it is a huge plus and a huge advantage over the other indicators available here. However, quite disappointed that it failed to catch the above described divergence. 3 stars for now, will review my rating again if things gets improved. Otherwise, 3 stars is my honest rating as it is now.

How do I upload my screen shot here?

Mihails Babuskins
57249
Ответ разработчика Mihails Babuskins 2022.12.14 02:36
Bullish Regular Divergence on the NZDJPY 4H on 22 September??? Please see the chart again!
Of course, my indicator does not send the signal before confirmation!
Now see the chart !!! It's bearish hard !!!
The other indicator that you compare with mine is a failure. Just Look at the results of the EA that I design with this indicator:
https://www.mql5.com/en/signals/1746993
123
Ответ на отзыв
Версия 1.8 2023.02.18
The number of indicators increased to 10 (Awesome Oscillator, AC, RVI, and DeMarker were added).
The ability to send emails was added.
The overlapping feature has been added, and now the indicator can be added to a chart multiple times to see simultaneous divergences in different indicators.
Версия 1.7 2022.09.24
Some changes applied.
Версия 1.6 2022.05.18
The divergence detection in "Stochastic" Method is improved.
Версия 1.5 2022.05.08
Oscillator display mode improved.
Версия 1.4 2022.03.24
Some features improved
Версия 1.3 2022.03.24
Push notification feature upgraded.
Indicator buffers updated (you can use the indicator buffers in your expert).
Версия 1.2 2022.03.05
Divergences recognition accuracy improved.
Версия 1.1 2021.11.10
Some features improved.