• Обзор
  • Отзывы (3)
  • Обсуждение (17)
  • Что нового

Equilibrium Fractal Wave Analytics MT4

5

Введение в Equilibrium Fractal Wave Analytics (аналитику равновесных фрактальных волн)

EFW Analytics исходит из принципа "Мы торгуем, потому что на финансовом рынке есть закономерности". EFW Analytics - набор инструментов для повышения эффективности торговли путем обнаружения повторяющихся фрактальных геометрических паттернов на финансовом рынке (пятая закономерность). EFW Analytics - один из нескольких инструментов, поддерживающих торговую логику без необходимости тестирования на истории. Инструмент состоит из трех частей:

  • Equilibrium Fractal Wave Index - индекс равновесной фрактальной волны. Исследовательский инструмент для поддержки торговой логики
  • Shape Ratio Trading System - коэффициент формы. Торговая система 1
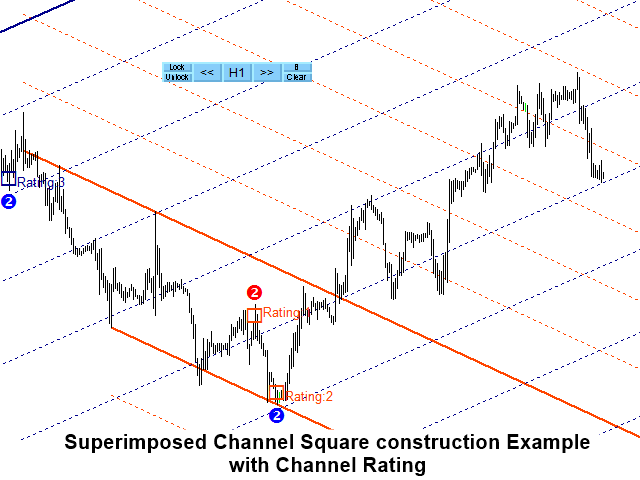
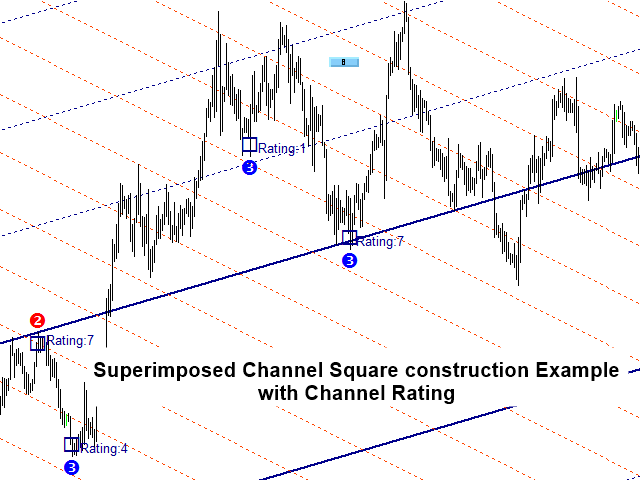
  • Equilibrium Fractal Wave Channel - равновесный фрактальный волновой канал. Торговая система 2


Equilibrium Fractal Wave Index (индекс равновесной фрактальной волны)

Индекс представляет собой аналитический инструмент. Используется так же, как и показатель Хёрста, названный в честь Гарольда Эдвина Хёрста (1880-1978), и фрактальная размерность, введенная Мандельбротом в 1975 г. Индекс EFW помогает подтвердить наличие равновесных фрактальных волн на финансовом рынке. Однако индекс равновсных фрактальных волн более практичен и интуитивно понятен при трейдинге по сравнению с указанными выше. Значение индекса варьируется от 0.0 до 1.0 и более. Чем выше значение, тем более значительно присутствие определенной формы равновесной фрактальной волны. Если индекс ниже 0.2, коэффициент формы можно не принимать во внимание при трейдинге.


Shape Ratio Trading System (торговля по коэффициенту формы)

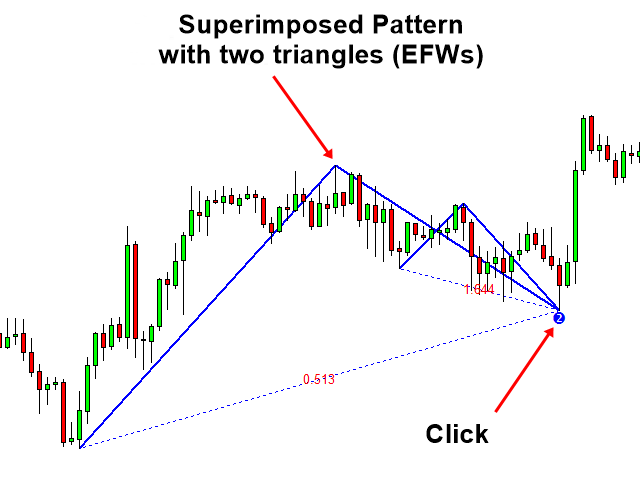
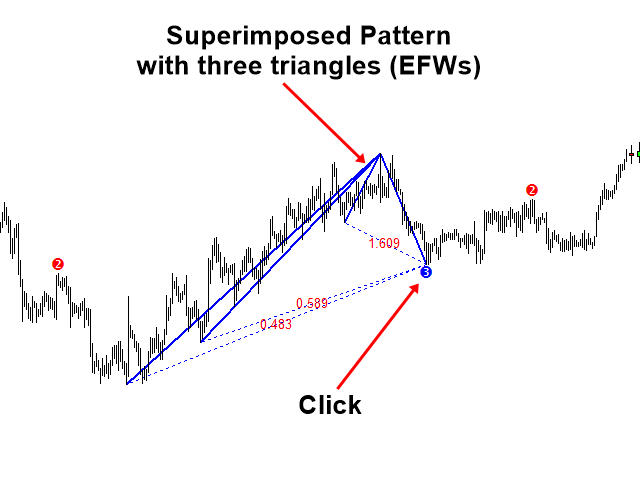
Первый метод использования равновесных фрактальных волн в трейдинге - коэффициент формы. Его использование напоминает торговлю по уровням или расширениям Фибоначчи. Но есть несколько отличий. При торговле по коэффициенту формы мы не ограничиваемся лишь коэффициентами Фибоначчи. К тому же, мы не принимаем как должное, что каждый коэффициент будет вести себя одинаково независимо от финансового инструмента. С учетом сказанного коэффициенты выбираются с использованием индекса EFW.


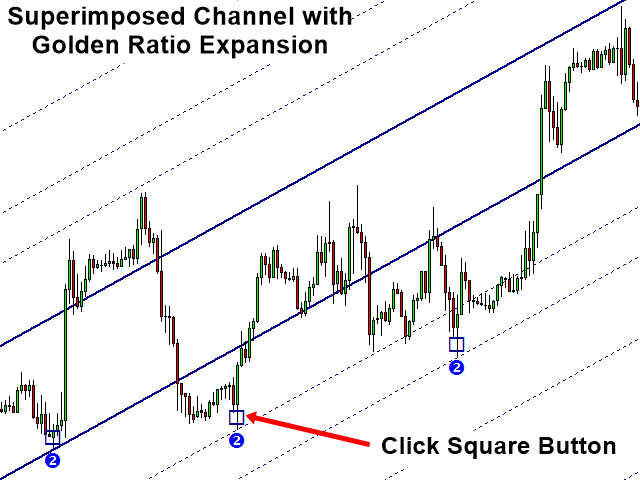
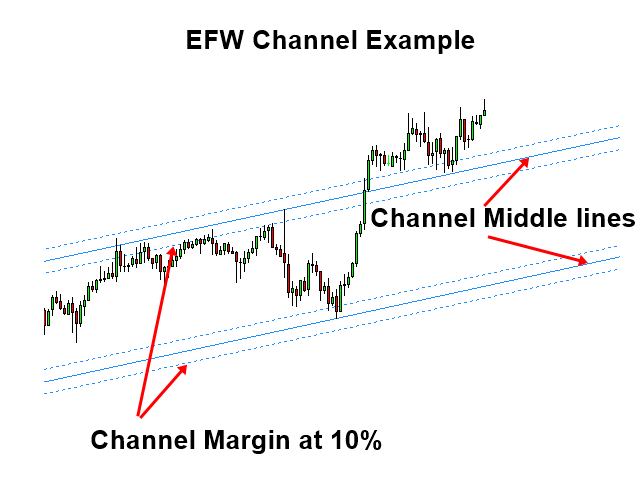
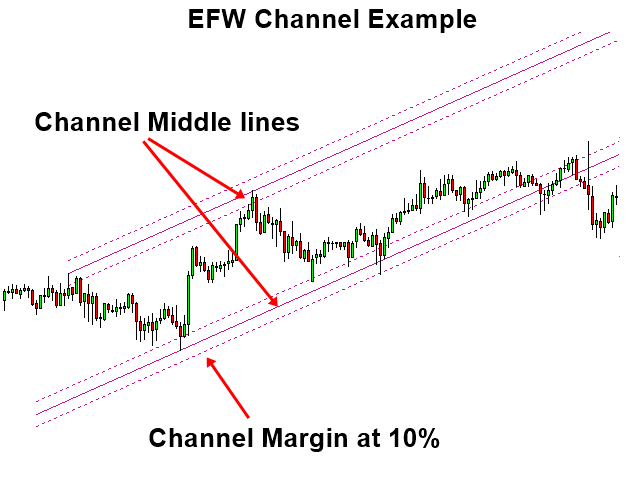
Equilibrium fractal wave channel (равновесный фрактальный волновой канал)

Использование канала EFW не составляет труда. Вы можете использовать метод пропорционального запуска (proportional trigger method), описанного в книге "Financial Trading with Five Regularities of Nature: Scientific Guide to Price Action and Pattern Trading" (Торговля на финансовых рынках с применением пяти природных закономерностей: Движение цены и торговля по паттернам", 2017, Янг Хо Сео).


Как торговать

Доступны следующие режимы:


Регулируемые входные параметры

Индикатор позволяет выбрать до трех коэффициентов формы для трейдинга. Ниже перечислены некоторые важные входные параметры.

  • Set false to switch off EFW Channel - при false отключить канал EFW
  • Timeframe to detect patterns - таймфрейм для обнаружения паттернов 
  • Max number of patterns to display - максимальное число отображаемых паттернов
  • Pattern Index - индекс начального паттерна
  • Trigger Margin for channel - ширина значения срабатывания канала
  • Trigger Margin for Shape ratio - ширина значения срабатывания при торговле по коэффициенту формы
  • Enable sound alert - звуковой алерт
  • Send email if pattern is found - уведомления по электронной почте 
  • Send notification if pattern is found - push-уведомления
  • Use white background for chart - при false используется черный фон графика
  • Amount of bars to scan for pattern search - количество баров для поиска паттерна
  • Pattern Update Frequency - частота обновления паттерна
  • EFW Index Period - период расчета индекса EFW
  • Shape ratio 1, 2, 3 - коэффициент формы (0.1-1.0)


Отзывы 3
elite luis
3037
elite luis 2023.03.05 15:31 
 

I agreed with Vincent review 100% Amazing Wave and Superimposed patterns! Thanks Author! but need some manual instruction pdf or url on the setting that explain how to use, the previous tutorial link you posted in comment I click but no instruction cannot find anything, I've posted some comment question in comment page, please help answer my questions?

*updated review 10/3/2023 * What I like about this is able to draw trend for different period easily with a click of a button and it also draw trend into the future and price reacted to the line, accurate and amazing!

Vincent Paul Colombe
684
Vincent Paul Colombe 2022.01.13 22:34 
 

One of my favourite indicator! Superimposed patterns are killers, and great efficiency in weekly or even monthly timeframe. Heartly recommended ñ

Petter Rogstad
536
Petter Rogstad 2021.09.24 03:43 
 

This is no doubt my best investment on MQL5. This is like the Ferrari of indicators. Have a learning curve and take some time to understand but after some time you get a very good understanding of what is happening in the market. You understand how pattern and cycles repeat itself and you can benefit from this knowledge and gain competitive advantages.

Рекомендуем также
Displays the shortest possible waves for intraday trading or scalping Revolutionary novelty Fox wave provides an indicator that draws wave values ​​on all 28 pairs plus xauusd. EURUSD,USDCAD,EURAUD,GBPJPY,NZDJPY,GBPNZD,CADCHF,USDJPY,NZDUSD,EURCAD,AUDJPY,GBPAUD,AUDCAD,NZDCAD,GBPUSD,EURJPY, EURCHF,CADJPY,GBPCAD,AUDCHF,NZDCHF,AUDUSD,EURGBP,EURNZD,CHFJPY,GBPCHF,AUDNZD,USDCHF,USDJPY You have a constant overview of the state of the market Bonus : Day, Week, Month and Annual ranges and fibos
889 USD
Trend Scanner
Vladimir Kalendzhyan
4.43 (7)
By purchasing this indicator, you have the right to receive a free copy of one of   my other indicator's or advisor’s!  (All future updates are included. No limits) . To get it , please contact me by  mql5 message ! Индикатор трендовых линий Trend Scanner показывает направление тренда и его изменение. Индикатор работает на всех валютных парах  и таймфреймах. Индикатор отображает на графике цены сразу несколько показателей: линии поддержки и сопротивления валютной пары, существующие трендовые лин
50 USD
BinaryByte Indicator
Mohammad Iskandar Bin Rabudin
Introducing the BinaryByte Indicator: Unleash the Synergy of Powerful Technical Analysis Tools! Are you searching for an innovative and powerful indicator to elevate your trading performance? Look no further! The BinaryByte Indicator is here to provide you with the edge you need to succeed in the Forex market. Key Features: Experience the perfect blend of advanced technical analysis tools, combining Moving Averages, RSI, Bollinger Bands, and Candlestick patterns. Maximize your trading potential
50 USD
Introduction to X3 Chart Pattern Scanner X3 Cherart Pattern Scanner is the non-repainting and non-lagging indicator detecting X3 chart patterns including Harmonic pattern, Elliott Wave pattern, X3 patterns, and Japanese Candlestick patterns. Historical patterns match with signal patterns. Hence, you can readily develop the solid trading strategy in your chart. More importantly, this superb pattern scanner can detect the optimal pattern of its kind. In addition, you can switch on and off individu
250 USD
Идеальный инструмент для Скальнга на рынках Форекс  Можно торговать как от сигнала до сигнала так и с использованием take profit В алгоритме не используется Zigzag ! Нет перерисовки ! Это канальный инструмент в качестве фильтра используется скользящая средняя Moving Average По настройкам есть 2 параметра  Ma Period = 5 период Moving Average Channel 1.0 дистанция линий канала от графика Price Signal Filter рассчет открытия сигнала и фильтра Есть полный комплект Alert Есть мультитаймфеймовы режим 
400 USD
Advanced Trend Regime
Shellard Securities (Pty) Ltd
The indicator has been designed to function on any time-frame and any pair.   This regime filter will help the trader better evaluate whether the current market is trending, and in which direction. It quickly reacts to changes in market dynamics using a series of advanced calculations. The user is able to select whether the calculation remains standard, or if a further filter constraint is added to the calculation.   A Yellow moving average of the signal has been included for the trader to smoot
50 USD
Trend Line Chart Pattern Signals  Is a traders Tool for Signals based on Strong  Patterns Formed By a pair of robust trend lines. They FOR WITH DIFFERENT POPULAR PATTERNS ON CHARTS LIKE – TRIANGLES, FLAGS,RANGE , ASCENDING TRIANGLES, DESCENDING PATTERNS, PENNANTS ETC. The TREND LINES  form  dynamically  on running bars. The  sensitivity  of the trend lines can be changed by custom settings. The  Buy and Sell Signals Generate upon Break Of the Trend Line + "Close" of the same bar above the previo
80 USD
Note: The price is subject to increase at any time from now!  Hi Traders, I would like to introduce to you my new indicator called the Infinity Oscillator Indicator. This indicator is designed for both newbies and professional traders. Parameters The inputs that can be changed by the user are colors of the lines only so as to not disturb the original trading strategy this indicator uses. The indicator will not provide buy and sell arrow signals but will help traders in market analysis approach
250 USD
Diver Hurst
Oleksandr Medviediev
Формирование Дивергенции Hurst (далее по тексту "Дивер") - основана на экспоненте Херста, используемой в качестве измерения долговременной памяти временных рядов. Классические (обычные) и Реверсивные (скрытые) Дивергенции - на ваш выбор: Регулируемые размеры и все параметры Гибкие настройки, включая уровни отмен (дополнительная функция алертов, стрелки показывают, в каком направлении торговать) Не перерисовывается (установить CalcOnOpenBar =false) "SetIndexBuffer" для всех переменных (может быть
250 USD
There are 8 types of this indicator. Consisted of 1. Bullish and Bearish Engulfing 2. Morning and Evening Star 3. Three Green Soldiers and Three Red Crows 4. Three Inside Up and Down 5. Three Outside Up and Down 6. Bullish and Bearish Harami 7. Tweezers Top and Bottom 8. Piercing and Dark cloud cover Signal Filter :: 1. The appearance of the candle stick 2. SMA 3. 2EMA :: EMA Fast and EMA Slow 4. RSI N otification :: 1. Via screen 2. Email 2. Phone For trading 1. Scaling 2. Binary options
299 USD
GTAS FibTdi
Riviera Systems
3.2 (5)
Индикатор GTAS FidTdi использует сочетание волатильности и потенциальных уровней коррекции. Этот индикатор был создан Бернардом Пратсом Деско (Bernard Prats Desclaux), трейдером и бывшим менеджером хедж-фонда, основателем E-Winvest. Описание Индикатор представлен собой красную или зеленую огибающую выше или ниже цены. Инструкция по применению Обнаружение тренда Когда огибающая зеленого цвета, тренд бычий. Когда она красная, тренд медвежий. Торговля После открытия сделки GTAS FibTdi показыв
FREE
Данный индикатор следит за рынком в поисках состояния флета и последующего его прорыва. Флет определяется как заданное количество последовательных баров, на которых цена колеблется в небольшом диапазоне. Если один из следующих баров закрывается вне диапазона, индикатор сигнализирует прорыв. Индикатор выводит 3 линии: синяя - верхняя граница диапазона флета И последующая зона контроля прорыва; красная - нижняя граница диапазона флета И последующая зона контроля прорыва; желтая - центр диапазона ф
30 USD
"Тренд - друг трейдера" . Это одна из самых известных пословиц в трейдинге, потому что правильное определение тренда может помочь заработать. Однако проще сказать о торговле по тренду, чем сделать, потому что многие индикаторы основаны на развороте цены, а не на анализе тренда. Они не очень эффективны при определении периодов тренда или в определении того, сохранится ли этот тренд. Мы разработали индикатор Trendiness Index , чтобы попытаться решить эту проблему. Индикатор определяет силу и напра
49 USD
Свинг-трейдинг - это первый индикатор, предназначенный для обнаружения колебаний в направлении тренда и возможных разворотов. Он использует базовый подход свинговой торговли, широко описанный в торговой литературе. Индикатор изучает несколько векторов цен и времени для отслеживания направления совокупного тренда и выявляет ситуации, когда рынок перепродан или перекуплен и готов к исправлению. [ Руководство по установке | Руководство по обновлению | Устранение неполадок | FAQ | Все продукты ]
175 USD
ACB Breakout Arrows
KEENBASE SOFTWARE SOLUTIONS
4.17 (35)
The ACB Breakout Arrows indicator provides a crucial entry signal in the market by detecting a special breakout pattern. The indicator constantly scans the chart for a settling momentum in one direction and provide the accurate entry signal right before the major move.  Get multi-symbol and multi-timeframe scanner from here - Scanner for ACB Breakout Arrows MT4 Key features Stoploss and Take Profit levels are provided by the indicator. Comes with a MTF Scanner dashboard which tracks the brea
145 USD
Это осциляратор с фильтром по уровням поддержки и сопровождения данный инструмент создан для бинарных опционов  он очень прост в использовании  Имеет очень хорошие показатели правильных сделок 80-90% ( на этом и обоснована стоимость) Сигналы Стрелка красного цвета направленая в низ сигнал на понижение Стрелка синего цвета направленая в верх сигнал на повышение Рекомендуемое время эксплуатации: 1-2 свечи Таймфрейм: любой  Символ для торговли: Любой Сесия: Любая Торговать во время выхода новостей
1 338 USD
UniversalIndicator - универсальный индикатор. Отличный помощник для начинающих и профессиональных трейдеров. В алгоритме индикатора используются вероятностные и статистические методы анализа цены торгового инструмента. Индикатор устанавливается обычным образом. Преимущества индикатора работает на любом временном периоде работает с любым торговым инструментом имеет высокую вероятность положительного прогноза не перерисовывается Параметры индикатора LengthForecast  =30 - количество прогнозируемых
400 USD
Это трендовый индикатор без перерисовки Разработан вместо стратегии бля бинарках опционов (по цвету свечи мартингейл) Так же хорошо работает в торговле на рынке форекс Когда открывать сделки ( бинарные опционы ) Сигнал появится в месте с свечой сигналит на текущую свечу  Открывать сделку стоит на одну свечу текущего таймфрейма рекомендуется м1 и М5 При появлении синей точки открываем сделку вверх При появлении красной точки открываем сделку в низ. Как открывать сделки на Форекс. При полу
1 000 USD
Индикатор показывает изменения цены за те же дни в прошлые годы. Требуется таймфрейм D1. Индикатор предсказывает на основе баров D1 на тех же днях прошлых лет относительное изменение цен. Параметры: LookForward - количество дней (баров) для показа "будущих" изменений цен; по-умолчанию - 5; Offset - количество дней (баров) для сдвига назад по истории; по-умолчанию - 0; ShowAverage - переключатель режима; true - показывать среднее для всех 8 прошлых лет и границы стандартного отклонения; false - п
FREE
Price Breakout pattern Scanner - это полностью автоматический и мощный анализ для трейдеров и инвесторов. Он определяет следующие паттерны на графике. Голова и Плечи - Распространенный паттерн для торговли. Обратная Голова и Плечи - эта модель обратна паттерну Голова и плечи. Двойная вершина - когда цена дважды достигает уровня сопротивления и снизится к уровню поддержки, трейдер может ожидать внезапный медвежий прорыв уровня поддержки. Двойное дно - двойное дно является противоположностью формы
100 USD
MetaTrend M4
Vahidreza Heidar Gholami
5 (1)
Meta Trend Indicator is an efficient way to forecast and detect the trend in any market. It reveals the trend, support and resistance levels, volatility and the maximum potential target, all in one indicator. To adapt to the price and to decrease consecutive trend failures, the internal trend detector algorithm studies the market and dynamically chooses the right values for the internal parameters. This indicator is a perfect trend filter for any strategy or expert advisor. Features Super Adapti
99 USD
It will be the best tool for you to make a profit! Through unique algorithms You're going to see an amazing amount of right trading signals Make huge profits every day and realize more possibilities!   Like the car no money to buy it, the love of the girls dare not to pursue?Or the credit card bill is not paid, the rent does not have the extra money to settle?Or are you fed up with being bossed around by your boss and Hope to get more people's respect?Can't afford to buy the things you want ? wa
149 USD
FX Flow   indicator can be used as an anticipator of the next trend, preferably confirmed by Price Action or another oscillator (RSi, Stochastic ..). It takes the money flows of the major currencies USD EUR GBP AUD NZD CAD CHF JPY into account, and processes them. Excellent tool for indices, but also for correlations between currencies. Works on each timeframes.  Blue line: Bull market Yellow line: Bear market Note : if the indicator opens the window, but does not draw lines, load the histo
299 USD
Chart Patterns Detect 15 patterns (Ascending Triangle, Descending Triangle, Rising Wedge, Falling Wedge, Bullish Flag, Bearish Flag, Bullish Rectangle, Bearish Rectangle Symmetrical triangle, Head and Shoulders, Inverted Head and Shoulders, Triple top, Triple Bottom, Double Top, Double Bottom) Use historical data to calculate the probability of each pattern to succeed (possibility to filter notification according to the chance of success) gives graphic indication about the invalidation level and
58 USD
МТФ-индикатор уровней поддержки и сопротивления, построенных на экстремумах индикаторов Advanced ZigZag Dynamic и/или Extended Fractals с отключаемым ценовым значением в виде меток. Для режима МТФ можно выбрать все более старшие ТФ. По умолчанию уровни строятся на основе точек индикатора "Зигзаг", можно также использовать для построения точки индикатора Фракталов совместно с Зигзагом или вместо него. Для упрощения работы и экономии процессорного времени расчёт происходит один раз на каждом баре
30 USD
BPS Panel Breakout Pro Scalper Solution Panel This indicator is part of the   RPTrade Pro Solutions  systems. BPS Panel   is a daily trend indicator using Price Action, Dynamic Support and Resistances. It's designed to be used by anyone, even the absolute beginner in trading can use it. NEVER repaints . Indications are given   from close to close . Designed to   be used alone , no other indicators are required. Gives you the trend and potential Take Profit at the beginning of the day. How
1 300 USD
Intraday Levels показывает сетку внутридневных уровней для внутридневной торговли Показывает сетку для дневных уровней, дает ориентир для распознания тренда и для измерения внутридневных сделок (стоп-лосс и тейк-профит). Параметры: Levels Mode - Режим уровней: Basic mode: Базовый режим, показывает самый высокий, самый низкий и средний уровни. Advanced mode: Расширенный режим, показывает самый высокий, самый низкий, средний и промежуточные уровни. Fibonacci mode: Режим Фибоначчи, показывает у
60 USD
AI Forecast MT4
Leonardo Antonio Camacaro Armas
The "AI Forecast" indicator is the result of a unique experiment in which I asked an AI how to create the best indicator to anticipate the market. The AI suggested measuring the past history of the price and its reactions to different levels, and then calculating the probabilities of the price reaction in the future. With this idea, I designed with the help of another AI the "AI Forecast" indicator, which adapts to any MetaTrader chart and shows you three lines: one for entry and two for poss
100 USD
The CCI Divergence is a reasonably useful indicator in itself, but it is even more effective when used with divergence pattern trading. The CCI Divergence indicator signal is one of the most potent signals among the indicators that exist in the market. Here is new version for Divergence Indicator using CCI method, with more improvements. Divergences indicate a potential investment point because the directional moment does not confirm the price. A bullish divergence occurs when the underlying
49 USD
Automated Trendlines
Georgios Kalomoiropoulos
5 (16)
Линии тренда являются наиболее важным инструментом технического анализа в торговле на рынке Форекс. К сожалению, большинство трейдеров рисуют их неправильно. Индикатор Automated Trendlines — это профессиональный инструмент для серьезных трейдеров, который поможет вам визуализировать трендовое движение рынков. Есть два типа линий тренда: бычьи линии тренда и медвежьи линии тренда. В восходящем тренде линия тренда Форекс проводится через самые низкие точки колебания ценового движения. Сое
99 USD
С этим продуктом покупают
Ultimate Sniper Dashboard
Hispraise Chinedum Abraham
4.65 (23)
Скидка $299! Цены могут вырасти в будущем! Читайте описание ниже! Лучшая система ввода для Ultimate Sniper Dashboard: ПРЕДЕЛЬНЫЕ ДИНАМИЧЕСКИЕ УРОВНИ. (Пожалуйста, проверьте мои продукты) Ultimate Sniper Dashboard работает ТОЛЬКО на реальных рынках из-за ограничений мультивалютного тестирования MT4. Представляем вам Ultimate-Sniper Dashboard! Наша самая лучшая панель, которая содержит HA-Sniper, MA-Sniper и множество специальных режимов. Ultimate Sniper Dashboard - это абсолютный зверь!
299 USD
А. Что такое A2SR?   * Это опережающий технический индикатор (без перерисовки, без запаздывания) . -- Учебники : -- на https://www.mql5.com/ru/blogs/post/734748/page4#comment_16532516   -- и https://www.mql5.com/ru/users/yohana/blog A2SR имеет особую технику определения уровней Поддержки (спроса) и Сопротивления (предложения). В отличие от обычного способа, который мы видели в сети, A2SR имеет оригинальную концепцию определения фактических уровней SR. Оригинальная техника не была взята из Инте
386 USD
Ваш успех как трейдера зависит от умения определять состояния перекупленности и перепроданности валюты или символа. То есть их силу или слабость. Именно этот подход и лежит в основе торговли на рынке Forex. Сделать это быстро и просто самому было бы практически невозможно, не будь индикатора Quantum Currency Strength - слишком много валют и символов. Вам определенно понадобится помощь! Индикатор Quantum Currency Strength был создан с единственной целью: дать вам глобальную картину по восьми осно
279 USD
Это, пожалуй, самый полный индикатор автоматического распознавания гармонического ценообразования, который вы можете найти для платформы MetaTrader. Он обнаруживает 19 различных паттернов, воспринимает проекции Фибоначчи так же серьезно, как и вы, отображает зону потенциального разворота (PRZ) и находит подходящие уровни стоп-лосс и тейк-профит. [ Руководство по установке | Руководство по обновлению | Устранение неполадок | FAQ | Все продукты ] Он обнаруживает 19 различных гармонических цен
249 USD
THEQ Volumen
Luis Alberto Vazquez Carpio
5 (1)
THEQ Volume отображает точный осциллятор громкости. Его можно использовать для торговли в соответствии с тенденциями или возможными изменениями тренда. THEQ Volume также включает в себя стрелки объема THEQ, индикатор с сигналами и предупреждениями, а также советник THEQ Volume EA для реального / демонстрационного использования, тестирования и оптимизации или создания собственной стратегии. Дополнительный индикатор и советник-робот отправляются отдельно после оплаты. THEQ Volume не перерисовывает
495 USD
Moonwalker
Cengiz Erkoyuncu
5 (6)
Индикатор Moonwalker MT4 - мощный инструмент, который может революционизировать вашу стратегию трендовой торговли на графиках Renko. Его продвинутые алгоритмы обеспечивают непревзойденную надежность путем отслеживания рыночных тенденций, фильтрации внезапных колебаний и шума рынка. Это позволяет вам торговать легко и уверенно, не испытывая стресса от постоянного мониторинга рынков. В отличие от других индикаторов, Moonwalker не перерисовывает и не изменяет свои сигналы в прошлом, что означает,
250 USD
Please send me Direct message on MQL5 CHAT after purchasing the Indicator for Training and Installation Support There are some additional files that is important to use with the Indicator . So be sure to contact me after purchasing the Indicator So that I can add you for training and support . If you find any difficulty with installation then send me Direct message here So that I can connect with you via Anydesk or Teamview for the product installation. " Smart Order Block Indicator " to find
249 USD
Этот индикатор астрономии для платформы MT4 выполняет множество функций с использованием сложных алгоритмов для выполнения собственных вычислений, которые настолько точны. Индикатор имеет панель, которая предоставляет астрономическую информацию, такую как гео/гелиоцентрические координаты планет, расстояние между Солнцем/Землей, величину, угловое расстояние, созвездие, эклиптические координаты, экваториальные координаты и горизонтальные координаты в зависимости от вертикальной линии, которую созд
600 USD
Robot Choppiness
Diego Mauricio Padilla Mendez
5 (1)
Робот Choppines загружается в качестве индикатора в папку индикаторов MT4. Рекомендуется использовать таймфрейм 5-минутной свечи, рекомендуемое время экспирации робота 5 минут. Робота можно настроить на отправку сигналов на платформы MT2, MX2, PRICEPRO. Для отправки сигналов необходимо использовать программу-коннектор платформы, с которой вы хотите работать. Для установки в коннектор выполните следующую процедуру (прилагается изображение, описывающее конфигурацию с коннектором платформы М
399 USD
Urgent reminder> Only 15 copies remaining for the price to double on all renting options. Get your copy Today! Introduction Dear Traders, I am always working to come up with tools that may help you to become a better trader and investor. Due to my experience in trading and market analysis and trading software design and development, I am glad to introduce to you my other tool called " Amazing Entries Indicator ". The Indicator is designed in a way that it combines different strategy to provide
1 500 USD
NAM Divergences
NAM TECH GROUP, CORP.
5 (1)
MT4 Мультитаймфреймовый индикатор дивергенции и обнаружения перекупленности / перепроданности. Функции - Полностью настраиваемая панель управления графиком, обеспечивает полное взаимодействие. - Скрыть и показать панель управления где угодно. - Информация о расхождениях без заглавной буквы в реальном времени. - Информация в реальном времени о ситуациях перекупленности / перепроданности. - Информация о регулярных расхождениях в реальном времени. - Информация о скрытых расхожден
250 USD
Currently switched to the 4 hour chart - but use other time frames for confirmation. :-)  I change my main time frame based on the market movement at the time. The Hurricane Forex Indicator is a multi time frame indicator that includes such things as Trade Notifications, Trade Calculator, Momentum Indicator, risk reward and much more. We have a free Trade room for our users as well. Please check out the video for full details of how this indicator works as it has over 15 years worth of developme
599 USD
Индикатор из серии Real Non RePaint MultiTimeFrame (Real NRP MTF). Специально разработан для отображения показаний стандарного индикатора Stohastic со старшего таймфрейма (ТФ) на младшем. Индикатор отличается от стандартного шкалой - симметричен относительно 0. Для получения значений стандартного добавьте к показаниям 50.0. Не подсматривает в будущее на истории на старшем ТФ НЕ ОТЛИЧАЕТСЯ от показаний стандартного индикатора в реальном времени (с учетом смещения), но показывает реальное отсчеты
220 USD
[ MT5 Version ] Order Block Indicator MT4 Order Block Indicator MT4  is currently the most accurate and customizable indicator in the market. It has been developed to facilitate the analysis of operations based on Order Blocks and Supply and Demand Zones. These zones are possible reversal points of a movement. Order Blocks indicate a possible accumulation of orders in one area. The price usually gets to reach and react strongly to those areas. The most relevant levels for this reaction are the c
224 USD
www.tradeightrading.com The tool identifies the real movement that the forex market uses, with real mathematical calculations based on the price changes. Tradeight execution is based on this mathematical relationship that be always existed. Most traders look at the same things on charts and study the same information.. the reason because the majority lose money. It is a tool based not on the ideas of the majority but on the real foundations that rule the forex market. The tool is a visual tool,
500 USD
INTRODUCING WORLD'S FIRST MT4 & MT5  Gann Dynamic Square, Circle and Equilateral Triangle  To Analyze Market Geometric Relationship. Gann Dynamic Square  has some of the most impressive features you will ever find in Gann & Geometric Analysis world. The Gann Dynamic Square is a tool to draw offset Square,Equilateral Triangle & Circle.Most charting software or MT4/MT5 market indicators don't have these features. You will be able draw your Geometric shapes like a professional geometric analys
399 USD
Buy and Sell Arrows On The Chart According To Price Action Sends Alerts On MT4 To Your Phone To You Email Does NOT repaint. Works on any pair, any timeframe.     10 Activations allowed so you are free from limitations. MT5 Version here . When you get a signal, all you need to do is check the previous structue highs and lows to use as your stop loss and take profit. See the video below. Settings: Apart from the times you want to get signals and where you want alerts, there is only o
297 USD
FFXMV Dashboard Plus
Opengates Success International
FFXMV Dashboard Plus This is a custom indicator created to give Traders a full view of what is going on in the market. It uses a real time data to access the market and display every bit of information needed to make successful trading. The PLUS there to produce the kind of RESULTS as you see in the SCREENSHOTS, I added a MultipleOrder Utility EA with it with instructions on how to use it with FFXMV Dashboard. INSTALLATION : Read the MANUALS that comes with the rest of the PACKAGE after yo
850 USD
The Nihilist 5.0 Indicator includes Forexalien and Nihilist Easy Trend trading strategies and systems. It is composed of an MTF Dashboard where you can analyze the different input possibilities of each strategy at a glance. It has an alert system with different types of configurable filters. You can also configure which TF you want to be notified on your Metatrader 4 platform and Mobile application The indicator has the option to view how could be a TP and SL by using ATR or fixed points, even
299 USD
Buy and sell arrows on the chart when the trend is about to continue. Aslo Sends Alerts – On MT4 To Your Phone To Your Email. Does not repaint. Works on any pair, any timeframe.   (Just ajust the settings for your pair and timeframe.) 10 Activations allowed so you are free from limitations See an example of alerts from today (23 May 2020) using this and 2 other indicators  here . MT5 version here . The indicator provides accurate buy and sell arrows on the chart when the trend is
297 USD
VTrende Pro MT4 - МТФ индикатор для трендовой торговли с панелью индикации для МТ5 !!! - Подробное описание на русском языке под видео (на Youtube) - !!! Хотя сигналы индикатора VTrende Pro можно использовать, как сигналы полноценной торговой системы, рекомендуется применять их в связке с ТС Билла Вильямса. VTrende Pro MT4 - это расширенная версия индикатора VTrende . Отличие Pro версии от VTrende: - Временные зоны - Сигнал V - сигнал 1-2 волн Основная задача индикатора - определить т
697 USD
Buy and Sell Arrows when price is about to retrace. It Also Sends Alerts – On MT4 To Your Phone To Your Email Does not repaint. Works ony any pair, any timeframe. 10 Activations allowed so you are free from limitations See an example of alerts from today (23 May 2020) using this and 2 more of my indicators  here . MT5 Version here . What is a Retracement and why is it important to you? As you know, the market goes through phases of trend and retracement. Price can only move so fa
297 USD
Наконец, был официально выпущен инструмент торговли ценовым действием без перерисовки. [V1.60] MTF Precise Price Action Arrow отфильтровано. Индикатор MTF Precise Price Action Arrow использует комбинацию нескольких индикаторов для усиления направления рынка. Чтение ценового действия и измерение его силы — дело субъективное, и на освоение этого метода уходят годы. Цель индикатора - сделать чтение направления ценового действия максимально объективным. Философия: Использование только одн
1 099 USD
MT5 Version   Kill Zones   SMT Divergences Order Blocks ICT Multi TF The Order Blocks ICT Multi TF indicator is a cutting-edge tool designed to help traders make better trading decisions based on order block analysis. Order blocks are key levels on a price chart where large institutional traders placed their orders. These levels tend to act as strong support or resistance zones and often signal a potential reversal or continuation of a trend. By identifying these order blocks, traders can gain
224 USD
MACD — один из самых популярных индикаторов моментума и тренда. Измеритель силы валюты также является индикатором тренда, основанным на нескольких валютах. Измеритель силы валюты MACD — это индикатор с одним графиком, который имеет алгоритм MACD и измерителя силы валюты. Он также имеет функцию одним щелчком мыши, в которой 28 основных и второстепенных пар отображаются на вашей панели инструментов. При нажатии на определенную пару ваша диаграмма автоматически изменится на диаграмму по вашему выб
299 USD
Algo Trading Indicaor  With this indicator , you’ll have zones and trends that hight probability the price will reverse from it. so will gives you all the help that you need  Why should you join us !?  1-This indicator is logical since it’s working in previous days movement , to predict the future movements. 2-Algo trading indicator will help you to draw trends which is special and are too strong than the basics trend , trends will change with the frame time that you work on . 3-We can
299 USD
Full Forex Market View Dashboard
Opengates Success International
5 (2)
ПОЛНЫЙ ОБЗОР РЫНКА FOREX Индикатор приборной панели Это пользовательский индикатор, созданный, чтобы дать трейдерам полное представление о том, что происходит на рынке. Он использует данные в режиме реального времени для доступа к рынку и отображения каждого бита информации, необходимой для успешной торговли. МОНТАЖ: Прежде чем прикреплять этот индикатор к оконному графику, перейдите на панель «Обзор рынка» вашего MT4 и СКРЫТЬ все валютные пары, которые вам не нужны или которыми вы торг
650 USD
DESCRIPTION The CHAOS INDICATOR has been developed to be used for the TRADING STRATEGY OF CHAOS, as described in the book. The book is in italian language only and can be obtained only on my website indicated below. DATAS COLLECTED AND SHOWN ON GRAPHS The CHAOS INDICATOR apply easily to any graph and any asset, and it is a TRADING FACILITATOR, as it identify immediately the following items on any graph: - The GP (= RIGHT PRICE) i.e. the price to which the asset should be attracted within 24
380 USD
MT5 Version SMT Divergences MT4 SMT Divergences is one of the most innovative indicators in the market. It offers the possibility of analyzing price divergences between 2 pairs. These divergences highlight and help to foresee what banks and institutions are planning to do. SMT divergences also provides you with a kill zones indicator and the possibility of filtering divergences occurring during these kill zones.  The strategy tester is limited in MT4. Contact the author to get your Demo Version
224 USD
Buy And Sell Signal Arrows On The Chart When The Price Is About To Reverse. Also Sends Alerts – On MT4 To Your Phone To Your Email. Does not repaint. Works on any pair, any timeframe.   (Just ajust the settings for your pair and timeframe.) 10 Activations allowed so you are free from limitations MT5 version here .   What is Price Rejection and Reversal and why is it important to you? If price shows certain signs of rejection e.g. a large wick, this often means that it will then r
297 USD
Другие продукты этого автора
EFW Analytics исходит из принципа "Мы торгуем, потому что на финансовом рынке есть закономерности". EFW Analytics - набор инструментов для повышения эффективности торговли путем обнаружения повторяющихся фрактальных геометрических паттернов на финансовом рынке (пятая закономерность). EFW Analytics - один из нескольких инструментов, поддерживающих торговую логику без необходимости тестирования на истории. Инструмент состоит из трех частей: Equilibrium Fractal Wave Index - индекс равновесной фракт
200 USD
Introduction to X3 Chart Pattern Scanner X3 Cherart Pattern Scanner is the non-repainting and non-lagging indicator detecting X3 chart patterns including Harmonic pattern, Elliott Wave pattern, X3 patterns, and Japanese Candlestick patterns. Historical patterns match with signal patterns. Hence, you can readily develop the solid trading strategy in your chart. More importantly, this superb pattern scanner can detect the optimal pattern of its kind. In addition, you can switch on and off individu
250 USD
Поддержка и сопротивление – важные ценовые уровни на внутридневном рынке. Эти уровни обычно тестируются ценой, после чего она продолжает движение, либо приводят к развороту тренда. Для опытных трейдеров точное определение уровней поддержки/сопротивления сложно переоценить. На их основе строятся многие популярные торговые стратегии (например, торговля на пробой/отскок). Precision Support and Resistance предназначен для профессиональных трейдеров. Помимо точного определения уровней поддержки/сопро
60 USD
Уровни Фибоначчи используются в трейдинге уже около 85 лет, с момента создания Волновой теории Эллиотта. До сих пор трейдеры используют анализ Фибоначчи для определения ценовых паттернов. Тем не менее, мы не смогли найти примеров использования анализ Фибоначчи для работы с волатильностью. Индикатор Harmonic Volatility стал первым техническим инструментом, использующим уровни Фибоначчи для анализа волатильности на рынке. Изначально индикатор Harmonic Volatility разрабатывался как способ преодолет
60 USD
Введение в Harmonic Pattern Plus Индикатор Harmonic Pattern Plus, предназначенный для работы в MetaTrader 4, ищет гармонические модели на графике. Программа Harmonic Pattern Plus предназначена для определения точек разворота текущего тренда - она находит гармонические модели с высокой силой прогнозирования. Гармонические модели состоят из нескольких линий, объединенных важными соотношениями Фибоначчи, такими как 0,618 и 0,382, которые часто используются профессиональными трейдерами для измерения
98 USD
Excessive Momentum Indicator – один из немногих индикаторов, измеряющий чрезмерный импульс на финансовом рынке с использованием ценового поведения. Индикатор полностью разработан Янгом Хо Сео (Young Ho Seo). Этот показатель демонстрирует концепцию и практическое применение Равновесной фрактальной волны (Equilibrium Fractal Wave). Чрезмерный импульс на рынке может рассказать о психологии толпы и помочь спрогнозировать направление цены. Таким образом, вы можете основывать свои торговые решения на
200 USD
Introduction to Fractal Pattern Scanner Fractal Indicator refers to the technical indicator that makes use of the fractal geometry found in the financial market. Fractal Pattern Scanner is the advanced Fractal Indicator that brings the latest trading technology after the extensive research and development work in the fractal geometry in the financial market. The most important feature in Fractal Pattern Scanner is the ability to measure the turning point probability as well as the trend probabi
185 USD
Индикатор Elliott Wave Trend был разработан для научного подсчета волн на основе шаблонов и паттернов, впервые разработанных Чжон Хо Сео. Индикатор нацелен на максимальное устранение нечеткости классического подсчета волн Эллиотта с использованием шаблонов и паттернов. Таким образом индикатор Elliott Wave Trend в первую очередь предоставляет шаблон для подсчета волн. Во-вторых, он предлагает структурный подсчет волн Wave Structural Score, которые помогает определить точное формирование волны. Он
200 USD
Рынок Форекс может пройти множество различных ценовых путей к достижению некоей точки в будущем. Будущее динамично. Поэтому, планирование торговли с возможным будущим сценарием является важным шагом для вашего успеха. Для этих целей представляем вашему вниманию Harmonic Pattern Scenario Planner, первый предиктивный инструмент для определения гармонических моделей в своем роде. Основные характеристики Прогнозирование будущих моделей для анализа сценариев 11 Определение гармонических моделей Авт
100 USD
Introduction to Fractal Pattern Scanner Fractal Indicator refers to the technical indicator that makes use of the fractal geometry found in the financial market. Fractal Pattern Scanner is the advanced Fractal Indicator that brings the latest trading technology after the extensive research and development work in the fractal geometry in the financial market. The most important feature in Fractal Pattern Scanner is the ability to measure the turning point probability as well as the trend probabil
185 USD
Концепция спроса и предложения с возвратом к среднему значению Концепция торговли по спросу и предложению полагается на несовпадение объемов покупок и продаж на финансовых рынках. Для обычных трейдеров зоны спроса и предложения служат точками разворота. При рассмотрении первоначальной концепции было обнаружено, что первоначальная торговля по спросу и предложению может выполняться лучше на периоде возврата к среднему значению, а не на периоде тренда. Для демонстрации этой концепции, чтобы какая-л
80 USD
Introduction This indicator detects volume spread patterns for buy and sell opportunity. The patterns include demand and supply patterns. You might use each pattern for trading. However, these patterns are best used to detect the demand zone (=accumulation area) and supply zone (=distribution area). Demand pattern indicates generally potential buying opportunity. Supply pattern indicates generally potential selling opportunity. These are the underlying patterns rather than direct price action. T
FREE
Ace Supply Demand Zone Indicator The concept of supply demand relies on the quantity mismatching between buying and selling volumes in the financial market. Supply and demand zone can provide the good entry and exit. A zone is easier to trade than a line. The supply demand zone can provide the detailed trading plan and the risk management. Its ability to predict market direction is high. There are two distinctive points about Ace Supply Demand Zone Indicator. Ace Supply Demand Zone indicator was
100 USD
Peak Trough Analysis - отличный инструмент для обнаружения пиков и впадин на графике. Peak Trough Analysis может использовать три разных алгоритма обнаружения пиков и впадин. Эти три алгоритма включают в себя оригинальный индикатор Fractals Билла Вильямса, модифицированный индикатор Fractals и индикатор ZigZag. Вы можете использовать этот инструмент анализа пиков и впадин для обнаружения паттернов, составленных Равновесным Фрактально-Волновым процессом. Для дальнейшего использования имеется хоро
FREE
Рынок Форекс может пройти множество различных ценовых путей к достижению некоей точки в будущем. Будущее динамично. Поэтому, планирование торговли с возможным будущим сценарием является важным шагом для вашего успеха. Для этих целей представляем вашему вниманию Harmonic Pattern Scenario Planner, первый предиктивный инструмент для определения гармонических моделей в своем роде. Основные характеристики Прогнозирование будущих моделей для анализа сценариев 11 Определение гармонических моделей Авт
100 USD
Introduction to Fractal Moving Average Fractal Moving Average indicator was designed as part of Fractal Pattern Scanner. Inside Fractal Pattern Scanner, Fractal Moving Average Indicator was implemented as multiple of chart objects. With over thousands of chart object, we find that it was not the best and efficient ways to operate the indicator. It was computationally too heavy for the indicator. Hence, we decide to implement the indicator version of Fractal Moving Average indicator to benefit ou
FREE
Introduction This indicator detects volume spread patterns for buy and sell opportunity. The patterns include demand and supply patterns. You might use each pattern for trading. However, these patterns are best used to detect the demand zone (=accumulation area) and supply zone (=distribution area). Demand pattern indicates generally potential buying opportunity. Supply pattern indicates generally potential selling opportunity. These are the underlying patterns rather than direct price action. T
FREE
Peak Trough Analysis - отличный инструмент для обнаружения пиков и впадин на графике. Peak Trough Analysis может использовать три разных алгоритма обнаружения пиков и впадин. Эти три алгоритма включают в себя оригинальный индикатор Fractals Билла Вильямса, модифицированный индикатор Fractals и индикатор ZigZag. Вы можете использовать этот инструмент анализа пиков и впадин для обнаружения паттернов, составленных Равновесным Фрактально-Волновым процессом. Для дальнейшего использования имеется хоро
FREE
Introduction To Time Box Indicator Time Box Indicator is a must have indicator for any trader. It will display daily, weekly and Monthly box according to your preferences. Yet, you can extend any important price levels in your chart automatically. You can use them as the significant support and resistance levels. It is very simple but effective tool for your trading. Graphic Setting Use White Chart Line Style for Current Open price Daily Setting Update Timeframe for daily box Number of days
FREE
Introduction to X3 Chart Pattern Scanner X3 Cherart Pattern Scanner is the non-repainting and non-lagging indicator detecting X3 chart patterns including Harmonic pattern, Elliott Wave pattern, X3 patterns, and Japanese Candlestick patterns. Historical patterns match with signal patterns. Hence, you can readily develop the solid trading strategy in your chart. More importantly, this superb pattern scanner can detect the optimal pattern of its kind. In addition, you can switch on and off individu
250 USD
Об эксперте Order Risk Management Эксперт ORM разработан специально для быстрого и точного исполнения ордеров. Он предназначен для использования с нашими перечисленными ниже стратегиями Ценового действия и Эконометрической торговли. Эксперт ORM полностью автоматизирован и прост в применении. Эксперт ORM абсолютно бесплатный. Такой способ исполнения ордеров экспертом ORM подходит для любой иной торговой стратегии. Harmonic Pattern Plus MT5 Harmonic Pattern Scenario Planner MT5 Price breakout Patt
FREE
Ace Supply Demand Zone Indicator The concept of supply demand relies on the quantity mismatching between buying and selling volumes in the financial market. Supply and demand zone can provide the good entry and exit. A zone is easier to trade than a line. The supply demand zone can provide the detailed trading plan and the risk management. Its ability to predict market direction is high. There are two distinctive points about Ace Supply Demand Zone Indicator. Ace Supply Demand Zone indicator was
100 USD
Introduction to Fibonacci Volatility Indicator Volatility indicator can help you to detect any statistical advantage for your trading. Especially, if you are trading with Price Action and Price Patterns, then we recommend to use the Volatility indicator together with your strategy. Especically, Fibonacci Volatility indicator combines the market volatiltiy with Fibonacci Analysis to provide you more advanced volatiltiy indicator. Main Features Fibonacci Volatility in Z score Configuration Mode Fi
100 USD
Введение в Harmonic Pattern Plus Индикатор Harmonic Pattern Plus, предназначенный для работы в MetaTrader 5, ищет на графике гармонические модели. Программа Harmonic Pattern Plus предназначена для определения точек разворота текущего тренда - она находит гармонические модели с высокой силой прогнозирования. Гармонические модели состоят из нескольких линий, объединенных важными соотношениями Фибоначчи, такими как 0,618 и 0,382, которые часто используются профессиональными трейдерами для измерения
98 USD
Introduction To Time Box Indicator Time Box Indicator is a must have indicator for any trader. It will display daily, weekly and Monthly box according to your preferences. Yet, you can extend any important price levels in your chart automatically. You can use them as the significant support and resistance levels. It is very simple but effective tool for your trading. Graphic Setting Use White Chart Line Style for Current Open price Daily Setting Update Timeframe for daily box Number of days
FREE
Introduction Auto Chart Alert is a convenient tool to set alert for your trading in your chart. With Auto Chart Alert, you can set the alert line in one click in your desired location in your chart. You can even set alert over the sloped lines in your chart. Auto Chart Alert is a great tool when you have to watch out importnat support and resistance levels for your trading. You can receive the sound alert, email and push notification when the price hit the alert line at you desired location. A
FREE
Excessive Momentum Indicator – один из немногих индикаторов, измеряющий чрезмерный импульс на финансовом рынке с использованием ценового поведения. Индикатор полностью разработан Янгом Хо Сео (Young Ho Seo). Этот показатель демонстрирует концепцию и практическое применение Равновесной фрактальной волны (Equilibrium Fractal Wave). Чрезмерный импульс на рынке может рассказать о психологии толпы и помочь спрогнозировать направление цены. Таким образом, вы можете основывать свои торговые решения на
200 USD
Об эксперте Order Risk Management Эксперт ORM разработан специально для быстрого и точного исполнения ордеров. Он предназначен для использования с нашими перечисленными ниже стратегиями Ценового действия и Эконометрической торговли. Эксперт ORM полностью автоматизирован и прост в применении. Эксперт ORM абсолютно бесплатный. Такой способ исполнения ордеров экспертом ORM подходит для любой иной торговой стратегии. Harmonic Pattern Plus MT4 Harmonic Pattern Scenario Planner MT4 Price breakout Patt
FREE
Introduction Auto Chart Alert is a convenient tool to set alert for your trading in your chart. With Auto Chart Alert, you can set the alert line in one click in your desired location in your chart. You can even set alert over the sloped lines in your chart. Auto Chart Alert is a great tool when you have to watch out importnat support and resistance levels for your trading. You can receive the sound alert, email and push notification when the price hit the alert line at you desired location. A
FREE
Введение Период низкой волатильности и нетрендового движения на финансовом рынке считается периодом бокового рынка (Sideways Market). Рано или поздно волатильность начинает расти и рынок переходит в трендовую фазу. Период бокового рынка (флет) может служить хорошим временем входа в рынок. Кроме того, боковой рынок часто означает накопление на рынке объемных ордеров крупных инвесторов. Информация о господстве на рынке флета может помочь вам определить хорошие моменты для входа в рынок и выхода из
100 USD
Фильтр:
elite luis
3037
elite luis 2023.03.05 15:31 
 

I agreed with Vincent review 100% Amazing Wave and Superimposed patterns! Thanks Author! but need some manual instruction pdf or url on the setting that explain how to use, the previous tutorial link you posted in comment I click but no instruction cannot find anything, I've posted some comment question in comment page, please help answer my questions?

*updated review 10/3/2023 * What I like about this is able to draw trend for different period easily with a click of a button and it also draw trend into the future and price reacted to the line, accurate and amazing!

Young Ho Seo
114993
Ответ разработчика Young Ho Seo 2023.03.06 11:17
Hello. Here is some good educational materials around Superimposed Patterns. Introduction to EFW Index for trading https://algotrading-investment.com/2020/06/04/introduction-to-efw-index-for-trading/ Trading with the Shape ratio of Equilibrium Fractal Wave https://algotrading-investment.com/2020/06/04/trading-with-the-shape-ratio-of-equilibrium-fractal-wave/ Introduction to Equilibrium Fractal Wave (EFW) Channel https://algotrading-investment.com/2020/06/04/introduction-to-equilibrium-fractal-wave-efw-channel/ Practical Trading with Equilibrium Fractal Wave (EFW) Channel https://algotrading-investment.com/2020/06/04/practical-trading-with-equilibrium-fractal-wave-efw-channel/ Superimposed Equilibrium Fractal Waves https://algotrading-investment.com/2020/06/04/superimposed-equilibrium-fractal-waves/
Vincent Paul Colombe
684
Vincent Paul Colombe 2022.01.13 22:34 
 

One of my favourite indicator! Superimposed patterns are killers, and great efficiency in weekly or even monthly timeframe. Heartly recommended ñ

Young Ho Seo
114993
Ответ разработчика Young Ho Seo 2022.07.23 16:38
Yes, you are correct. Superimposed wave patterns are the something really significant when it is used correctly. The Book: Scientific Guide to Price Action and Pattern Trading has all the details about the superimposed pattern.
Petter Rogstad
536
Petter Rogstad 2021.09.24 03:43 
 

This is no doubt my best investment on MQL5. This is like the Ferrari of indicators. Have a learning curve and take some time to understand but after some time you get a very good understanding of what is happening in the market. You understand how pattern and cycles repeat itself and you can benefit from this knowledge and gain competitive advantages.

Ответ на отзыв
Версия 10.8 2022.07.01
In version 10.8, we have made some minor improvement on Equilibrium Fractal Wave Analytics on MetaTrader.
Версия 10.7 2022.03.02
In version 10.7, we made some minor improvement on Equilibrium Fractal Wave Analytics.

When you use this tool alone, we recommend the combined signal from superimposed pattern and EFW channel. You can use EFW Analytics with some of our other products. Here is some example of trading signal you can generate.

Superimposed patterns + EFW channel (Default Reversal trading strategy when you are using EFW Analytics alone)
You can also use EFW Channel for breakout trading too. But please use your own setup for this case.
Superimposed patterns with Triangle Pattern, Falling Wedge Pattern, Rising Wedge Pattern and Channel
EFW channel with Harmonic Pattern Detection Indicator
Superimposed pattern or EFW channel with Supply Demand Indicator
Superimposed pattern or EFW channel with Elliott Wave Indicator
Superimposed pattern or EFW channel with Volume Spread Analysis
Версия 10.6 2018.12.26
In version 10.6, now you can project significant channels into the future. You can do this by either click on Upper button or Lower button. When you click Upper button, you will be projecting significant channel into upper sphere of price range. When you click Lower button, you will be project significant channel into lower sphere of price range. Before setting up your trading, please check the rating and lock the relevant channels for your trading. Welcome to the world of Price Action and Pattern Trading, the scientific way of profiting from market.
Версия 10.5 2018.12.26
In version 10.5, now you can project significant channels into the future. You can do this by either click on Upper button or Lower button. When you click Upper button, you will be projecting significant channel into upper sphere of price range. When you click Lower button, you will be project significant channel into lower sphere of price range. Before setting up your trading, please check the rating and lock the relevant channels for your trading. Welcome to the world of Price Action and Pattern Trading, the scientific way of profiting from market.
Версия 9.9 2018.12.24
In version 9.9, you can check the neighbouring channels near the peak or trough. To check the neighbouring channel, just click the brown circle on the peak or trough.
Версия 9.3 2018.12.23
In version 9.3, we have added Channel rating information for Single EFW Channel. Now you have two types of channel ratings. They are SEC Rating = Superimposed EFW Channel and EC Rating = EFW Channel Rating. We put slightly more weight on SEC Rating because superimposed patterns are considered as more significant than single EFW channel. However, still EC Rating is an important metric to select good channel for your trading. Use SEC and EC rating together to configure your best channel setting for your trading to pick our breakout point and reversal points.
Версия 9.1 2018.10.17
In version 9.1, superimposed channel can be shown in another timeframe too.
Версия 8.7 2018.10.15
In Version 8.7, Superimposed Channel will only show in the current timeframe for correct display. This means that you can not move superimposed channel from current timeframe to other timeframe because it will cause the resolution issues (losing resolution in higher timeframe).
Версия 8.6 2018.10.14
In Version 8.6, Superimposed Channel Rating was added. High Channel Rating = High Prediction Power
Версия 8.3 2018.10.13
In Version 8.3, EFW Analytics can draw Superimposed Channel with expansion. Many new powerful features are added in this version 8.3.
Версия 7.6 2018.09.29
In Version 7.6, We made total change to our Superimposed pattern detection. Overall, the trading strategy is much more similar to the Book: Winning Financial Trading with Equilibrium Fractal Wave: Introduction to Equilibrium Fractal Wave Trading.
However, the trading signal must be triggered using the comfirmation of EFW Channel + Superimposed patterns together unless you are using some other secondary confiramtion techniques.
Версия 5.2 2018.03.01
В версии 5.2 EFW Analytics может автоматически определять наложенные уровни.
Версия 3.1 2018.02.22
В версии 3.1 пользователи могут выбрать кратное значение коэффициента формы для торговли.