• 概要
  • レビュー (3)
  • コメント (17)
  • 最新情報

Equilibrium Fractal Wave Analytics MT4

5

Introduction to EFW Analytics

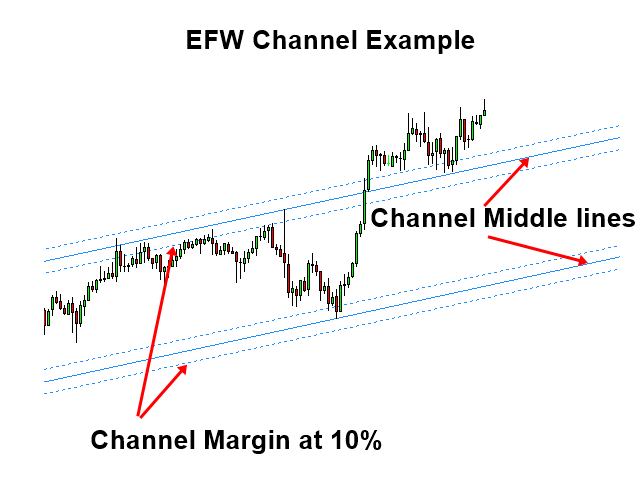
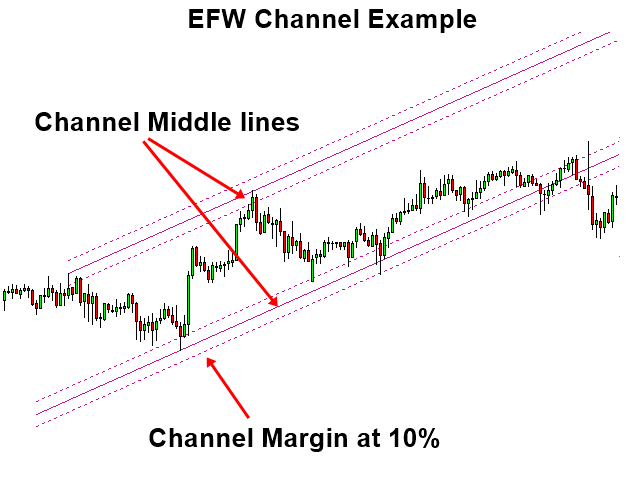
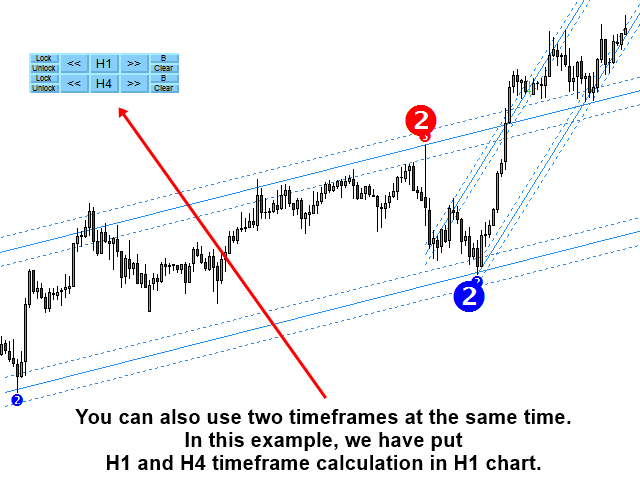
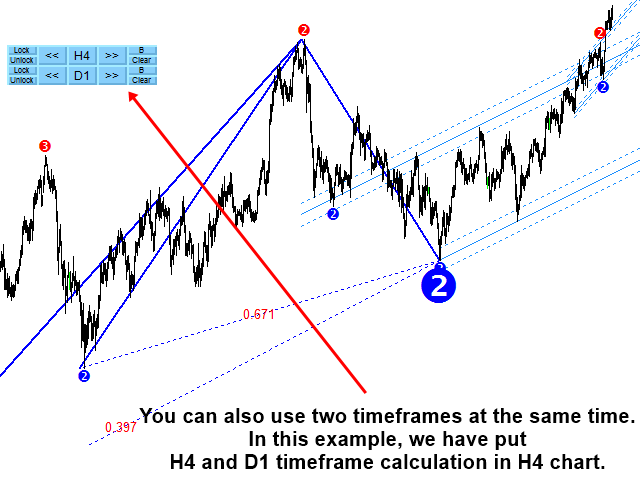
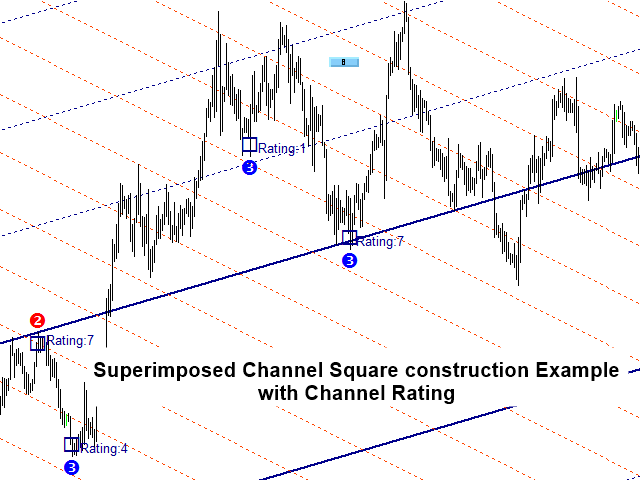
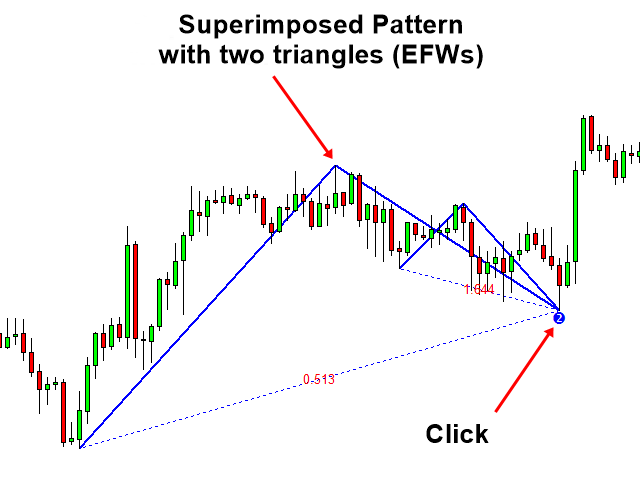
EFW Analytics was designed to accomplish the statement "We trade because there are regularities in the financial market". EFW Analytics is a set of tools designed to maximize your trading performance by capturing the repeating fractal geometry, known as the fifth regularity in the financial market. The functionality of EFW Analytics consists of three parts. Firstly, Equilibrium Fractal Wave Index is an exploratory tool to support your trading logic to choose which ratio to trade. Secondly, EFW Analytics can detect the Superimposed Patterns in your chart. Thirdly, it can detect Equilibrium Fractal Wave (EFW) Channel patterns. EFW Analytics provide the graphic rich and fully visual trading decision support. In default trading strategy, you will be looking at the combined signal from Superimpsoed pattern + EFW Channel. In addition, you can perform many more trading straetgies in a reversal and breakout mode. You can also run two different timeframes in one chart to enforce your trading decision. Sound alert, email and push notifiaction are built inside the indicator.

Equilibrium Fractal Wave Index

Equilibrium Fractal Wave index is an exploratory analysis tool for your trading. How to use the EFW index is similar to Hurst Exponent by Harold Edwin Hurst (1880-1978) or Fractal Dimension coined by Mandelbrot in 1975. Literarily, EFW index can help you to confirm the presence of equilibrium fractal waves in the financial market. However, Equilibrium fractal wave index is more practical and intuitive comparing to Hurst Exponent and Fractal Dimension for your trading. The value of equilibrium fractal wave index can range from 0.0 to over 1.0. The higher the equilibrium fractal wave index, you can confirm the stronger presence of a particular shape ratio of equilibrium fractal wave. Hence this ratio will be your choice of trading. If you stronly believe on fibonacci ratios like 0.618, 0.382, etc, then you may skip this part because default ratio setting uses 0.382, 0.500 and 0.618. However, you will find that some fibonacci ratios are not significant for some currency pairs.

Superimposed Patterns

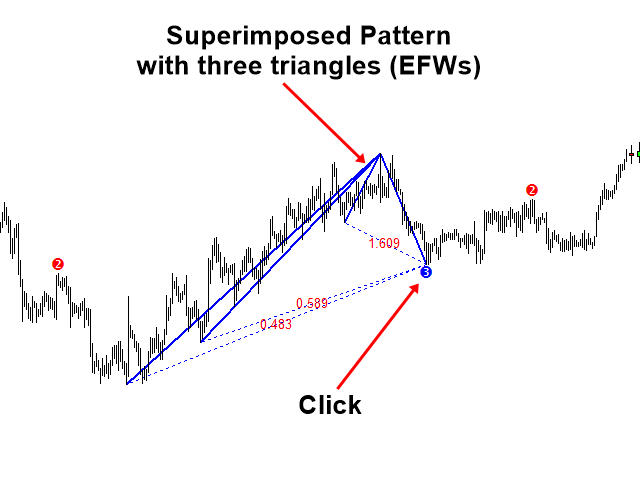
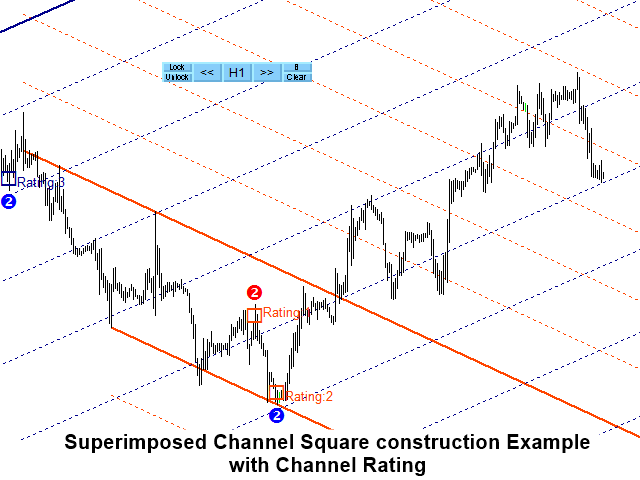
Superimposed patterns are the several triangles overlapping in the same place in your chart. Superimposed pattern can provide the good trading entries when it is used together with EFW channel.

How to Trade

When you use this tool alone, we recommend the combined signal from superimposed pattern and EFW channel. You can use EFW Analytics with some of our other products. Here is some example of trading signal you can generate.

  • Superimposed patterns + EFW channel (Default Reversal trading strategy when you are using EFW Analytics alone)
  • You can also use EFW Channel for breakout trading too. But please use your own setup for this case.
  • Superimposed patterns with Triangle Pattern, Falling Wedge Pattern, Rising Wedge Pattern and Channel
  • EFW channel with Harmonic Pattern Detection Indicator
  • Superimposed pattern or EFW channel with Supply Demand Indicator
  • Superimposed pattern or EFW channel with Elliott Wave Indicator
  • Superimposed pattern or EFW channel with Volume Spread Analysis

Controllable Inputs

  • Common User setting: common input setting for EFW Analytics
  • EFW Index setting: this input controls everything related to EFW index
  • EFW Channel setting: this input controls everything related to EFW Channel
  • Superimposed pattern setting: this input controls everything related Superimposed patterns
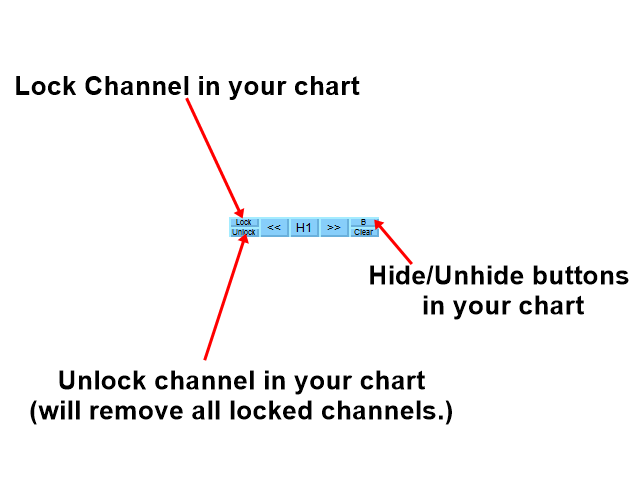
  • Button display settings: this input controls how the buttons shows in your chart

Trading Strategy Guide

You can find the detailed trading strategy guide about how to use Superimposed Pattern within EFW Analytics MetaTrader Indicator from the link below. We highly recommend to read this article before using the Superimposed Pattern for your trading.

https://www.mql5.com/en/blogs/post/750385

Important Note

This is the off the shelf product. Therefore, we do not accept any modification or customization request on this product. In addition, we do not provide any code library or any support for your coding for this product.

レビュー 3
elite luis
3037
elite luis 2023.03.05 15:31 
 

I agreed with Vincent review 100% Amazing Wave and Superimposed patterns! Thanks Author! but need some manual instruction pdf or url on the setting that explain how to use, the previous tutorial link you posted in comment I click but no instruction cannot find anything, I've posted some comment question in comment page, please help answer my questions?

*updated review 10/3/2023 * What I like about this is able to draw trend for different period easily with a click of a button and it also draw trend into the future and price reacted to the line, accurate and amazing!

Vincent Paul Colombe
684
Vincent Paul Colombe 2022.01.13 22:34 
 

One of my favourite indicator! Superimposed patterns are killers, and great efficiency in weekly or even monthly timeframe. Heartly recommended ñ

Petter Rogstad
537
Petter Rogstad 2021.09.24 03:43 
 

This is no doubt my best investment on MQL5. This is like the Ferrari of indicators. Have a learning curve and take some time to understand but after some time you get a very good understanding of what is happening in the market. You understand how pattern and cycles repeat itself and you can benefit from this knowledge and gain competitive advantages.

おすすめのプロダクト
Displays the shortest possible waves for intraday trading or scalping Revolutionary novelty Fox wave provides an indicator that draws wave values ​​on all 28 pairs plus xauusd. EURUSD,USDCAD,EURAUD,GBPJPY,NZDJPY,GBPNZD,CADCHF,USDJPY,NZDUSD,EURCAD,AUDJPY,GBPAUD,AUDCAD,NZDCAD,GBPUSD,EURJPY, EURCHF,CADJPY,GBPCAD,AUDCHF,NZDCHF,AUDUSD,EURGBP,EURNZD,CHFJPY,GBPCHF,AUDNZD,USDCHF,USDJPY You have a constant overview of the state of the market Bonus : Day, Week, Month and Annual ranges and fibos
889 USD
Trend Scanner
Vladimir Kalendzhyan
4.43 (7)
By purchasing this indicator, you have the right to receive a free copy of one of   my other indicator's or advisor’s!  (All future updates are included. No limits) . To get it , please contact me by  mql5 message ! The Trend Scanner trend line indicator displays the trend direction and its changes. The indicator works on all currency pairs and  timeframes. The indicator simultaneously displays multiple readings on the price chart: the support and resistance lines of the currency pair, the exist
50 USD
BinaryByte Indicator
Mohammad Iskandar Bin Rabudin
Introducing the BinaryByte Indicator: Unleash the Synergy of Powerful Technical Analysis Tools! Are you searching for an innovative and powerful indicator to elevate your trading performance? Look no further! The BinaryByte Indicator is here to provide you with the edge you need to succeed in the Forex market. Key Features: Experience the perfect blend of advanced technical analysis tools, combining Moving Averages, RSI, Bollinger Bands, and Candlestick patterns. Maximize your trading potential
50 USD
Introduction to X3 Chart Pattern Scanner X3 Cherart Pattern Scanner is the non-repainting and non-lagging indicator detecting X3 chart patterns including Harmonic pattern, Elliott Wave pattern, X3 patterns, and Japanese Candlestick patterns. Historical patterns match with signal patterns. Hence, you can readily develop the solid trading strategy in your chart. More importantly, this superb pattern scanner can detect the optimal pattern of its kind. In addition, you can switch on and off individu
250 USD
The perfect tool for Scalng in the Forex markets You can trade both from signal to signal and using take profit  The algorithm does not use Zigzag!  No redrawing!  This is a channel instrument that uses a moving average as a filter. Moving Average  There are 2 parameters for the settings Ma Period = 5 period Moving Average  Channel 1.0 distance of channel lines from the chart Price Signal Filter - calculation of signal opening and filter There is a complete set of Alert There is a multi-timefram
400 USD
Trend Line Chart Pattern Signals  Is a traders Tool for Signals based on Strong  Patterns Formed By a pair of robust trend lines. They FOR WITH DIFFERENT POPULAR PATTERNS ON CHARTS LIKE – TRIANGLES, FLAGS,RANGE , ASCENDING TRIANGLES, DESCENDING PATTERNS, PENNANTS ETC. The TREND LINES  form  dynamically  on running bars. The  sensitivity  of the trend lines can be changed by custom settings. The  Buy and Sell Signals Generate upon Break Of the Trend Line + "Close" of the same bar above the previo
80 USD
Note: The price is subject to increase at any time from now!  Hi Traders, I would like to introduce to you my new indicator called the Infinity Oscillator Indicator. This indicator is designed for both newbies and professional traders. Parameters The inputs that can be changed by the user are colors of the lines only so as to not disturb the original trading strategy this indicator uses. The indicator will not provide buy and sell arrow signals but will help traders in market analysis approach
250 USD
Divergence Formation Hurst (hereinafter "Diver") is based on Hurst exponent used as a measurement of long term memory of time series. Classic (regular) and Reversal (hidden) Divergences - at your choice. Adjustable sizes and all parameters Flexible settings including VOID levels (alert function in place, arrows to show in which direction to trade) No re-paint / No re-draw (must set CalcOnOpenBar =false) "SetIndexBuffer" available for all variables (can be used in EA) Auto-detect 4- and 5-digit p
250 USD
There are 8 types of this indicator. Consisted of 1. Bullish and Bearish Engulfing 2. Morning and Evening Star 3. Three Green Soldiers and Three Red Crows 4. Three Inside Up and Down 5. Three Outside Up and Down 6. Bullish and Bearish Harami 7. Tweezers Top and Bottom 8. Piercing and Dark cloud cover Signal Filter :: 1. The appearance of the candle stick 2. SMA 3. 2EMA :: EMA Fast and EMA Slow 4. RSI N otification :: 1. Via screen 2. Email 2. Phone For trading 1. Scaling 2. Binary options
299 USD
GTAS FibTdi
Riviera Systems
3.2 (5)
GTAS FidTdi is a trend indicator using combination of volatility and potential retracement levels. This indicator was created by Bernard Prats Desclaux, proprietary trader and ex-hedge fund manager, founder of E-Winvest. Description The indicator is represented as a red or green envelope above or under prices. How to use Trend detecting When the envelope is green, the trend is bullish. When it is red, the trend is bearish. Trading Once a trade is opened, GTAS FibTdi shows retracement zones
FREE
0 of 10 for 79$ Next Price is 89$ Angle Zigzag Support Resistance is a indicator for mark the horizontal line at support and resistance Settings Zigzag Settings ZZDepth - by Default is 12. ZZDeviation - by Default is 5. ZZBackStep - by Default is 3. Max Bar Calculate  - How many bar to calculate max is 1000 by default is 500. Horizontal Line Settings SupportColor-  color for Support line.  ResistanceColor  -  color for Resistance line. LineWidth LineStyle
33 USD
The London Breakout indicator is a technical analysis tool used in the forex market to help traders identify potential breakouts during the opening of the London trading session. This indicator is designed to help traders take advantage of the volatility and momentum that occurs during this time period, which can lead to significant price movements. The London Breakout indicator works by identifying the range of price movement during the Asian trading session that precedes the London open, an
90 USD
This indicator monitors the market for a flat state and possible breakout. The flat state is detected as a predefined number of consecutive bars during which price fluctuates inside a small range. If one of the next bars closes outside the range, breakout is signaled. The indicator shows 3 lines: blue - upper bound of flat ranges AND consecutive breakout areas; red - lower bound of flat ranges AND consecutive breakout areas; yellow - center of flat ranges (NOT including breakout areas). When a b
30 USD
"The trend is your friend" is one of the best known sayings in investing, because capturing large trendy price movements can be extremely profitable. However, trading with the trend is often easier said than done, because many indicators are based on price reversals not trends. These aren't very effective at identifying trendy periods, or predicting whether trends will continue. We developed the Trendiness Index to help address this problem by indicating the strength and direction of price trend
49 USD
スイングトレーディング は、トレンドの方向のスイングと可能な反転スイングを検出するように設計された最初のインジケーターです。トレーディングの文献で広く説明されているベースラインスイングトレーディングアプローチを使用します。インディケータは、いくつかの価格と時間のベクトルを調査して、全体的なトレンドの方向を追跡し、市場が売られ過ぎまたは買われ過ぎて修正の準備ができている状況を検出します。 [ インストールガイド | 更新ガイド | トラブルシューティング | よくある質問 | すべての製品 ] むち打ちを起こさずに市場スイングの利益 インジケーターは常にトレンドの方向を表示します 色付きの価格帯は機会のベースラインを表します 色付きのダッシュは、可能な反転スイングを表します この指標は、独自の品質とパフォーマンスを分析します 複数時間枠のダッシュボードを実装します カスタマイズ可能なトレンドおよびスイング期間 電子メール/サウンド/プッシュアラートを実装します インジケータは再描画またはバックペインティングではありません Swing Tradingとは Swing Tradi
175 USD
ACB Breakout Arrows
KEENBASE SOFTWARE SOLUTIONS
4.17 (35)
The ACB Breakout Arrows indicator provides a crucial entry signal in the market by detecting a special breakout pattern. The indicator constantly scans the chart for a settling momentum in one direction and provide the accurate entry signal right before the major move.  Get multi-symbol and multi-timeframe scanner from here - Scanner for ACB Breakout Arrows MT4 Key features Stoploss and Take Profit levels are provided by the indicator. Comes with a MTF Scanner dashboard which tracks the brea
145 USD
It is an oscillator with a filter by levels of support and maintenance this tool is designed for binary options it is very easy to use Has very good indicators of correct transactions 80-90% (this is the basis for the cost) Signals Red arrow directed downward signal to decrease Arrow of blue color directed upwards signal for an increase Recommended operating time: 1-2 candles Any: timeframe Trade Symbol: Any Session: Any It is not recommended to trade during the news release, the percentage of c
1 338 USD
UniversalIndicator is a universal indicator. A great helper for beginners and professional traders. The indicator algorithm uses probabilistic and statistical methods for analyzing the price of a trading instrument. The indicator is set in the usual way. Advantages of the indicator works on any time period works with any trading tool has a high probability of a positive forecast does not redraw Indicator Parameters LengthForecast = 30 - the number of predicted bars
400 USD
This is a trend indicator without redrawing Developed instead of the binary options strategy (by the color of the Martingale candlestick) Also works well in forex trading When to open trades (binary options) A signal will appear in the place with a candle signaling the current candle It is recommended to open a deal for one candle of the current timeframe M1 and M5 When a blue dot appears, open a deal up When a red dot appears, open a trade down. How to open trades on Forex. When a signal is rec
1 000 USD
This indicator shows price changes for the same days in past years. D1 timeframe is required. This is a predictor indicator that finds D1 bars for the same days in past 8 years and shows their relative price changes on the current chart. Parameters: LookForward - number of days (bars) to show "future" price changes; default is 5; Offset - number of days (bars) to shift back in history; default is 0; ShowAverage - mode switch; true - show mean value for all 8 years and deviation bounds; false - s
FREE
Price Breakout pattern Scanner is the automatic scanner for traders and investors. It can detect following patterns automatically from your chart. Head and Shoulder - Common tradable pattern. Reverse Head and Shoulder - This pattern is the reverse formation of the Head and Shoulder. Double Top - When the price hits resistance level twice and decline toward the support level, the trader can anticipate sudden bearish breakout through the support level. Double Bottom - The double bottom pattern is
100 USD
MetaTrend M4
Vahidreza Heidar Gholami
5 (1)
Meta Trend Indicator is an efficient way to forecast and detect the trend in any market. It reveals the trend, support and resistance levels, volatility and the maximum potential target, all in one indicator. To adapt to the price and to decrease consecutive trend failures, the internal trend detector algorithm studies the market and dynamically chooses the right values for the internal parameters. This indicator is a perfect trend filter for any strategy or expert advisor. Features Super Adapti
99 USD
It will be the best tool for you to make a profit! Through unique algorithms You're going to see an amazing amount of right trading signals Make huge profits every day and realize more possibilities!   Like the car no money to buy it, the love of the girls dare not to pursue?Or the credit card bill is not paid, the rent does not have the extra money to settle?Or are you fed up with being bossed around by your boss and Hope to get more people's respect?Can't afford to buy the things you want ? wa
149 USD
FX Flow   indicator can be used as an anticipator of the next trend, preferably confirmed by Price Action or another oscillator (RSi, Stochastic ..). It takes the money flows of the major currencies USD EUR GBP AUD NZD CAD CHF JPY into account, and processes them. Excellent tool for indices, but also for correlations between currencies. Works on each timeframes.  Blue line: Bull market Yellow line: Bear market Note : if the indicator opens the window, but does not draw lines, load the histo
299 USD
Chart Patterns Detect 15 patterns (Ascending Triangle, Descending Triangle, Rising Wedge, Falling Wedge, Bullish Flag, Bearish Flag, Bullish Rectangle, Bearish Rectangle Symmetrical triangle, Head and Shoulders, Inverted Head and Shoulders, Triple top, Triple Bottom, Double Top, Double Bottom) Use historical data to calculate the probability of each pattern to succeed (possibility to filter notification according to the chance of success) gives graphic indication about the invalidation level and
58 USD
これは、価格ラベル付きのAdvanced ZigZagDynamic および/または ExtendedFractals インジケーターの極値に基づくサポートおよびレジスタンスレベルのMTFインジケーターです(無効にすることができます)。 MTFモードでは、より高いTFを選択できます。デフォルトでは、レベルはZigZagインジケータードットに基づいて生成されます。フラクタルインジケータードットは、ZigZagと一緒に、またはその代わりに使用することもできます。使用を簡素化し、CPU時間を節約するために、計算はバーの開口部ごとに1回実行されます。 パラメーター: ForcedTF-レベル計算のチャート時間枠(現在の時間枠と等しいか、それを超える場合があります) MinPipsLevelWidth-ポイント単位の最小レベル幅(非常にタイトなレベルに使用) Use ZigZag Extremums points -ZigZagピークを使用してサポート/抵抗レベルを計算することを有効/無効にします Fixed pips range -ジグザグインジケーターを計算するための最小値と最大値の間の距離
30 USD
BPS Panel Breakout Pro Scalper Solution Panel This indicator is part of the   RPTrade Pro Solutions  systems. BPS Panel   is a daily trend indicator using Price Action, Dynamic Support and Resistances. It's designed to be used by anyone, even the absolute beginner in trading can use it. NEVER repaints . Indications are given   from close to close . Designed to   be used alone , no other indicators are required. Gives you the trend and potential Take Profit at the beginning of the day. How
1 300 USD
Intraday Levels shows intraday levels grid for intraday trading Shows a grid for the day levels, gives you a guide to know the trend and to measure intraday trades (stop-loss and take-profit). Parameters are: Levels Mode: Basic mode: Shows highest, lowest and middle levels. Advanced mode: Shows highest, lowest, middle and intermediate levels. Fibonacci mode: Shows session Fibonacci retracements levels. Momentum mode: Shows delayed Advanced levels to identify momentum. Smooth Period (Momentum
60 USD
AI Forecast MT4
Leonardo Antonio Camacaro Armas
Discover our extraordinary AI-powered Metatrader 4 indicator, designed to provide you with accurate forecasts on the price reaction of a financial asset based on a specific level! Our product guides you through three simple steps to obtain reliable results and make informed decisions: ️ Step 1: The user selects the entry level and the two possible outcomes (Take Profit and Stop Loss) and clicks on calculate. In an instant, the full potential of the indicator is unleashed. ️ Step 2: The in
100 USD
The CCI Divergence is a reasonably useful indicator in itself, but it is even more effective when used with divergence pattern trading. The CCI Divergence indicator signal is one of the most potent signals among the indicators that exist in the market. Here is new version for Divergence Indicator using CCI method, with more improvements. Divergences indicate a potential investment point because the directional moment does not confirm the price. A bullish divergence occurs when the underlying
49 USD
このプロダクトを購入した人は以下も購入しています
Ultimate Sniper Dashboard
Hispraise Chinedum Abraham
4.65 (23)
299ドルで割引中! 今後値上げの可能性あり! 下の説明を読んでください! 究極のスナイパーダッシュボードのための最高のエントリーシステム。究極のダイナミックレベル。(私の製品をチェックしてください) 究極のスナイパーダッシュボードはMT4多通貨テスト制限のため、ライブマーケットでのみ作動します。 究極のスナイパーダッシュボードをご紹介します。HA-Sniper、MA-Sniper、その他多くの特別なモードが含まれる最高の製品です。究極のスナイパーダッシュボードは絶対的な獣です! 初心者やエキスパートトレーダーにとって最高のソリューションです。もう二度と動きを見逃さない! シンプルさとピップを愛するトレーダーのために、特別な製品をご用意しました。シンプルでありながら、ダッシュボードは複数のカスタムアルゴリズムに基づき28の通貨ペアを監視し、すべての作業を行います。たった一つのチャートで、プロのように市場を読み解くことができます。もし、為替ペアが動き出したときに、その方向性を正確に特定することができれば、あなたの取引はどれほど改善されることでしょう。   当社のシ
299 USD
A. A2SR とは何ですか ?   * 先行テクニカル指標です (塗り直しなし、ラグなし)。 -- ガイダンス : -- https://www.mql5.com/en/blogs/post/734748/page4#comment_16532516 -- そして https://www.mql5.com/en/users/yohana/blog A2SR には、サポート (需要) とレジスタンス (供給) のレベルを決定する特別な手法があります。 ネットで見かける通常の方法とは異なり、A2SR は実際の SR レベルを決定する独自のコンセプトを持っています。 元の手法はインターネットから取得されたものではなく、インターネット上で公開されたこともありません。 A2SR は、取引スタイルに応じて SR レベルを自動選択します。 時間枠を変更しても、SR レベルはその位置にとどまります。 実際のSRは、使用する時間枠から取得されるわけではないため. A2SR には、取引のための完全な手段があります 。 実際のサポート (需要) とレジスタンス (供給) の真のコンセプト。
386 USD
これはほぼ間違いなく、MetaTraderプラットフォームで見つけることができる最も完全な調和価格形成自動認識インジケーターです。 19種類のパターンを検出し、フィボナッチプロジェクションをあなたと同じように真剣に受け止め、潜在的逆転ゾーン(PRZ)を表示し、適切なストップロスとテイクプロフィットレベルを見つけます。 [ インストールガイド | 更新ガイド | トラブルシューティング | よくある質問 | すべての製品 ] 19の異なる調和価格形成を検出します プライマリ、派生および補完フィボナッチ投影(PRZ)をプロットします 過去の価格行動を評価し、過去のすべてのパターンを表示します この指標は、独自の品質とパフォーマンスを分析します 適切なストップロスとテイクプロフィットのレベルを表示します ブレイクアウトを使用して適切な取引を通知します すべてのパターン比をグラフにプロットします 電子メール/音声/視覚アラートを実装します スコット・M・カーニーの本に着想を得て、この指標は最も純粋で急を要するトレーダーのニーズを満たすように設計されています。ただし、トレードを
249 USD
Please send me Direct message on MQL5 CHAT after purchasing the Indicator for Training and Installation Support There are some additional files that is important to use with the Indicator . So be sure to contact me after purchasing the Indicator So that I can add you for training and support . If you find any difficulty with installation then send me Direct message here So that I can connect with you via Anydesk or Teamview for the product installation. " Smart Order Block Indicator " to find
249 USD
Moonwalker
Cengiz Erkoyuncu
5 (6)
ムーンウォーカーMT4インジケーターは、レンコチャート上のトレンドトレーディング戦略を革命的に変えることができる強力なツールです。高度なアルゴリズムにより、市場のトレンドを追跡し、急激な変動や市場騒音をフィルタリングすることで、信頼性が抜群に高くなっています。これにより、市場を常に監視することなく、簡単かつ自信を持ってトレードできます。 他のインジケーターとは異なり、ムーンウォーカーは、過去の市場状況を正確に反映し、シグナルを逆行させることはないため、後戻りすることはありません。さらに、サウンドアラートやプッシュ通知も付属しているため、取引機会を見逃すことはありません。 取引を次のレベルに引き上げたい場合、ムーンウォーカーインジケーターとシームレスに連携するWhoopeeEAは、優れたオプションです。ご希望の場合は、WhoopeeEAを共有できます。 私たちの言葉だけでなく、説明ビデオをご覧いただき、ムーンウォーカーを実際に動かして、今日からトレンドトレーディング革命に参加してください!
250 USD
Blitz Scalperは、主要な通貨ペアと共に動作するように最適化された複数のタイムフレームで動作する、価格アクションベースのスキャルピングインジケーターです。 Blitz Scalperインジケーターは、価格アクション、サポート・レジスタンス、トレンド分析などの強力なトレード戦略の組み合わせに基づいています。これらの要因を分析することで、高確率のトレード機会を特定し、正確な買い・売りシグナルを提供することができます。 Blitzインジケーターの主要な特徴の1つは、使いやすいインターフェースです。トレーダーは、チャート上の買い・売りシグナル、トレンドの方向、シグナルの強度をすばやく簡単に確認することができます。 Blitz Scalperの主な特徴のいくつかには、トレーダーが自分のトレードスタイルや好みに合わせてインジケーターを調整できるカスタマイズ可能な設定が含まれています。 Blitz Scalperは100%ノンリペイントです。 Forex市場で利益を上げるためのシンプルでパワフルなスキャルピングインジケーターを探している場合は、Blitzが最適なツールです。今すぐお試しく
250 USD
THEQ Volumen
Luis Alberto Vazquez Carpio
5 (1)
THEQ Volumeは、正確なボリュームオシレーターを表示します。次のトレンドまたは起こりうるトレンド変化を取引するために使用できます。 THEQ Volumeには、THEQ Volume Arrows、シグナルとアラートを備えたインジケーター、および実際の/デモ、バックテストと最適化、または独自の戦略を作成するためのTHEQ VolumeEAも含まれています。 追加のインジケーターとロボットEAは、支払い後に別々に出荷されます。 THEQボリュームは再描画せず、ラグがなく、キャンドルが閉じても信号が消えることはありません。 また、準備が整い、市場に迅速に参入するための事前シグナルもあります。 マニュアルと最適な設定インジケーターとEAを使用して、必要なときにいつでもサポートとヘルプを利用できます。新しいバージョンは常に最初の支払いに含まれています。 チップ: -EURUSDペアとM5TFの過去5年間を最も正確な方法(ティック)でバックテストして、購入したものがスクリーンショットやビデオと同じであることを確認します。 -EAが履歴データを読み取らないことを確認します。 -デモアカウン
495 USD
Robot Choppiness
Diego Mauricio Padilla Mendez
5 (1)
Choppines ロボットは MT4 インジケーター フォルダーにインジケーターとしてロードされます 5 分のローソク足時間枠を使用することをお勧めします。推奨されるロボットの有効期限は 5 分です。 ロボットは、MT2、MX2、PRICEPRO プラットフォームに信号を送信するように構成できます。信号を送信するには、使用するプラットフォームのコネクタ プログラムを使用する必要があります。 コネクタに取り付けるには、次の手順を実行します (MT2 プラットフォーム コネクタの構成を説明する画像が添付されています)。 1.- MT4 プラットフォームに任意の通貨ペアをロードします 2.- セイルを M5 のタイミングで配置します。 3.- ファイル Robot-Choppiness.ex4 をロードするか、画面上で開いている通貨ペアにドラッグします。 4.- MT2 コネクタ (MX2、または PRICEPRO、一度に 1 つずつ) を画面にロードし、ファイル名、シグナル名、買いバッファ (2)、売りバッファ (3)​​ を設定し、ロボットの有効期限 =
599 USD
www.tradeightrading.com The tool identifies the real movement that the forex market uses, with real mathematical calculations based on the price changes. Tradeight execution is based on this mathematical relationship that be always existed. Most traders look at the same things on charts and study the same information.. the reason because the majority lose money. It is a tool based not on the ideas of the majority but on the real foundations that rule the forex market. The tool is a visual tool,
2 300 USD
The Nihilist 5.0 Indicator includes Forexalien and Nihilist Easy Trend trading strategies and systems. It is composed of an MTF Dashboard where you can analyze the different input possibilities of each strategy at a glance. It has an alert system with different types of configurable filters. You can also configure which TF you want to be notified on your Metatrader 4 platform and Mobile application The indicator has the option to view how could be a TP and SL by using ATR or fixed points, even
299 USD
Buy and Sell Arrows when price is about to retrace. It Also Sends Alerts – On MT4 To Your Phone To Your Email Does not repaint. Works ony any pair, any timeframe. 10 Activations allowed so you are free from limitations See an example of alerts from today (23 May 2020) using this and 2 more of my indicators  here . MT5 Version here . What is a Retracement and why is it important to you? As you know, the market goes through phases of trend and retracement. Price can only move so fa
297 USD
The CLOCK INDICATOR indicator is suitable for trading binary options as it relies on price action and gives a signal to enter the deal at the end of the candle that confirms the occurrence of the action to enter the deal in the next candle . You need a little technical analysis behind the indicator. so you can use the indicator and you can use it in one pair or more than one pair.
450 USD
[ MT5 Version ] Order Block Indicator MT4 Order Block Indicator MT4  is currently the most accurate and customizable indicator in the market. It has been developed to facilitate the analysis of operations based on Order Blocks and Supply and Demand Zones. These zones are possible reversal points of a movement. Order Blocks indicate a possible accumulation of orders in one area. The price usually gets to reach and react strongly to those areas. The most relevant levels for this reaction are the c
224 USD
Buy and sell arrows on the chart when the trend is about to continue. Aslo Sends Alerts – On MT4 To Your Phone To Your Email. Does not repaint. Works on any pair, any timeframe.   (Just ajust the settings for your pair and timeframe.) 10 Activations allowed so you are free from limitations See an example of alerts from today (23 May 2020) using this and 2 other indicators  here . MT5 version here . The indicator provides accurate buy and sell arrows on the chart when the trend is
297 USD
これはMT4プラットフォームの天文学のインジケータで、様々な機能を実行します。複雑なアルゴリズムを使用して独自の計算を行い、非常に正確な結果を得ることができます。 インジケータには、惑星の地球/太陽中心の座標、太陽/地球の距離、星等、離角、星座、黄道座標、赤道座標、水平座標などの天文学的情報を提供するパネルがあり、時間値に依存する垂直線によって生成されるものに応じています。 インジケータはチャート上に惑星線を描画することができ、スケールや基本角度を制御することができます。また、各惑星線の表示を制御することもできます。 インジケータは、合、六分相、四分相、三分相、対、逆行などの惑星間の関係を描画することができます。また、選択した関係に対してカスタムの時間範囲をスキャンすることもできます。 インジケータはまた、チャート上に新月や満月を描画することができます。 Square of Nineパネルを持っており、天文学の分析に使用することができます。さらに、惑星度数の時間機能を持ち、角度入力を制御することができます。 オービット機能により、選択した設定に応じて日次または現在のチャートに関連する軌
600 USD
INTRODUCING WORLD'S FIRST MT4 & MT5  Gann Dynamic Square, Circle and Equilateral Triangle  To Analyze Market Geometric Relationship. Gann Dynamic Square  has some of the most impressive features you will ever find in Gann & Geometric Analysis world. The Gann Dynamic Square is a tool to draw offset Square,Equilateral Triangle & Circle.Most charting software or MT4/MT5 market indicators don't have these features. You will be able draw your Geometric shapes like a professional geometric analys
399 USD
Buy and Sell Arrows On The Chart According To Price Action Sends Alerts On MT4 To Your Phone To You Email Does NOT repaint. Works on any pair, any timeframe.     10 Activations allowed so you are free from limitations. MT5 Version here . When you get a signal, all you need to do is check the previous structue highs and lows to use as your stop loss and take profit. See the video below. Settings: Apart from the times you want to get signals and where you want alerts, there is only o
297 USD
FFXMV Dashboard Plus
Opengates Success International
FFXMV Dashboard Plus This is a custom indicator created to give Traders a full view of what is going on in the market. It uses a real time data to access the market and display every bit of information needed to make successful trading. The PLUS there to produce the kind of RESULTS as you see in the SCREENSHOTS, I added a MultipleOrder Utility EA with it with instructions on how to use it with FFXMV Dashboard. INSTALLATION : Read the MANUALS that comes with the rest of the PACKAGE after yo
850 USD
VTrende Pro MT4 - MTF indicator for trend trading with a display panel for MT5 *** Videos can be translated into any language using subtitles (video language - Russian) Although the signals of the VTrende Pro indicator can be used as signals of a full-fledged trading system, it is recommended to use them in conjunction with the Bill Williams TS. VTrende Pro  MT4 is an extended version of the VTrende indicator. Difference between Pro version and VTrende: - Time zones - Signal V - signal 1-
697 USD
ついに、ノンリペイントプライスアクショントレーディングツールが正式リリースされました。 [V1.60] MTF の正確なプライスアクションの矢印がフィルタリングされました。 MTF Precise Price Action Arrow インジケーターは、市場の方向性を強化するために複数のインジケーターを組み合わせて使用します。 価格変動を読み、その強さを測定することは主観的な問題であり、習得するには何年もかかるテクニックです。 このインジケーターの目的は、価格変動の方向性をできるだけ客観的に読み取ることです。 哲学: 1 つの取引指標だけを使用することはあまり説得力がありません。 そのため、いくつかの指標を組み合わせて市場の方向性に関する分析を強化しています。 価格アクションの動きは、次の 6 つのインジケーターのいずれかを使用してフィルタリングできます。 RSIMA デュアル MACD (新バージョン 1.3!) デュアル ストキャスティクス (新バージョン 1.3!) CCI 4 移動平均 (新バージョン 1.6! 2 移動平均だけではありません) ダ
1 099 USD
MT5 Version   Kill Zones   SMT Divergences Order Blocks ICT Multi TF The Order Blocks ICT Multi TF indicator is a cutting-edge tool designed to help traders make better trading decisions based on order block analysis. Order blocks are key levels on a price chart where large institutional traders placed their orders. These levels tend to act as strong support or resistance zones and often signal a potential reversal or continuation of a trend. By identifying these order blocks, traders can gain
224 USD
Algo Trading Indicaor  With this indicator , you’ll have zones and trends that hight probability the price will reverse from it. so will gives you all the help that you need  Why should you join us !?  1-This indicator is logical since it’s working in previous days movement , to predict the future movements. 2-Algo trading indicator will help you to draw trends which is special and are too strong than the basics trend , trends will change with the frame time that you work on . 3-We can
299 USD
Full Forex Market View Dashboard
Opengates Success International
5 (2)
FULL FOREX MARKET VIEWダッシュボードインジケーター これは、トレーダーが市場で何が起こっているかを完全に把握できるようにするために作成されたカスタム指標です。 リアルタイム データを使用して市場にアクセスし、取引を成功させるために必要なあらゆる情報を表示します。 インストール: このインジケーターをウィンドウ チャートに添付する前に、MT4 のマーケット ウォッチ パネルに移動し、不要な通貨ペアまたは取引しないすべての通貨ペアを非表示にして、残りをそこに残します。 その理由は、FFMV ダッシュボードが MT4 の気配値表示に表示されるすべての通貨ペアを表示するためです。 最大 30 通貨ペア以下を表示できます。 MT4 の気配値表示でそれ以上だと、FFMV ダッシュボードのフォントと画像がぼやけて変形します。 正しく表示されません。 使用法:      個人取引の場合      バスケット取引の場合 (方法についてはスクリーンショットを参照してください)      複数注文取引にも使用可能      独自の取引システムなどから
650 USD
DESCRIPTION The CHAOS INDICATOR has been developed to be used for the TRADING STRATEGY OF CHAOS, as described in the book. The book is in italian language only and can be obtained only on my website indicated below. DATAS COLLECTED AND SHOWN ON GRAPHS The CHAOS INDICATOR apply easily to any graph and any asset, and it is a TRADING FACILITATOR, as it identify immediately the following items on any graph: - The GP (= RIGHT PRICE) i.e. the price to which the asset should be attracted within 24
380 USD
MT5 Version SMT Divergences MT4 SMT Divergences is one of the most innovative indicators in the market. It offers the possibility of analyzing price divergences between 2 pairs. These divergences highlight and help to foresee what banks and institutions are planning to do. SMT divergences also provides you with a kill zones indicator and the possibility of filtering divergences occurring during these kill zones.  The strategy tester is limited in MT4. Contact the author to get your Demo Version
224 USD
Buy And Sell Signal Arrows On The Chart When The Price Is About To Reverse. Also Sends Alerts – On MT4 To Your Phone To Your Email. Does not repaint. Works on any pair, any timeframe.   (Just ajust the settings for your pair and timeframe.) 10 Activations allowed so you are free from limitations MT5 version here .   What is Price Rejection and Reversal and why is it important to you? If price shows certain signs of rejection e.g. a large wick, this often means that it will then r
297 USD
The breakout algorithm is a technique based on price, price features, to shape a breakout strategy. The strategy in this indicator will not be redrawn (none-repaint indicator), it is suitable for short or long term traders In the screenshot is the EURUSD pair, these currency pairs, commodities or stocks, it have similar strength *Non-Repainting (not redrawn) *For Metatrader4 Only *Great For Scalping *Great For Swing Trading *Arrow Entry, Green is Long, Red is Short *Works On Any Timeframe *Work
9 900 USD
Gartley Projection D
Oleksandr Medviediev
4.17 (6)
The indicator identifies the harmonic patterns (XABCD) according to developments of H.M.Gartley ( "Profits in the Stock Market" , 1935г). It projects D-point as a point in the perspective projection (specify ProjectionD_Mode = true in the settings). Does not redraw. When a bar of the working timeframe closes, if the identified pattern point has not moved during Patterns_Fractal_Bars bars, an arrow appears on the chart (in the direction of the expected price movement). From this moment on, the ar
300 USD
WORLD'S FIRST AUTO SCALED GANN PERCENTAGES CHANEL AND GANN GRID                                                                     W.D. Gann Grid With auto Scale & Percentage Change.. Gann Grid is unique concept to finding major turning points  and Support/resistance level Our tools has additional feature for Scale point input method and price percentage method to use any stock and commodities charts scale. Normally people are using fix grid for a
300 USD
Ns_Geometric Chart Scale for MT4-Gann Grid,Gann Square & Gann box...To Draw any Geometric Shapes and Gann grid. #Forex Currecnies Pairs-Place same number & decimal in Gann Grid. if Commodities & Cryptocurrencies chart scale shows 0.66/66 same Scale for GannGrid ,for Gann square/Gann scale-66/660 Box only Numbers. #If Stocks & Index sale display - 3.03 that means Same scale input 3.03 for  Gann Grid and 303 for Gann Square & Gann Box Scale. Video Links :- https://youtu.be/Wnzq2-65GG4           
599 USD
作者のその他のプロダクト
Introduction to EFW Analytics EFW Analytics was designed to accomplish the statement "We trade because there are regularities in the financial market". EFW Analytics is a set of tools designed to maximize your trading performance by capturing the repeating fractal geometry, known as the fifth regularity in the financial market. The functionality of EFW Analytics consists of three parts. Firstly, Equilibrium Fractal Wave Index is an exploratory tool to support your trading logic to choose which r
200 USD
Mean Reversion Supply Demand Indicator Mean Reversion Supply Demand is the indicator to detect the important supply demand zone in your chart. The concept of supply demand trading relies on the quantity mismatching between buying and selling volumes in the financial market. Typically, supply demand zone serves to predict the turning point. The wave pattern, for any supply demand zone to work as an successful trade, looks like the price must touch the base zone, move away and then return to zone
80 USD
Introduction to X3 Chart Pattern Scanner X3 Cherart Pattern Scanner is the non-repainting and non-lagging indicator detecting X3 chart patterns including Harmonic pattern, Elliott Wave pattern, X3 patterns, and Japanese Candlestick patterns. Historical patterns match with signal patterns. Hence, you can readily develop the solid trading strategy in your chart. More importantly, this superb pattern scanner can detect the optimal pattern of its kind. In addition, you can switch on and off individu
250 USD
Introduction Harmonic Patterns are best used to predict potential turning point. Traditionally, Harmonic Pattern was identified manually connecting peaks and troughs points in the chart. Manual harmonic pattern detection is painfully tedious and not suitable for everyone. You are often exposed under subjective pattern identification with manual pattern detection. To avoid these limitations, Harmonic Pattern Plus was designed to automate your harmonic pattern detection process. The functionality
98 USD
Introduction to Fractal Pattern Scanner Fractal Indicator refers to the technical indicator that makes use of the fractal geometry found in the financial market. Fractal Pattern Scanner is the advanced Fractal Indicator that brings the latest trading technology after the extensive research and development work in the fractal geometry in the financial market. The most important feature in Fractal Pattern Scanner is the ability to measure the turning point probability as well as the trend probabi
185 USD
Introduction to Harmonic Pattern Scenario Planner The present state of Forex market can go through many different possible price paths to reach its future destination. Future is dynamic. Therefore, planning your trade with possible future scenario is an important step for your success. To meet such a powerful concept, we introduce the Harmonic Pattern Scenario Planner, the first predictive Harmonic Pattern Tool in the world among its kind. Main Features Predicting future patterns for scenari
100 USD
Introduction to Fractal Pattern Scanner Fractal Indicator refers to the technical indicator that makes use of the fractal geometry found in the financial market. Fractal Pattern Scanner is the advanced Fractal Indicator that brings the latest trading technology after the extensive research and development work in the fractal geometry in the financial market. The most important feature in Fractal Pattern Scanner is the ability to measure the turning point probability as well as the trend probabil
185 USD
Introduction to Harmonic Pattern Scenario Planner The present state of Forex market can go through many different possible price paths to reach its future destination. Future is dynamic. Therefore, planning your trade with possible future scenario is an important step for your success. To meet such a powerful concept, we introduce the Harmonic Pattern Scenario Planner, the first predictive Harmonic Pattern Tool in the world among its kind. Main Features Predicting future patterns for scenar
100 USD
Introduction Excessive Momentum Indicator is the momentum indicator to measure the excessive momentum directly from raw price series. Hence, this is an extended price action and pattern trading. Excessive Momentum Indicator was originally developed by Young Ho Seo. This indicator demonstrates the concept of Equilibrium Fractal Wave and Practical Application at the same time. Excessive Momentum detects the market anomaly. Excessive momentum will give us a lot of clue about potential reversal and
200 USD
Ace Supply Demand Zone Indicator The concept of supply demand relies on the quantity mismatching between buying and selling volumes in the financial market. Supply and demand zone can provide the good entry and exit. A zone is easier to trade than a line. The supply demand zone can provide the detailed trading plan and the risk management. Its ability to predict market direction is high. There are two distinctive points about Ace Supply Demand Zone Indicator. Ace Supply Demand Zone indicator was
100 USD
Introduction This indicator detects volume spread patterns for buy and sell opportunity. The patterns include demand and supply patterns. You might use each pattern for trading. However, these patterns are best used to detect the demand zone (=accumulation area) and supply zone (=distribution area). Demand pattern indicates generally potential buying opportunity. Supply pattern indicates generally potential selling opportunity. These are the underlying patterns rather than direct price action. T
FREE
Ace Supply Demand Zone Indicator The concept of supply demand relies on the quantity mismatching between buying and selling volumes in the financial market. Supply and demand zone can provide the good entry and exit. A zone is easier to trade than a line. The supply demand zone can provide the detailed trading plan and the risk management. Its ability to predict market direction is high. There are two distinctive points about Ace Supply Demand Zone Indicator. Ace Supply Demand Zone indicator was
100 USD
Peak Trough Analysis is the great tool to detect peaks and troughs in your chart. Peak Trough Analysis tool can use three different peaks and troughs detection algorithm. The three algorithm include the orignal Fractals Indicator by Bill Williams, the Modified Fractals indicator and ZigZag indicator. You can use this peak and trough analysis tool to detect the price pattern made up from Equilibrium Fractal-Wave process. For further usage, there are good guide line on how to use this peak trough
FREE
Elliott Wave Trend was designed for the scientific wave counting. This tool focuses to get rid of the vagueness of the classic Elliott Wave Counting using the guideline from the template and pattern approach. In doing so, firstly Elliott Wave Trend offers the template for your wave counting. Secondly, it offers Wave Structural Score to assist to identify accurate wave formation. It offers both impulse wave Structural Score and corrective wave Structure Score. Structural Score is the rating to sh
200 USD
Introduction to Order Risk Management EA ORM EA is specially designed for fast and accurate market order execution to be used with our Price Action and Econometric Trading strategies listed below. ORM EA is fully automatic and ORM EA is also very easy to use. ORM EA is totally free of charge. You can also use this robust order execution feature of this ORM EA for any other your own trading strategy. Trading Strategy Guide Order Risk Management EA provides the guide for the risk management for
FREE
Introduction This indicator detects volume spread patterns for buy and sell opportunity. The patterns include demand and supply patterns. You might use each pattern for trading. However, these patterns are best used to detect the demand zone (=accumulation area) and supply zone (=distribution area). Demand pattern indicates generally potential buying opportunity. Supply pattern indicates generally potential selling opportunity. These are the underlying patterns rather than direct price action. T
FREE
Introduction To Time Box Indicator Time Box Indicator is a must have indicator for any trader. It will display daily, weekly and Monthly box according to your preferences. Yet, you can extend any important price levels in your chart automatically. You can use them as the significant support and resistance levels. It is very simple but effective tool for your trading. Graphic Setting Use White Chart Line Style for Current Open price Daily Setting Update Timeframe for daily box Number of days
FREE
Introduction to Fractal Moving Average Fractal Moving Average indicator was designed as part of Fractal Pattern Scanner. Inside Fractal Pattern Scanner, Fractal Moving Average Indicator was implemented as multiple of chart objects. With over thousands of chart object, we find that it was not the best and efficient ways to operate the indicator. It was computationally too heavy for the indicator. Hence, we decide to implement the indicator version of Fractal Moving Average indicator to benefit ou
FREE
Peak Trough Analysis is the great tool to detect peaks and troughs in your chart. Peak Trough Analysis tool can use three different peaks and troughs detection algorithm. The three algorithm include the orignal Fractals Indicator by Bill Williams, the Modified Fractals indicator and ZigZag indicator. You can use this peak and trough analysis tool to detect the price pattern made up from Equilibrium Fractal-Wave process. For further usage, there are good guide line on how to use this peak trough
FREE
Introduction to X3 Chart Pattern Scanner X3 Cherart Pattern Scanner is the non-repainting and non-lagging indicator detecting X3 chart patterns including Harmonic pattern, Elliott Wave pattern, X3 patterns, and Japanese Candlestick patterns. Historical patterns match with signal patterns. Hence, you can readily develop the solid trading strategy in your chart. More importantly, this superb pattern scanner can detect the optimal pattern of its kind. In addition, you can switch on and off individu
250 USD
Introduction Auto Chart Alert is a convenient tool to set alert for your trading in your chart. With Auto Chart Alert, you can set the alert line in one click in your desired location in your chart. You can even set alert over the sloped lines in your chart. Auto Chart Alert is a great tool when you have to watch out importnat support and resistance levels for your trading. You can receive the sound alert, email and push notification when the price hit the alert line at you desired location. A
FREE
Introduction to Fibonacci Volatility Indicator Volatility indicator can help you to detect any statistical advantage for your trading. Especially, if you are trading with Price Action and Price Patterns, then we recommend to use the Volatility indicator together with your strategy. Especically, Fibonacci Volatility indicator combines the market volatiltiy with Fibonacci Analysis to provide you more advanced volatiltiy indicator. Main Features Fibonacci Volatility in Z score Configuration Mode Fi
100 USD
Introduction Harmonic Patterns are best used to predict potential turning point. Traditionally, Harmonic Pattern was identified manually connecting peaks and troughs points in the chart. Manual harmonic pattern detection is painfully tedious and not suitable for everyone. You are often exposed under subjective pattern identification with manual pattern detection. To avoid these limitations, Harmonic Pattern Plus was designed to automate your harmonic pattern detection process. The functionality
98 USD
Introduction Excessive Momentum Indicator is the momentum indicator to measure the excessive momentum directly from raw price series. Hence, this is an extended price action and pattern trading. Excessive Momentum Indicator was originally developed by Young Ho Seo. This indicator demonstrates the concept of Equilibrium Fractal Wave and Practical Application at the same time. Excessive Momentum detects the market anomaly. Excessive momentum will give us a lot of clue about potential reversal and
200 USD
Price Breakout pattern Scanner is the automatic scanner for traders and investors. It can detect following patterns automatically from your chart. Head and Shoulder - Common tradable pattern. Reverse Head and Shoulder - This pattern is the reverse formation of the Head and Shoulder. Double Top - When the price hits resistance level twice and decline toward the support level, the trader can anticipate sudden bearish breakout through the support level. Double Bottom - The double bottom pattern is
100 USD
Introduction Auto Chart Alert is a convenient tool to set alert for your trading in your chart. With Auto Chart Alert, you can set the alert line in one click in your desired location in your chart. You can even set alert over the sloped lines in your chart. Auto Chart Alert is a great tool when you have to watch out importnat support and resistance levels for your trading. You can receive the sound alert, email and push notification when the price hit the alert line at you desired location. A
FREE
Introduction to Order Risk Management EA ORM EA is specially designed for fast and accurate market order execution to be used with our Price Action and Econometric Trading strategies listed below. ORM EA is fully automatic and ORM EA is also very easy to use. ORM EA is totally free of charge. You can also use this robust order execution feature of this ORM EA for any other your own trading strategy. Trading Strategy Guide Order Risk Management EA provides the guide for the risk management for
FREE
Introduction to Sideways Market Analyzer Notable period of Low volatility and non-trending movements in the financial market is considered as Sideways Market. Sooner or later, the low volatility will increase and the price will pick up a trend after Sideways Market. In terms of trading point of view, Sideways Market can serve as the very good entry timing for traders. Sideways Market is also quite often the representation of accumulation of large orders from big investors. Therefore, knowing the
100 USD
Introduction To Time Box Indicator Time Box Indicator is a must have indicator for any trader. It will display daily, weekly and Monthly box according to your preferences. Yet, you can extend any important price levels in your chart automatically. You can use them as the significant support and resistance levels. It is very simple but effective tool for your trading. Graphic Setting Use White Chart Line Style for Current Open price Daily Setting Update Timeframe for daily box Number of days
FREE
Introduction to Fractal Moving Average Fractal Moving Average indicator was designed as part of Fractal Pattern Scanner. Inside Fractal Pattern Scanner, Fractal Moving Average Indicator was implemented as multiple of chart objects. With over thousands of chart object, we find that it was not the best and efficient ways to operate the indicator. It was computationally too heavy for the indicator. Hence, we decide to implement the indicator version of Fractal Moving Average indicator to benefit
FREE
フィルタ:
elite luis
3037
elite luis 2023.03.05 15:31 
 

I agreed with Vincent review 100% Amazing Wave and Superimposed patterns! Thanks Author! but need some manual instruction pdf or url on the setting that explain how to use, the previous tutorial link you posted in comment I click but no instruction cannot find anything, I've posted some comment question in comment page, please help answer my questions?

*updated review 10/3/2023 * What I like about this is able to draw trend for different period easily with a click of a button and it also draw trend into the future and price reacted to the line, accurate and amazing!

Young Ho Seo
114816
開発者からの返信 Young Ho Seo 2023.03.06 11:17
Hello. Here is some good educational materials around Superimposed Patterns. Introduction to EFW Index for trading https://algotrading-investment.com/2020/06/04/introduction-to-efw-index-for-trading/ Trading with the Shape ratio of Equilibrium Fractal Wave https://algotrading-investment.com/2020/06/04/trading-with-the-shape-ratio-of-equilibrium-fractal-wave/ Introduction to Equilibrium Fractal Wave (EFW) Channel https://algotrading-investment.com/2020/06/04/introduction-to-equilibrium-fractal-wave-efw-channel/ Practical Trading with Equilibrium Fractal Wave (EFW) Channel https://algotrading-investment.com/2020/06/04/practical-trading-with-equilibrium-fractal-wave-efw-channel/ Superimposed Equilibrium Fractal Waves https://algotrading-investment.com/2020/06/04/superimposed-equilibrium-fractal-waves/
Vincent Paul Colombe
684
Vincent Paul Colombe 2022.01.13 22:34 
 

One of my favourite indicator! Superimposed patterns are killers, and great efficiency in weekly or even monthly timeframe. Heartly recommended ñ

Young Ho Seo
114816
開発者からの返信 Young Ho Seo 2022.07.23 16:38
Yes, you are correct. Superimposed wave patterns are the something really significant when it is used correctly. The Book: Scientific Guide to Price Action and Pattern Trading has all the details about the superimposed pattern.
Petter Rogstad
537
Petter Rogstad 2021.09.24 03:43 
 

This is no doubt my best investment on MQL5. This is like the Ferrari of indicators. Have a learning curve and take some time to understand but after some time you get a very good understanding of what is happening in the market. You understand how pattern and cycles repeat itself and you can benefit from this knowledge and gain competitive advantages.

レビューに返信
バージョン 10.8 2022.07.01
In version 10.8, we have made some minor improvement on Equilibrium Fractal Wave Analytics on MetaTrader.
バージョン 10.7 2022.03.02
In version 10.7, we made some minor improvement on Equilibrium Fractal Wave Analytics.

When you use this tool alone, we recommend the combined signal from superimposed pattern and EFW channel. You can use EFW Analytics with some of our other products. Here is some example of trading signal you can generate.

Superimposed patterns + EFW channel (Default Reversal trading strategy when you are using EFW Analytics alone)
You can also use EFW Channel for breakout trading too. But please use your own setup for this case.
Superimposed patterns with Triangle Pattern, Falling Wedge Pattern, Rising Wedge Pattern and Channel
EFW channel with Harmonic Pattern Detection Indicator
Superimposed pattern or EFW channel with Supply Demand Indicator
Superimposed pattern or EFW channel with Elliott Wave Indicator
Superimposed pattern or EFW channel with Volume Spread Analysis
バージョン 10.6 2018.12.26
In version 10.6, now you can project significant channels into the future. You can do this by either click on Upper button or Lower button. When you click Upper button, you will be projecting significant channel into upper sphere of price range. When you click Lower button, you will be project significant channel into lower sphere of price range. Before setting up your trading, please check the rating and lock the relevant channels for your trading. Welcome to the world of Price Action and Pattern Trading, the scientific way of profiting from market.
バージョン 10.5 2018.12.26
In version 10.5, now you can project significant channels into the future. You can do this by either click on Upper button or Lower button. When you click Upper button, you will be projecting significant channel into upper sphere of price range. When you click Lower button, you will be project significant channel into lower sphere of price range. Before setting up your trading, please check the rating and lock the relevant channels for your trading. Welcome to the world of Price Action and Pattern Trading, the scientific way of profiting from market.
バージョン 9.9 2018.12.24
In version 9.9, you can check the neighbouring channels near the peak or trough. To check the neighbouring channel, just click the brown circle on the peak or trough.
バージョン 9.3 2018.12.23
In version 9.3, we have added Channel rating information for Single EFW Channel. Now you have two types of channel ratings. They are SEC Rating = Superimposed EFW Channel and EC Rating = EFW Channel Rating. We put slightly more weight on SEC Rating because superimposed patterns are considered as more significant than single EFW channel. However, still EC Rating is an important metric to select good channel for your trading. Use SEC and EC rating together to configure your best channel setting for your trading to pick our breakout point and reversal points.
バージョン 9.1 2018.10.17
In version 9.1, superimposed channel can be shown in another timeframe too.
バージョン 8.7 2018.10.15
In Version 8.7, Superimposed Channel will only show in the current timeframe for correct display. This means that you can not move superimposed channel from current timeframe to other timeframe because it will cause the resolution issues (losing resolution in higher timeframe).
バージョン 8.6 2018.10.14
In Version 8.6, Superimposed Channel Rating was added. High Channel Rating = High Prediction Power
バージョン 8.3 2018.10.13
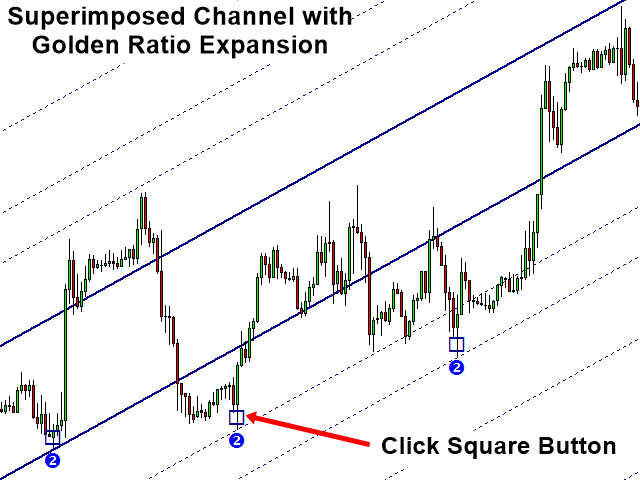
In Version 8.3, EFW Analytics can draw Superimposed Channel with expansion. Many new powerful features are added in this version 8.3.
バージョン 7.6 2018.09.29
In Version 7.6, We made total change to our Superimposed pattern detection. Overall, the trading strategy is much more similar to the Book: Winning Financial Trading with Equilibrium Fractal Wave: Introduction to Equilibrium Fractal Wave Trading.
However, the trading signal must be triggered using the comfirmation of EFW Channel + Superimposed patterns together unless you are using some other secondary confiramtion techniques.
バージョン 5.2 2018.03.01
In version 5.2, EFW Analytics can detect superimposed levels automatically.
バージョン 3.1 2018.02.22
In version 3.1, user can select multiple of shape ratio for their trading.