• Обзор
  • Отзывы
  • Обсуждение (8)
  • Что нового

Gekko ADX Plus

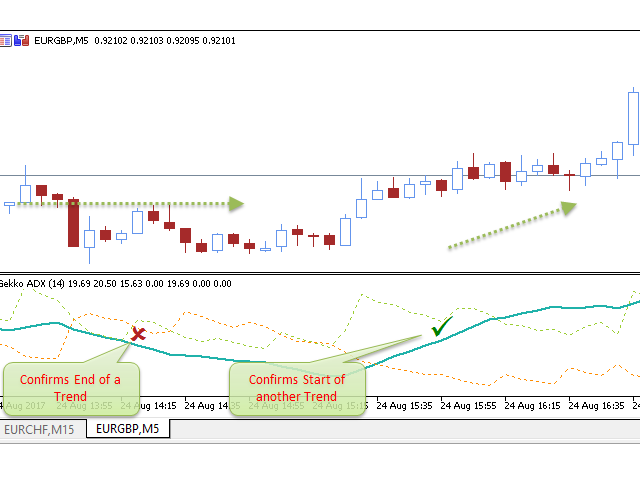
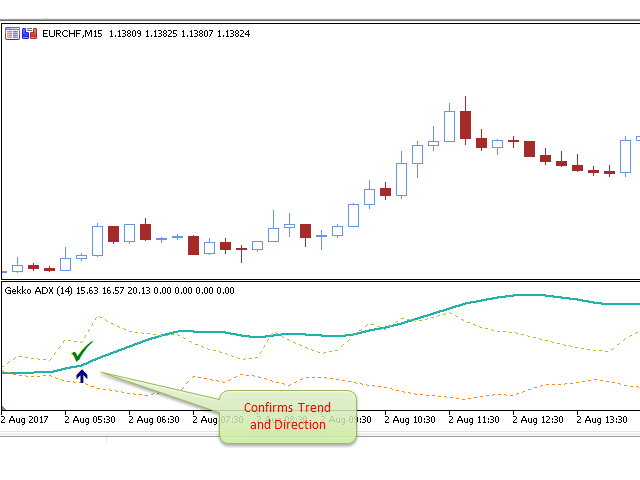
Индикатор среднего направленного индекса Gekko — это модифицированная версия знаменитого индикатора ADX. Индикатор сочетает стандартный индикатор ADX с различными расчетами сигналов входа и оповещением о потенциальных точках входа и выхода.
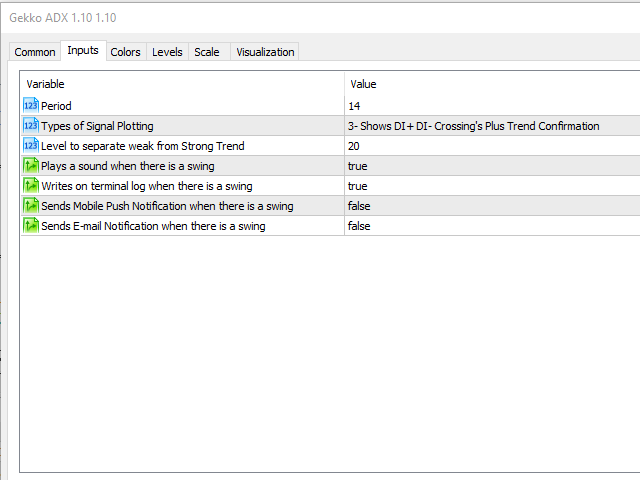

Входные параметры

  • Period: период расчета ADX;
  • PlotSignalType: метод расчета сигнала входа (свинг):
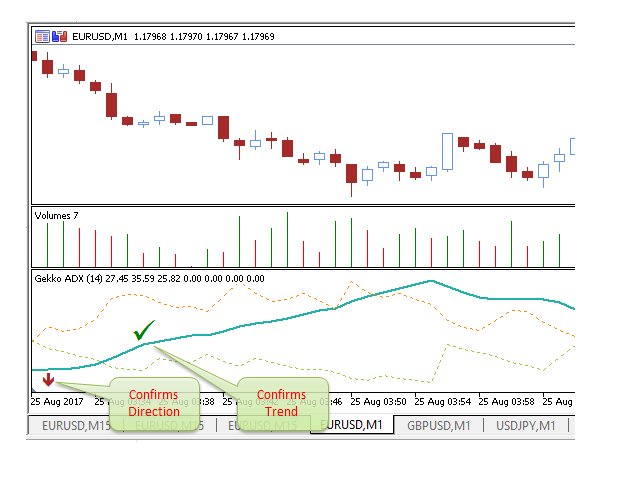
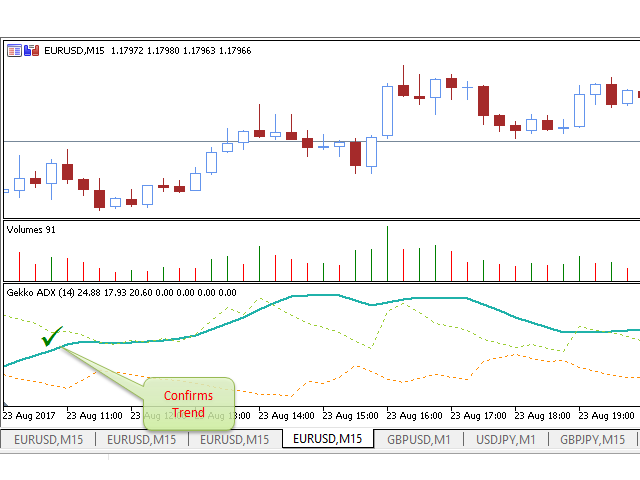
    • 1- ShowSwingsOnTrendLevel: показывает сигналы с подтверждением тренда;
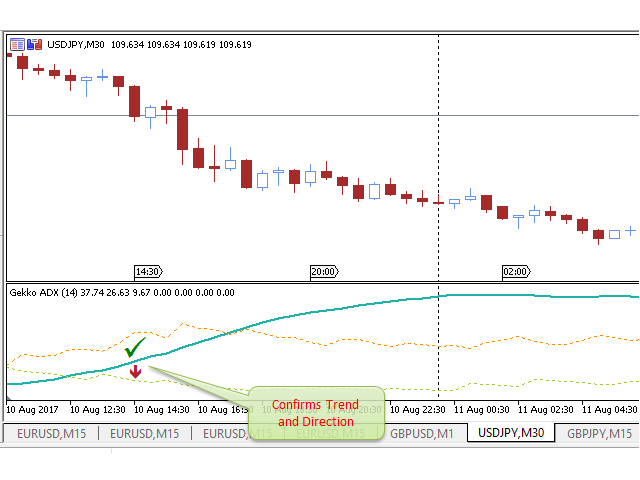
    • 2- ShowSwingsOnTrendLevelDirection: показывает сигналы с подтверждением тренда и направлением входа (длинное или короткое);
    • 3- ShowSwingsOnPosAndNegDI: показывает длинные и короткие сигналы на вход/выход на основе пересечений DI+ и DI- и подтверждения тренда;
  • Trend Level - уровень для подтверждения формирования тренда.
  • Plays a sound when there is a swing - установите в значение true, чтобы индикатор воспроизводил звук в терминале MetaTrader при обнаружении свинга, уведомляя о точках входа/выхода.
  • Write Logs On Terminal Window - при значении true индикатор будет добавлять записи о свинг-сигналах в журнал экспертов;
  • Send Mobile Push Notifications - при значении true будут отправляться push-уведомления о сигналах на ваш смартфон;
  • Send E-Mail Alerts - при значении true вы будете получать уведомления по электронной почте,для этого необходимо настроить терминал.

Удачной торговли!

Пожертвуйте часть своей прибыли на любые благие цели: "Деньги приходят только в том случае, если вам есть ради чего их зарабатывать".

Рекомендуем также
Weis Waves
Flavio Jarabeck
3.3 (23)
The original author is David Weis, an expert in the Wyckoff Method. The Weis Wave is a modern adaptation of the 1930's Wyckoff Method, another expert in Tape Reading techniques and Chart Analysis. Weis Waves takes market volume and stacks it into waves according to price conditions giving the trader valuable insights about the market conditions. If you want to learn more about this subject you can find tons of videos in YouTube. Just look for "The Wickoff Method", "Weis Wave" and "Volume Spread
FREE
Follow The Line MT5
Oliver Gideon Amofa Appiah
4.23 (22)
This indicator obeys the popular maxim that: "THE TREND IS YOUR FRIEND" It paints a GREEN line for BUY and also paints a RED line for SELL. (you can change the colors). It gives alarms and alerts of all kinds. IT DOES NOT REPAINT and can be used for all currency pairs and timeframes. Yes, as easy and simple as that. Even a newbie can use it to make great and reliable trades. NB: For best results, get my other premium indicators for more powerful and reliable signals. Get them here: https://www.m
FREE
Donchian Channel DC is the indicator of Donchian Channels, that plots maximum and minimum values of a specific period, besides mean value line. It´s possible to configure simple period for analysis and the indicator will plot all three values. You can trade with this indicator as trend or reversal, according to each strategy. Do not let to test others indicators as soon as others expert advisors.
30 USD
PZ Penta O MT5
PZ TRADING SLU
3.8 (5)
The Penta-O is a 6-point retracement harmonacci pattern which usually precedes big market movements. Penta-O patterns can expand and repaint quite a bit. To make things easier this indicator implements a twist: it waits for a donchian breakout in the right direction before signaling the trade. The end result is an otherwise repainting indicator with a very reliable trading signal. The donchian breakout period is entered as an input. [ Installation Guide | Update Guide | Troubleshooting | FAQ | A
FREE
Renko Plus
Eadvisors Software Inc.
With Renko Plus you can use the features in the Indicator functionality, just add it to the Metatrader5 chart.             The Renko chart is a type of chart, developed by the Japanese, that is constructed using price movement rather than standardized prices and time intervals like most charts. It is believed to be named after the Japanese word for bricks, "renga", as the graphic looks like a series of bricks.             A new brick is created when the price moves a specified p
70 USD
Weis Wave
Sergey Mylnikov
5 (4)
Индикатор для определения силы ФОНА рынка. Показывает суммарный объём, средний объём, индекс усилия и пункты в ценовом движении. Благодаря этому можно с легко определять точки спроса и предложение на рынке, моменты разворота, зоны дисбаланса. Работает на любых рынках с любыми объёмами, Форекс, фьючерсы, акции.  Не перерисовывается, Автоматический алгоритм построения волн позволяет работать с любым инструментом на любом таймфрейме вне зависимости от волатильности "без подстройки под инструмент".
FREE
White Weis Volume This indicator shows the sum of the volume in each wave, bulish or bearish, as idealized by David Weis , but it brings an important addition , which is the marking of the bar with the highest volume of the wave (White Bar)! In coding the indicator, it was sought to optimize the code to require minimal processing during use and not to overload mt5. The indicator can be used for pre-trading analysis and study, where the trader analyzes possible points of support and resi
30 USD
The idea of a Value Chart indicator was presented in the very good book I read back in 2020 , " Dynamic Trading Indicators: Winning with Value Charts and Price Action Profile ", from the authors Mark Helweg and David Stendahl. The idea is simple and the result is pure genius: Present candlestick Price analysis in a detrended way! HOW TO READ THIS INDICATOR Look for Overbought and Oversold levels. Of course, you will need to test the settings a lot to find the "correct" one for your approach.
FREE
Weis Wave Double Side
Eduardo Da Costa Custodio Santos
Индикатор Weis Wave Bouble Side для MT5 является частью набора инструментов (Wyckoff Academy Wave Market). Индикатор Weis Wave Bouble side для MT5 был создан на основе уже установленной волны Weis, созданной Дэвидом Вайсом. Индикатор Weis Wave Double Side читает рынок по волнам, как это было сделано Р. Вайкофф в 1900 г. Это помогает определить усилие x результат, причину и следствие, а также спрос и предложение. Его отличие в том, что его можно использовать ниже нулевой оси, что еще больше улучш
30 USD
Introduction This indicator detects volume spread patterns for buy and sell opportunity. The patterns include demand and supply patterns. You might use each pattern for trading. However, these patterns are best used to detect the demand zone (=accumulation area) and supply zone (=distribution area). Demand pattern indicates generally potential buying opportunity. Supply pattern indicates generally potential selling opportunity. These are the underlying patterns rather than direct price action. T
FREE
Order Book, известный также как Market Book, глубина рынка, стакан цен, Level 2, - это предоставляемая брокером динамически обновляемая таблица с данными по текущим объемам торговых заявок на покупку и продажу для различных уровней цен вблизи Bid и Ask конкретного финансового инструмента. MetaTrader 5 предоставляет возможность трансляции стакана цен , но только в реальном времени. Данный индикатор OrderBook Cumulative Indicator позволяет аккумулировать данные стакана онлайн и визуализировать их
49 USD
Donchian Channel is an indicator created by Richard Donchian. It is formed by taking the highest high and the lowest low of the last specified period in candles. The area between high and low is the channel for the chosen period. Its configuration is simple. It is possible to have the average between the upper and lower lines, plus you have alerts when price hits one side. If you have any questions or find any bugs, please contact me. Enjoy! This is a free indicator, but it took hours to develo
FREE
Waves Sizer
Flavio Jarabeck
3 (2)
Wyckoff fans, enjoy! Ideally to be used with the Weis Waves indicator, but it can be easily used alone, the Waves Sizer puts the range (in resulting Price movement) done by the Price on its market swings. You can control how accurate or loose will be the swings. This tool is very helpful for visually know how much the Price has traveled in your Timeframe. This way you can confront this level of effort with the resulting Volume, etc... Weis Waves indicator: https://www.mql5.com/en/market/pro
FREE
Are you tired of drawing trendlines every time you're analyzing charts? Or perhaps you would like more consistency in your technical analysis. Then this is for you. This indicator will draw trend lines automatically when dropped on a chart. How it works Works similar to standard deviation channel found on mt4 and mt5. It has 2 parameters: 1. Starting Bar 2. Number of bars for calculation The   starting bar   is the bar which drawing of the trend lines will begin, while the   number of bars for c
FREE
This is a buyer and seller aggression indicator that analyzes the shape of each candle and project this data in a histogram form. There are 4 histograms in one. On the front we have two: Upper - Buyer force. Lower - Seller force. At the background we also have two histogram, both with same color. They measure the combined strenght of buyers and sellers. This histograms can be turned off in Input Parameters. It is also possible to have the real or tick volume to help on this force measurement. IN
FREE
Accurate
Aleksandr Kostusev
5 (1)
Индикатор автоматически выстраивает патерны следующих типов - "Бичий Флаг", "Медвежий Флаг","Бычий Вымпел", "Медвежий Вымпел", "Бычий Падающий Клин", "Медвежий восходящий клин". Так же индикатор стрелками сигнализирует о возможной точке входа. Индикатор муьтивалютный, торговать можно всем начиная от криптовалют, заканчивая индексами. Чем выще таймфрейм инструмента, на котором стоит индикатор, тем точнее точка входа а ценовое движение будет намного длиннее!
FREE
Important Lines
Terence Gronowski
4.88 (24)
Индикатор отображает линии пивот, уровни максимума, минимума и закрытия предыдущего дня, а также минимум и максимум предыдущего часа. Нужно просто установить этот индикатор на график, чтобы отобразить все эти важные линии, нет необходимости настраивать множество отдельных индикаторов. Почему важны определенные линии Максимум и минимум предыдущего дня : эти уровни используются для торговли на дневном графике. Очень часто, если цена становится выше или ниже минимума/максимума предыдущего дня, пр
FREE
The Donchian Channel Channels are among the most popular tools of technical analysis, as they visually convey to the analyst the limits within which most price movement tends to occur. Channel users know that valuable information can be obtained at any time, whether prices are in the central region of a band or close to one of the border lines. One of the best known techniques to explore these concepts is Bollinger Bands. However, John Bollinger was not the only one to research the applicatio
FREE
You can download the Full version with more features here . Introduction Harmonic Patterns are best used to predict turning point. Harmonic Patterns give you high win rate and high opportunities for trade in during one day. This indicator detects the best and successful patterns base on Harmonic Trading books by Mr. Scott M.. Main Features Detect the best and   most successful patterns : Gartley, Bat, Crab, Butterfly, Cypher, Shark, Alt_Bat, Deep_Crab Easy-to-use and user friendly indicator Sca
FREE
The Half ma arrow indicator for the MetaTrader 5 trading terminal is a simple but effective tool that gives a signal about a change in the current trend. The Half ma indicator looks like a solid dynamic line that changes color at the points where the trend changes. At these points, the indicator draws arrows of the corresponding color and direction.The Half ma arrow indicator for the MT5 terminal is not an independent source of input signals. It will be most effective to use it as a trend filte
40 USD
Weis Wave Double Side Alert
Eduardo Da Costa Custodio Santos
Индикатор Weis Wave Bouble Side для MT5 является частью набора инструментов (Wyckoff Academy Wave Market). Индикатор Weis Wave Bouble side для MT5 был создан на основе уже установленной волны Weis, созданной Дэвидом Вайсом. Индикатор Weis Wave Double Side считывает рынок по волнам, как это делал Р. Вайкофф в 1900 году. Это помогает определить усилие x результат, причину и следствие, а также спрос и предложение. Его отличие состоит в том, что его можно использовать ниже нулевой оси, и он имеет пр
60 USD
Dual RSI
Paul Conrad Carlson
Indicator alerts for Dual Relative strength index rsi. Large rsi preset at 14 is below 30 small rsi preset at 4 is below 10 for buy bullish signals . Large rsi preset are 14 is above 70 small rsi preset at 4 is above 90 for sell bearish signals . Includes mobile and terminal alerts. draws lines when alerts. This indicator can help identify extremes and then the tops or bottoms of those extremes .
FREE
Free automatic Fibonacci is an indicator that automatically plots a Fibonacci retracement based on the number of bars you select on the BarsToScan setting in the indicator. The Fibonacci is automatically updated in real time as new highest and lowest values appears amongst the selected bars. You can select which level values to be displayed in the indicator settings. You can also select the color of the levels thus enabling the trader to be able to attach the indicator several times with differe
FREE
Индикатор анализирует шкалу объёмов и разделяет её на две компоненты - объёмы продавцов и объёмы покупателей, а также вычисляет дельту и кумулятивную дельту. Индикатор не мерцает и не перерисовывает, вычисления и отрисовку производит достаточно быстро, используя при этом данные с младших (относительно текущего) периодов. Режимы работы индикатора переключаются с помощью входной переменной Mode : Buy - отображает только объёмы покупателей. Sell - отображает только объёмы продавцов. BuySell - отобр
FREE
Описание :  мы рады представить наш новый бесплатный индикатор, основанный на одном из профессиональных и популярных индикаторов на рынке форекс (PSAR), этот индикатор является новой модификацией оригинального индикатора Parabolic SAR, в индикаторе pro SAR вы можете видеть пересечение между точками и графиком цены, это пересечение не является сигналом, а говорит о возможности окончания движения, вы можете начать покупать с новой синей точки, и разместить стоп-лосс за один атр до первой синей
FREE
This indicator is the MACD (Moving Average Convergence/Divergence) supporting Virtual Trading mode of Knots Comparer . When the mode is turned on, the indicator will be recalculated based on the displayed candlesticks. When the mode is turned off, the indicator will be recalculated based on the original chart candlesticks. Types of the applied price: Close Open High Low Median Price (HL/2) Typical Price (HLC/3) Weighted Price (HLCC/4) KC-Indicators: KC-MA (Moving Average) KC-ENV (Envelopes) KC
FREE
Description The indicator uses market profile theory to show the most relevant trading zones, on a daily basis. The zones to be shown are LVN (low volume nodes) and POC (point of control). An LVN zone is one which represents price areas with the least time or volume throughout the day. Typically, these areas indicate a supply or demand initiative, and in the future, they can turn into important breakout or retracement zones. A POC zone is one which represents price areas with the most time or vo
FREE
This indicator sums up the difference between the sells aggression and the buys aggression that occurred in each Candle, graphically plotting the waves of accumulation of the aggression volumes.   Through these waves an exponential average is calculated that indicates the direction of the business flow. Note: This indicator DOES NOT WORK for Brokers and/or Markets WITHOUT the type of aggression (BUY or SELL).   Be sure to try our Professional version with configurable features and alerts:  Agr
FREE
A countdown timer for the  Volume bar chart generator  and  Tick chart generator  products, which are available for download from the MQL5 Market: Tick chart generator: https://www.mql5.com/en/market/product/29215 Volume bar chart generator: https://www.mql5.com/en/market/product/47197 The counter conveniently displays the number of ticks or transactions (depending on the chart) that need to pass for a new bar to start printing. The user can set the following indicator inputs. Volume type
FREE
Indicator and Expert Adviser  EA Available in the comments section of this product. Download with Indicator must have indicator installed for EA to work. Mt5 indicator alerts for bollinger band and envelope extremes occurring at the same time. Buy signal alerts occur when A bullish candle has formed below both the lower bollinger band and the lower envelope  Bar must open and close below both these indicators. Sell signal occur when A bear bar is formed above the upper bollinger band and upp
FREE
С этим продуктом покупают
Топовый индикатор МТ5, дающий сигналы для входа в сделки без перерисовки! Идеальные точки входа в сделки для  валют, крипты, металлов, акций, индексов !  Смотрите  видео  (6:22) с примером отработки всего одного сигнала, окупившего индикатор. Версия индикатора для MT4 Преимущества индикатора Сигналы на вход без перерисовки Если сигнал появился, он никуда НЕ исчезает! В отличие от индикаторов с перерисовкой, которые ведут к потере депозита, потому что могут показать сигнал, а потом убрать его.
125 USD
Gold Stuff mt5
Vasiliy Strukov
4.97 (92)
Gold Stuff mt5 - трендовый индикатор, разработанный специально для золота, также может использоваться на любых финансовых инструментах. Индикатор не перерисовывается и не запаздывает. Рекомендуемый тайм-фрейм H1.  Свяжитесь со мной сразу после покупки для получения настроек и персонального бонуса! ПАРАМЕТРЫ Draw Arrow -   вкл.выкл. отрисовку стрелок на графике. Alerts -   вкл.выкл.звуковые оповещения. E-mail notification -   вкл.выкл. уведомления на почту. Puch-notification -   вкл.выкл. уведо
125 USD
ICT, SMC, SMART MONEY CONCEPTS, SMART MONEY, Smart Money Concept, Support and Resistance, Trend Analysis, Price Action, Market Structure, Order Blocks, BOS/CHoCH,   Momentum Shift, HH/LL/HL/LH,    Fair Value Gap, FVG,  Premium  &   Discount   Zones, Fibonacci Retracement, OTE, Buy Side Liquidity, Sell Side Liquidity, BSL/SSL Taken, Equal Highs & Lows, MTF Dashboard, Multiple Time Frame, BigBar, HTF OB, HTF Market Structure,  Liquidity Voids, Long Wicks, Candle Timer, Fractals, ZigZag, Time Zone
63 USD
Этот индикатор является уникальным, качественным и доступным инструментом для торговли, включающим в себя наши собственные разработки и новую формулу. В обновленной версии появилась возможность отображать зоны двух таймфреймов. Это означает, что вам будут доступны зоны не только на старшем ТФ, а сразу с двух таймфреймов - таймфрейма графика и старшего: отображение вложенных зон. Обновление обязательно понравится всем трейдерам, торгующим по зонам спроса и предложения. Важная информация Для мак
199 USD
Индикатор Supply Demand использует предыдущее ценовое действие для выявления потенциального дисбаланса между покупателями и продавцами. Ключевым является определение зон с лучшими возможностями, а не просто вероятностей. Индикатор Blahtech Supply Demand обеспечивает функционал, не доступный ни в одной платформе. Этот индикатор 4 в 1 не только выделяет зоны с более высокой вероятностью на основе механизма оценки силы по множественным критериям, но также комбинирует его с мульти-таймфреймовым ана
142 USD
Инструкция работы с индикатором   |  Стратегия Owl Smart Levels   |  Версия MT4   |   Как установить?   |   FAQ Индикатор Owl Smart Levels – это полноценная торговая система внутри одного индикатора, которая включает в себя такие популярные инструменты анализа рынка как усовершенствованные фракталы Билла Вильямса , Valable ZigZag, который строит правильную волновую структуру рынка, а также  уровни Фибоначчи, которые   отмечают точные уровни входа в рынок и места взятия прибыли. Подробное описан
97 USD
Сочетание тренда и пробоя уровней в одной системе. Продвинутый алгоритм индикатора фильтрует рыночный шум, определяет тренд, точки входа, а также возможные уровни выхода из позиции. Сигналы индикатора записываются в статистический модуль, который позволяет выбирать наиболее подходящие инструменты, показывая эффективность истории сигналов. Индикатор рассчитывает отметки ТейкПрофитов и стоплосса. Руководство пользователя ->  ЗДЕСЬ  / MT4 версия ->  ЗДЕСЬ Как торговать с индикатором: Торговля с Tr
55 USD
Royal Wave Pro M5
Vahidreza Heidar Gholami
5 (2)
Royal Wave is a Trend-Power oscillator which has been programmed to locate and signal low-risk entry and exit zones. Its core algorithm statistically analyzes the market and generates trading signals for overbought, oversold and low volatile areas. By using a well-designed alerting system, this indicator makes it easier to make proper decisions regarding where to enter and where to exit trades. Features Trend-Power Algorithm Low risk Entry Zones and Exit Zones Predictions for Overbought and Over
129 USD
Профиль Рынка (Market Profile) определяет ряд типов дней, которые помогают трейдеру распознать поведение рынка. Ключевая особенность - это область значений (Value Area), представляющая диапазон ценового действия, в котором произошло 70% торговли. Понимание области значений может помочь трейдерам вникнуть в направление рынка и установить торговлю с более высокими шансами на успех. Это отличное дополнение к любой системе, которую вы возможно используете. Blahtech Limited представляет сообществу Me
142 USD
Royal Scalping Indicator is an advanced price adaptive indicator designed to generate high-quality trading signals. Built-in multi-timeframe and multi-currency capabilities make it even more powerful to have configurations based on different symbols and timeframes. This indicator is perfect for scalp trades as well as swing trades. Royal Scalping is not just an indicator, but a trading strategy itself. Features Price Adaptive Trend Detector Algorithm Multi-Timeframe and Multi-Currency Trend Low
149 USD
Matrix Arrow Indicator MT5
Juvenille Emperor Limited
5 (11)
Индикатор Matrix Arrow MT5   — это уникальный индикатор тренда 10 в 1, следующий за   100% неперерисовывающимся   индикатором с несколькими таймфреймами, который можно использовать на всех символах/инструментах:   форекс ,  товары ,   криптовалюты ,   индексы ,  акции . Индикатор Matrix Arrow MT5  будет определять текущую тенденцию на ранних этапах, собирая информацию и данные от до 10 стандартных индикаторов, а именно: Индекс среднего направленного движения (ADX) Индекс товарного канала (CCI)
75 USD
Introduction to X3 Chart Pattern Scanner X3 Cherart Pattern Scanner is the non-repainting and non-lagging indicator detecting X3 chart patterns including Harmonic pattern, Elliott Wave pattern, X3 patterns, and Japanese Candlestick patterns. Historical patterns match with signal patterns. Hence, you can readily develop the solid trading strategy in your chart. More importantly, this superb pattern scanner can detect the optimal pattern of its kind. In addition, you can switch on and off individu
250 USD
Линии тренда являются наиболее важным инструментом технического анализа в торговле на рынке Форекс. К сожалению, большинство трейдеров рисуют их неправильно. Индикатор Automated Trendlines — это профессиональный инструмент для серьезных трейдеров, который поможет вам визуализировать трендовое движение рынков. Есть два типа линий тренда: бычьи линии тренда и медвежьи линии тренда. В восходящем тренде линия тренда Форекс проводится через самые низкие точки колебания ценового движения. Сое
99 USD
Auto Order Block with break of structure Detect Break of Structure , Mark Order Block and draw Entry / Stop and Risk to Reward lines when Order block is touch by price with Alert. Trend is Manually set to filter signals in a direction by a button on the chart. Entry / Stop and Risk to Reward lines can also be switch on / off by button on chart. Futures Auto Mark Break of Structure Auto Mark Order block Auto Mark higher time frame Point Of  Interest ( POI ) Popup Alert when BoS , Order block
55 USD
Уровни поддержки и сопротивления с давних времен были мощнейшим инструментом для анализа рынка. Strong Support индикатор строит уровни поддержки по локальным минимумам цены, а уровни сопротивления по локальным максимумам цены.  Другие мои разработки можно посмотреть   здесь Рекомендуется использовать совместно с трендовым индикатором, например,   Gold Stuff   - это позволит торговать по тренду и одновременно определять зоны консолидации или разворота тренда, а также устанавливать стоп-лосс и тей
125 USD
Offer 249 down from 350 for the next 3 copies. then back to 350 $ Are you tired of using outdated indicators that leave you guessing where to set your profit targets? Look no further than the AK CAP Opening Range Breakout Indicator. This powerful tool is backed by a US patent and has already helped countless traders pass funded challenges like FTMO. We use it daily on our prop traders and internal funds, and now it's available to you as well. The calculation behind the indicator is incredibly
249 USD
Следующее поколение автоматизированных зон спроса и предложения. Новый инновационный алгоритм, работающий на любом графике. Все зоны создаются динамически в соответствии с ценовым действием рынка. ДВА ТИПА СИГНАЛОВ --> 1) ПРИ ПОПАДАНИИ ЦЕНЫ В ЗОНУ 2) ПРИ ФОРМИРОВАНИИ НОВОЙ ЗОНЫ Вы не получите еще один бесполезный индикатор. Вы получаете полную торговую стратегию с проверенными результатами.     Новые особенности:     Оповещения, когда цена достигает зоны спроса/предложения
149 USD
Trend Trading - это индикатор, предназначенный для получения максимальной прибыли от трендов, происходящих на рынке, путем определения времени отката и прорыва. Он находит торговые возможности, анализируя, что делает цена во время установленных тенденций. [ Руководство по установке | Руководство по обновлению | Устранение неполадок | FAQ | Все продукты ] Торгуйте на финансовых рынках с уверенностью и эффективностью Прибыль от устоявшихся тенденций без проволочек Признать прибыльные откаты,
125 USD
Stargogs Spike Catcher V3 This Indicator is Developed To milk the BOOM and CRASH indices . Send me Message if you need any help with the indicator.  CHECK OUT THE STARGOGS SPIKE CATCHER EA/ROBOT V3: CLICK HERE ALSO CHECK OUT SECOND TO NONEFX SPIKE CATCHER:   CLICK HERE STARGOGS SPIKE CATCHER V3 WHATS NEW! Brand New Strategy. This is the Indicator you need for 2023. The Indicator Gives you an Entry at a time when conditions are met and you should use TP & SL. New Trendline that changes color in
100 USD
Trend Scanner mt5 сканирует рыночные тренды с мультисимволов и мультитаймфреймов и отображает их на подвижной панели на графике. Он использует индикатор   Gold Stuff   для анализа.  Трейдер может выбрать несколько пар по своему выбору для отображения. Trend Scanner — отличный инструмент для определения направления тренда, который можно использовать для ручной торговли или торговли с помощью советника, разрешая только ордера на покупку или продажу в соответствии с трендом. Результаты в режиме
125 USD
Этот индикатор обнаруживает разворот цены зигзагообразно, используя только анализ ценового действия и канал Дончиана. Он был специально разработан для краткосрочной торговли, без перекраски или перекраски вообще. Это фантастический инструмент для проницательных трейдеров, стремящихся увеличить сроки своих операций. [ Руководство по установке | Руководство по обновлению | Устранение неполадок | FAQ | Все продукты ] Удивительно легко торговать Это обеспечивает ценность на каждом таймфрейме Ре
125 USD
BUY INDICATOR AND GET EA FOR FREE AS A BONUS + SOME OTHER GIFTS! ITALO VOLUME INDICATOR  is the best volume indicator ever created, and why is that? The Indicator works on all time-frames and assets, indicator built after 6 years of experience on forex and many other markets. You know many volume indicators around the internet are not complete, does not help, and it's difficult to trade, but the Italo Volume Indicator is different , the Italo Volume Indicator shows the wave volume, when market
65 USD
Устали от построения линий поддержки и сопротивления? Сопротивление поддержки - это мульти-таймфреймовый индикатор, который автоматически обнаруживает и отображает линии поддержки и сопротивления на графике с очень интересным поворотом: поскольку ценовые уровни тестируются с течением времени и его важность возрастает, линии становятся более толстыми и темными. [ Руководство по установке | Руководство по обновлению | Устранение неполадок | FAQ | Все продукты ] Повысьте технический анализ в одноч
99 USD
• Non Repaint • DelayNo Lag •Pop Up notification • 98% Verified Accuracy • Real time arrows to catch spikes at least 4-8 bars We forward guide video how milk spikes  We also add in telegram group for better quality help  +see live trading results  https://youtu.be/DCG4CAWlg4I you will see an arrow signal and open trade for spike stop-loss of trade will be 8 or 10 candles if no spike exit you just need to follow spike arrow signals and for more good results follow inst
200 USD
Сложно найти и дефицит по частоте, дивергенции являются одним из самых надежных торговых сценариев. Этот индикатор автоматически находит и сканирует регулярные и скрытые расхождения, используя ваш любимый осциллятор. [ Руководство по установке | Руководство по обновлению | Устранение неполадок | FAQ | Все продукты ] Легко торговать Находит регулярные и скрытые расхождения Поддерживает много известных генераторов Реализует торговые сигналы на основе прорывов Отображает подходящие уровни ст
125 USD
The Relative Cyclicality indicator defines the cycles of any price evolution. This indicator is computed by applying the "Cyclicality" mathematical transformation to the classic Relative Strength Index indicator made by J. Welles Wilder. The Relative Cyclicality defines very good entry and exit trading signals near the minimal and maximal points. It is better than RSI itself due to the unicity of the minimal and maximal points on a specific time interval. The Relative Cyclicality indicator can b
300 USD
The Price Cyclicality indicator defines the cycles of any price evolution. It shows clearly the ascending and descending intervals with asymptotic evolution near the minimal and maximal price values. The Price Cyclicality indicator can be used to generate automated entry signals near the minimal price values. Also, the Price Cyclicality indicator can be used to define limit conditions to generate automated exit signals near the maximal price values. The efficiency of this indicator was proved du
300 USD
Trade system "PAX Multi TMA/HMA 8" for MT5 it is a ready-made trading system for trading on any instrument and any timeframe. An experienced trader on one instrument can get a profit   from 100% to 400% per day . Completely ready for manual trading and use in robots. Not redrawn signals. It is convenient to work on any timeframe. Tested on metals, currency pairs, oil, international stocks, Russian stocks, cryptocurrencies, monetary and cryptocurrency indices. What the trading sy
144 USD
Индикатор позволяет мгновенно определять текущий тренд по цвету и уровням Фибоначчи. Панель HTF показывает текущую тенденцию более высоких периодов, помогая определить силу тренда. Торгуйте по тренду при смене цвета свечей или торгуйте против тренда когда цена пробивает крайние уровни индикатора FIBO Trend PRO Преимущества FIBO Trend PRO Индикатор никогда не перекрашивает и не меняет свои значения Очень простой в использовании и интуитивно понятный Применим к любым символам: FX-валюты, акции, к
75 USD
After working during many months, with the help of Neural Networks, we have perfected the ultimate tool you are going to need for identifying key price levels (Supports and Resistances) and Supply and Demand zones. Perfectly suitable to trigger your trades, set up your future actions, decide your Take Profit and Stop Loss levels, and confirm the market direction. Price will always move between those levels, bouncing or breaking; from one zone to another, all the remaining movements are just mark
79 USD
Другие продукты этого автора
Тип: осциллятор Индикатор схождения/расхождение скользящих средних Gekko (MACD) — это модифицированная версия знаменитого индикатора MACD. Индикатор сочетает стандартный индикатор MACD с различными расчетами сигналов входа и оповещением о потенциальной точке входа. Входные параметры Fast MA Period - период быстрой скользящей средней индикатора MACD (по умолчанию 12); Slow MA Period - - период медленной скользящей средней индикатора MACD (по умолчанию 26); Signal Average Offset Period - период
50 USD
HiLo Activator – один из наиболее популярных индикаторов для определения тренда. Данная версия позволяет настраивать период и цвета. Индикатор также отрисовывает стрелки вверх и вниз при смене тренда, сигнализируя о сильных точках на вход и выход. HiLo хорошо работает с разными периодами в дневном трейдинге. Вы можете легко понять, когда пора покупать или продавать. Индикатор достаточно эффективен и при работе с другими периодами (день, месяц), показывая долгосрочные тренды. Индикатор прост в пр
50 USD
Тип: трендовый Индикатор Parabolic SAR Gekko — это модифицированная версия знаменитого индикатора Parabolic SAR. Индикатор сочетает стандартный индикатор SAR с различными способами оповещения о потенциальной точке входа или выхода. Входные параметры Step: шаг коэффициента ускорения (Acceleration Factor, AF), по умолчанию 0.02. Каждый раз, когда точка экстремума формирует новый минимум или максимум, коэффициент увеличивается на 0.02. AF может достигать значения, не превышающего значение парамет
50 USD
This is Gekko's indicator of quotations and variations. It summarizes quotations and variations of the current symbol in different timeframes as well as other correlated symbols. Keep track of all this information on your chart while you are negotiating for decision making support. Input Parameters General Settings:  configure which quotations and variations you want to keep track for current day, week, month or year as well as M1, M5, M15, M30, H1 and H4 charts; Symbols Configuration: add up to
FREE
Инструменты: валютные пары, фьючерсы и акции. Тип: скальпер, короткие сделки, свинговая торговля, дневная торговля, покупка и удерживание позиции. Описание Советники серии Gekko Jade отличаются универсальностью и располагают более чем 50 входными параметрами, которые можно комбинировать разными способами; Возможны дневная и позиционная торговля; Управление временем торговли; Возможность использования разных типов параметров и стратегий входа/выхода с рынка; Подходит как для новичков, так и про
40 USD
Индикатор индекса относительной силы Gekko — это модифицированная версия знаменитого индикатора RSI. Индикатор сочетает стандартный индикатор RSI с различными расчетами сигналов входа и оповещением о потенциальных точках входа и выхода. Входные параметры Period: период расчета RSI; Метод расчета сигнала входа (свинга): 1 - Генерирует сигналы на выход для свинг-торговли на основе входа и выхода значения RSI из верхней и нижней зоны; 2 - Генерирует сигналы на вход/выход для свинг-торговли на осн
50 USD
Тип: осциллятор Модификация известного индикатора вершин и впадин Gekko. Находите важные вершины и впадины на графике любого символа или таймфрейма на основе набора конфигураций, которые подстраивают индикатор к торгуемому инструменту. Входные параметры Calculate Tops and Bottoms for the past X Bars: количество баров, для которых индикатор будет строить вершины и впадины. Чем меньше значение, тем быстрее скорость работы. At Least Two Bars Making New Highs or Lows to Confirm: true - учитывать н
50 USD
Индикатор Gekko Strong Bars генерирует сигналы при обнаружении сильного бычьего или медвежьего бара. При поиске применяются три условия: 1 - текущий бар выше/ниже последних x баров (x - входной параметр), 2 - размер текущего бара выше среднего размера последних x баров (x - входной параметр) и 3 - у текущего бара короткий хвост (тень). Входные параметры Plot Strong Bar Arrows for the past X Historical Bars: число предыдущих баров для отрисовки индикатора. Чем ниже значение, тем выше быстродейс
50 USD
Известный индикатор Price Lines от Gekko. Исторические ценовые ориентиры (например, самая высокая вершина в году, самая низкая впадина в месяце, цена открытия недели, цена закрытия предыдущего дня и т.д.) обычно являются важными областями поддержки или сопротивления, которые при пробое дают отличные точки входа и выхода. Этот индикатор отображает все эти важные ценовые ориентиры и подает оповещения, когда текущая цена пробивает любой из них. Входные параметры Plot Strong Bar Arrows for the pas
50 USD
his is Gekko's Moving Averages indicator. It extends the use of the famous moving averages and calculates strong entry and exit signals using Price versus a Fast Moving Average versus a Slow Moving Average. You can set it up in many different ways, eg: price crossing, moving averages crossing, moving averages trend, among others. Inputs Number of Bars to Plot Indicator:  number of historical bars to plot the indicator, keep it low for better performance; FAST Moving Average Details: settings f
50 USD
This is Gekko's customizable version of the famous Heiken Ashi indicator. It extends the use of the famous Heiken Ashi and calculates strong entry and exit signals.  Inputs Number of Bars to Plot Indicator:  number of historical bars to plot the indicator, keep it low for better performance; Produce Arrow Signals:  determine if the indicator will plot arrow signal for long/short; Produces Signal Only When a Bar Closes:  wait for a bar to close to produce a signal (more accurate, by delayed entry
50 USD
This is Gekko's Bollinger Bands indicator. It extends the use of the famous Bollinger Bands and calculates strong entry and exit signals using price action on the edge and on the middle bands. You can set it up in many different ways, eg: pullback, pullback against trend, middle band crossing and middle band crossing against trend. Inputs Number of Bars to Plot Indicator:  number of historical bars to plot the indicator, keep it low for better performance; Produces Signal Only When a Bar Closes:
50 USD
This is Gekko's Channels Plus indicator. It extends the use of the famous Channels and calculates strong entry and exit signals using price action on the top, bottom and middle lines. You can set it up in many different ways, eg: pullback, pullback against trend, middle line crossing and middle line crossing against trend. Inputs Number of Bars to Plot Indicator:  number of historical bars to plot the indicator, keep it low for better performance; Produces Signal Only When a Bar Closes:  wait fo
50 USD
Фильтр:
Нет отзывов
Ответ на отзыв
Версия 1.12 2023.02.17
New performance upgrades
Версия 1.11 2018.11.30
Added "Number of Bars to Plot" to gain on performance, reduce this number if you're using the indicator for EA's.