Gekko ADX Plus
- Indicadores
- Rodrigo Galeote
- Versión: 1.12
- Actualizado: 17 febrero 2023
- Activaciones: 5
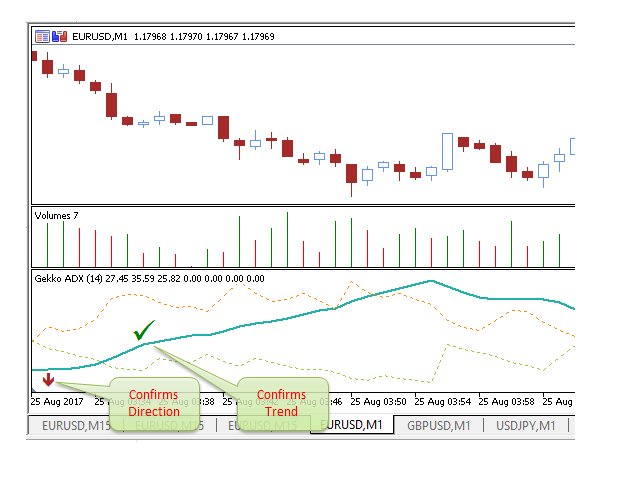
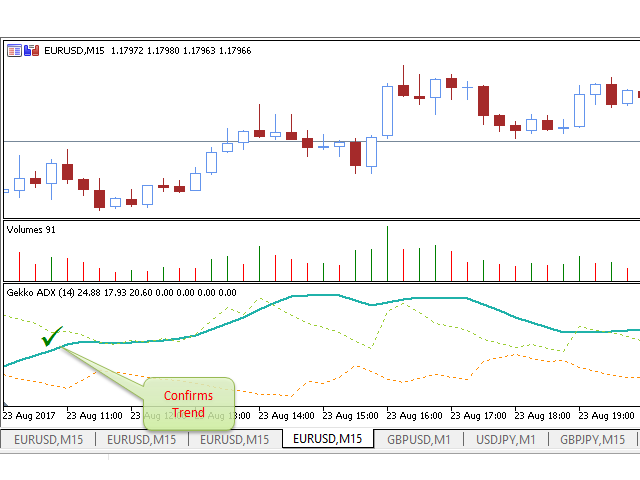
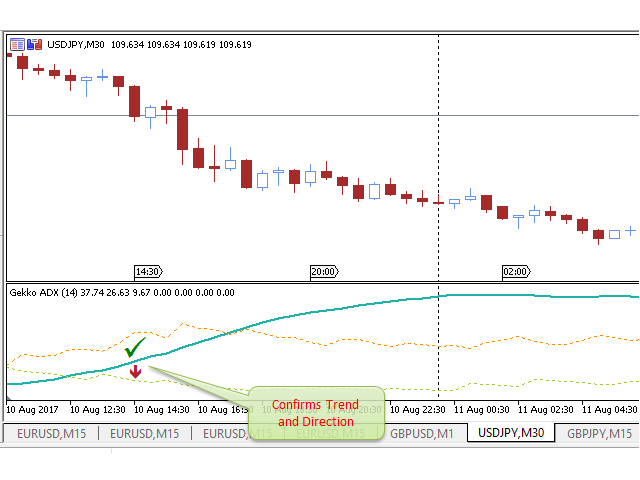
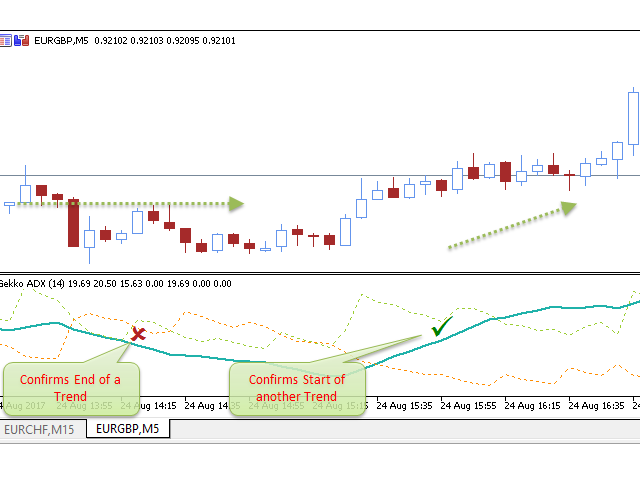
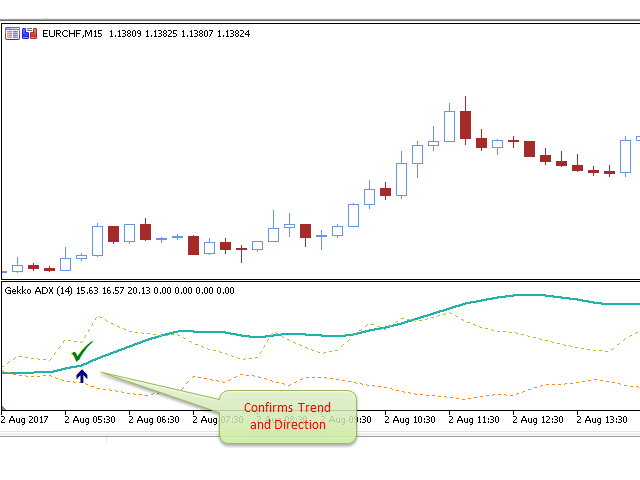
Este es el índice direccional medio personalizado de Gekko (ADX), una versión personalizada del famoso indicador ADX. Use el ADX regular y aproveche tres cálculos de señales de entrada y diferentes formas de recibir alertas cada vez que haya un posible punto de entrada o salida.
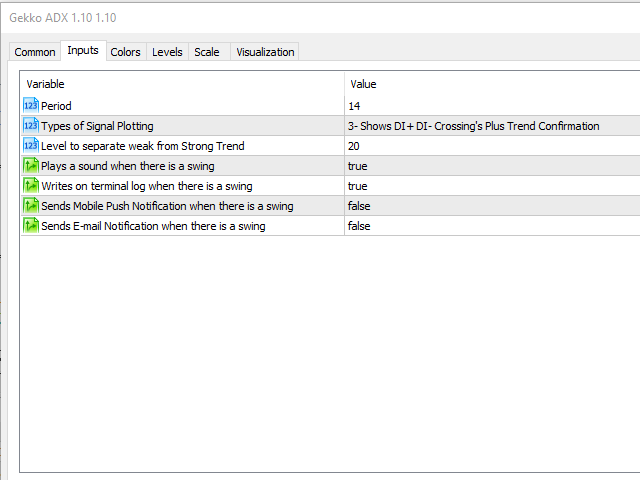
Entradas
- Period: Periodo para el cálculo del ADX;
- PlotSignalType: Cómo el indicador calculará las señales de entrada (oscilación):
- 1- ShowSwingsOnTrendLevel: Mostrar señales para los cambios de confirmación de tendencia;
- 2- ShowSwingsOnTrendLevelDirection: Muestra señales para los cambios de confirmación de tendencia más la dirección de entrada (alta o baja);
- 3- ShowSwingsOnPosAndNegDI: Muestra las señales de entrada / salida (alta o baja) basadas en el cruce entre DI+ y de DI- más la confirmación de tendencia;
- Trend Level: El nivel utilizado para confirmar una formación de Tendencia.
- Plays a sound when there is a swing: ponlo como true y el indicador emitirá un sonido en el terminal MetaTrader cada vez que se produzca una nueva señal que indique puntos de entrada o salida.
- Write Logs On Terminal Window: ponlo como true si deseas que el indicador escriba registros en la pestaña Experts de la terminal cada vez que se produzca una nueva señal que indique puntos de entrada o salida
- Send Mobile Push Notifications: ponlo como true si deseas recibir notificaciones push en la aplicación MetaTrader en su teléfono móvil cada vez que se produzca una nueva señal que indica puntos de entrada o salida.
- Send E-Mail Alerts: ponlo como true si deseas recibir alertas por correo electrónico en la dirección de correo electrónico configurada en el terminal cada vez que se produzca una nueva señal que indica puntos de entrada o salida;
¡Buenas Negociaciones!
Done parte de sus ganancias a buenas causas y entidades humanitarias de su elección. "El dinero solo viene si hay un propósito para que lo ganes".