Trade Excursion Analyzer
- Утилиты
-
Mohamed-amine Baddir
 Я создаю Expert Advisors для MetaTrader 5 и тщательно тестирую их перед тем, как вы начнёте ими торговать.
Что я делаю:
- Превращаю вашу торговую стратегию, скрипт TradingView или письменные правила в чистый Expert Advisor для MT5 - Версия: 1.0
- Активации: 5
Trade Excursion Analyzer measures how far every closed trade went against you (maximum adverse excursion, MAE) and in your favour (maximum favorable excursion, MFE) before it closed. It reads saved Strategy Tester reports or the history of your account, measures each trade on the price history of your terminal and writes one HTML page: where your stop-loss could be, how much open profit your exits give back, and what a fixed stop-loss or take-profit would have changed.
How To Use
- Backtests: in the Strategy Tester, right click on the Backtest tab > Report > save it as HTML into MQL5\Files\TradeExcursion (File > Open Data Folder).
- Live or demo trading: set "Trades to analyse" to the history of this account; filter by magic number and symbol if needed.
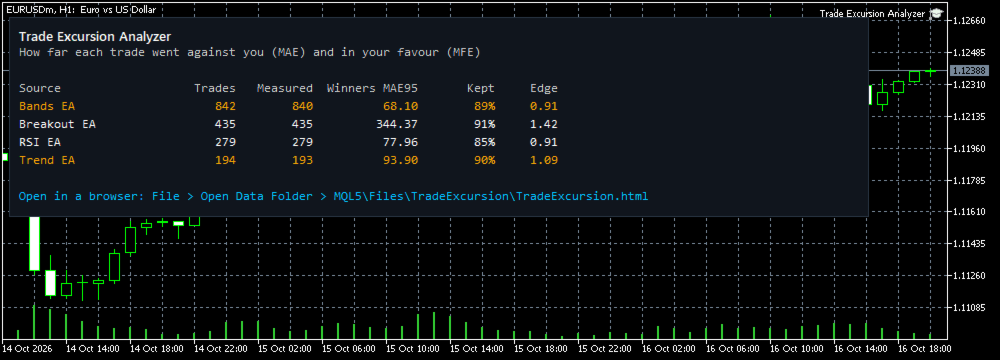
- Attach Trade Excursion Analyzer to any chart. Open MQL5\Files\TradeExcursion\TradeExcursion.html in any browser. The main figures are also shown on the chart.
What The Page Shows
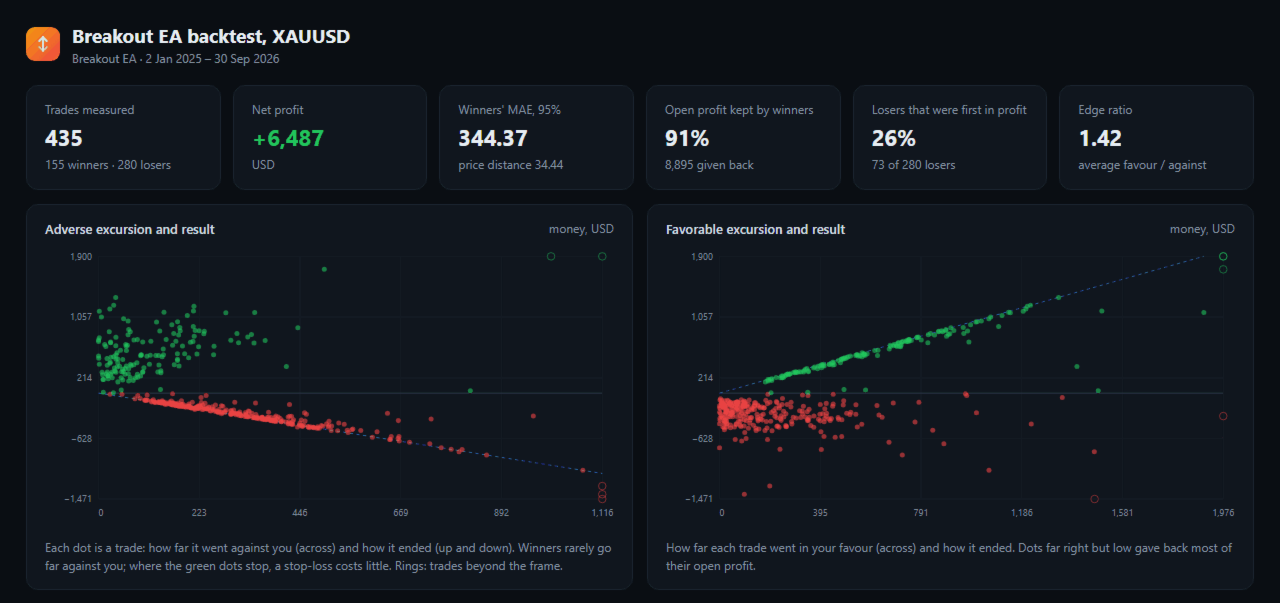
- Adverse excursion against result for every trade: winners that never went far against you show where a stop-loss costs little.
- Favorable excursion against result: trades that were far in profit and closed low.
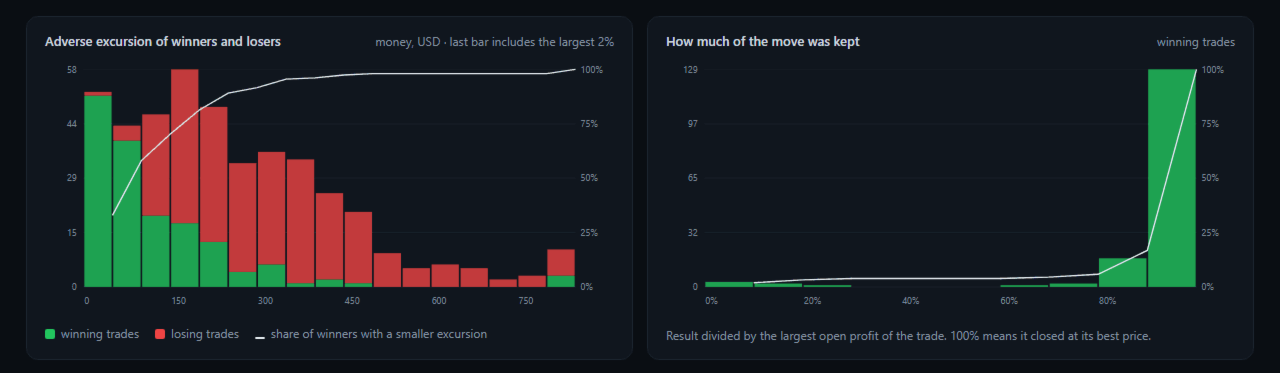
- Distribution of the adverse excursion of winners and losers, with the share of winners below each level.
- How much of the best open profit each winner kept, and the total given back.
- Losers that were first in profit by at least their final loss.
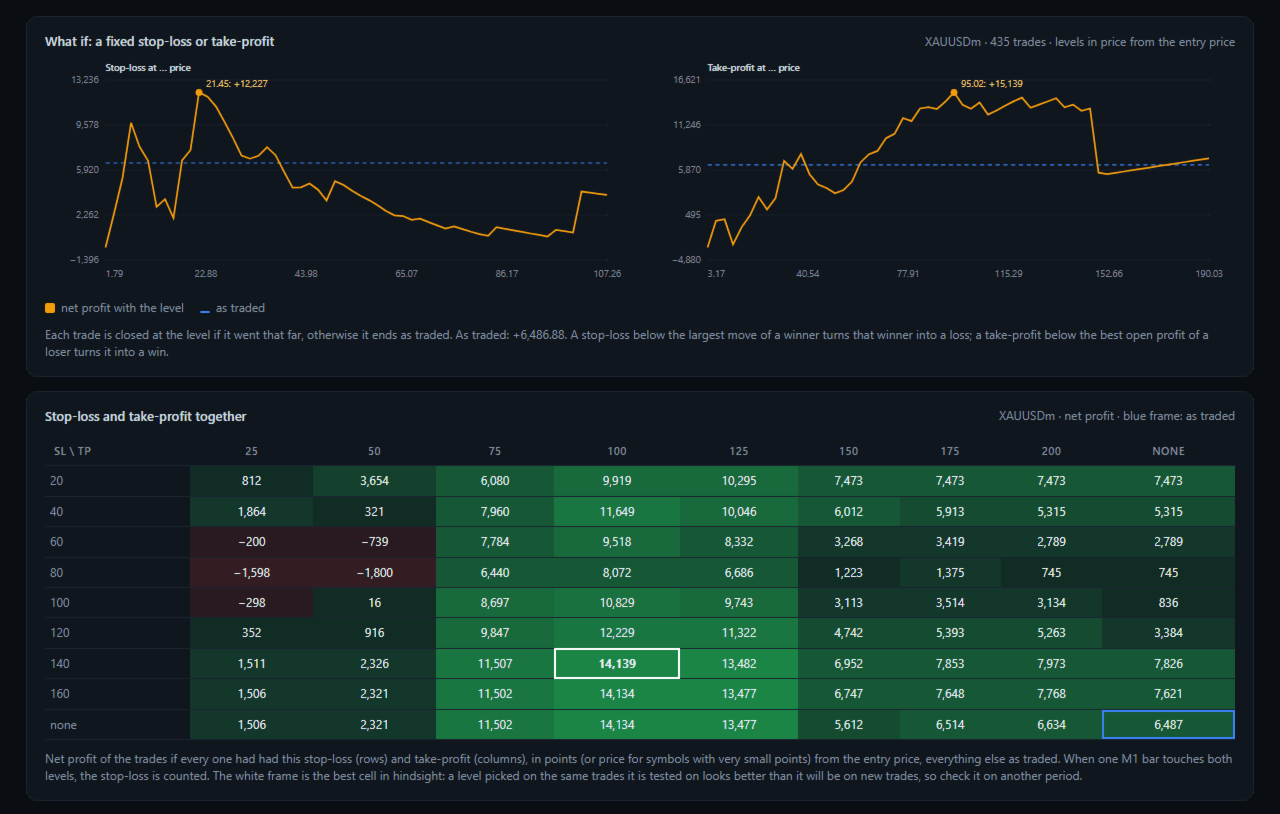
- Net profit with a fixed stop-loss at every level, and with a fixed take-profit at every level.
- A table of stop-loss and take-profit together, with the result as traded marked.
- The trades with the largest moves against them and the most open profit given back.
- A choice of report and symbol at the top of the page.
How It Is Measured
- Buys are measured on the bid, sells on the ask, from the entry price.
- Sells are measured on every tick when your terminal has the ticks, because bars do not hold the ask.
- The minutes of entry and exit are measured on ticks, so prices before the entry or after the exit are not counted.
- Where M1 history does not reach (Max bars in chart), M5, M15 or H1 bars are used and the page says how many trades were measured each way.
- Checked against a test Expert Advisor that recorded its own excursions on every tick: 102 trades out of 102 identical, buys and sells.
- Checked the stop-loss and take-profit table against a real test with those levels: the same 40 stops, 8 targets and 206 other exits. The net profit differed only by the slippage of the stop orders of that test.
Inputs
- Trades to analyse: saved Strategy Tester reports, or the history of this account
- Folder in MQL5\Files with the saved reports, or the report files separated by ;
- Folder in the common Files folder of all terminals
- Account history: from date, magic number, symbol
- Use ticks for the entry and exit minutes
- Symbol names, report=terminal (e.g. XAUUSD=GOLD), for reports made with another broker
- Page title
Good To Know
- The excursions use the prices of your terminal. For exact figures, analyse a report on the same broker server as the test.
- The stop-loss and take-profit results are hindsight: a level chosen on the same trades looks better than it will on new trades. Check it on another period.
- Up to 12 reports and 20,000 trades at once. The page is one file with no internet access needed.
- The demo runs in the Strategy Tester: put saved reports into the common folder Files\TradeExcursion (File > Open Common Data Folder); the page is written when the test ends. Use the 1 minute OHLC or tick model so the history of the report's symbols is available.
- The utility reads files and history only. It does not trade and does not change any setting.
- The screenshots show tests of example strategies. They show the page, not trading results to expect.