
Autofib Zone
- Индикаторы
- Версия: 1.70
- Обновлено: 5 августа 2026

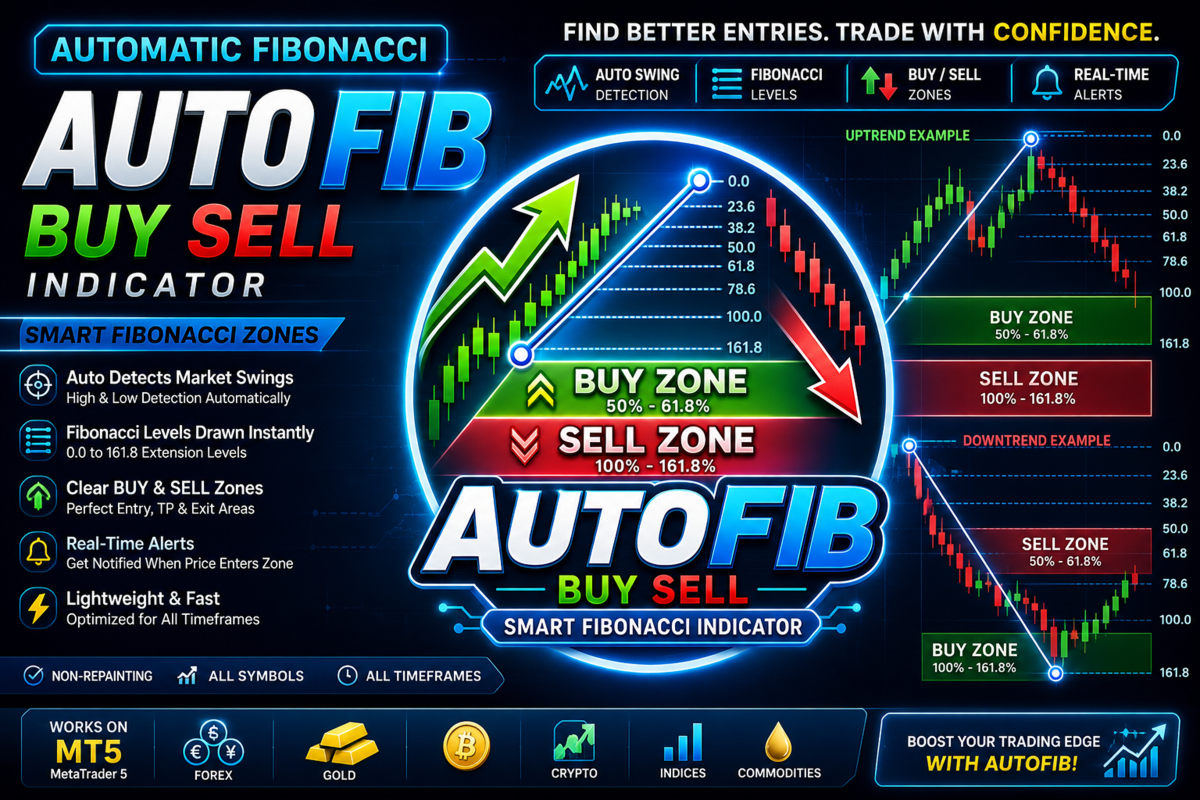
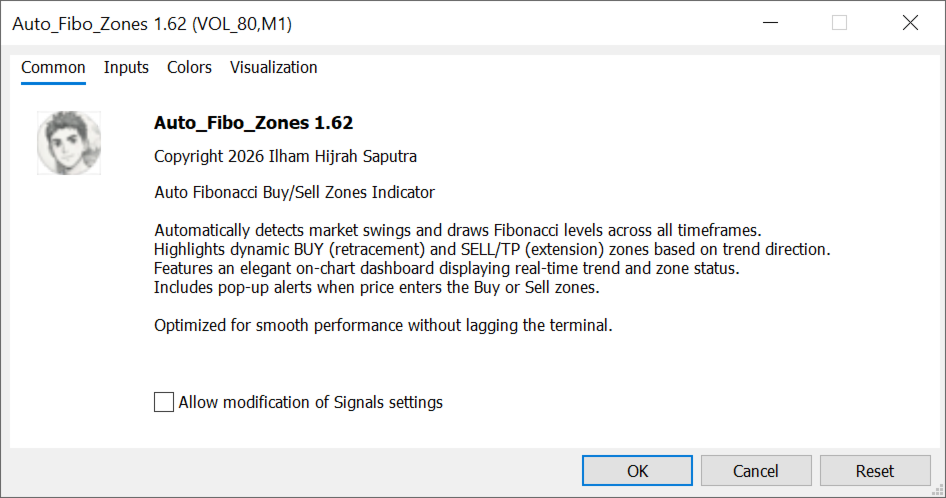
Auto Fibonacci Buy/Sell Zones is a powerful, 100% automated trading indicator designed for MetaTrader 5. It eliminates the hassle of manually drawing Fibonacci levels by instantly detecting market swings and projecting dynamic Buy and Sell zones directly onto your chart.
Whether you are a scalper, day trader, or swing trader, this indicator adapts seamlessly to any financial instrument (Forex, Crypto, Indices, Commodities) and works perfectly across all timeframes.
🌟 Key Advantages & Features
- 100% Fully Automatic: No manual drawing required. The indicator automatically scans historical data to find the Highest High and Lowest Low, dynamically updating as new market swings form.
- Smart Trend Detection: Automatically identifies whether the market is in an Uptrend or Downtrend. It intelligently places Fibonacci retracement zones for entry and extension zones for Take Profit (TP).
- Dynamic Buy/Sell Zones:
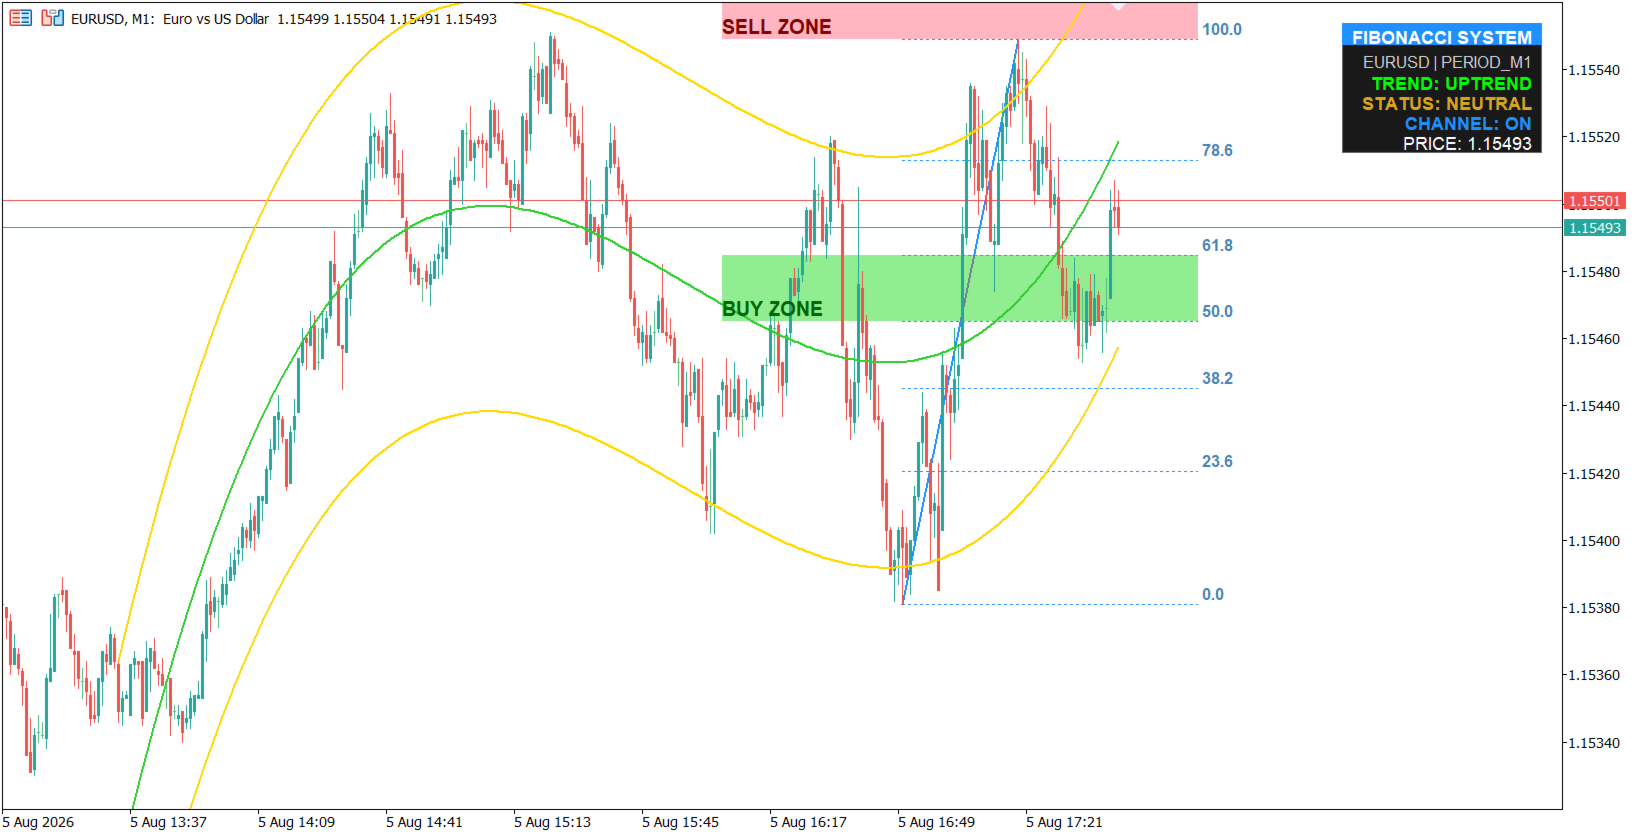
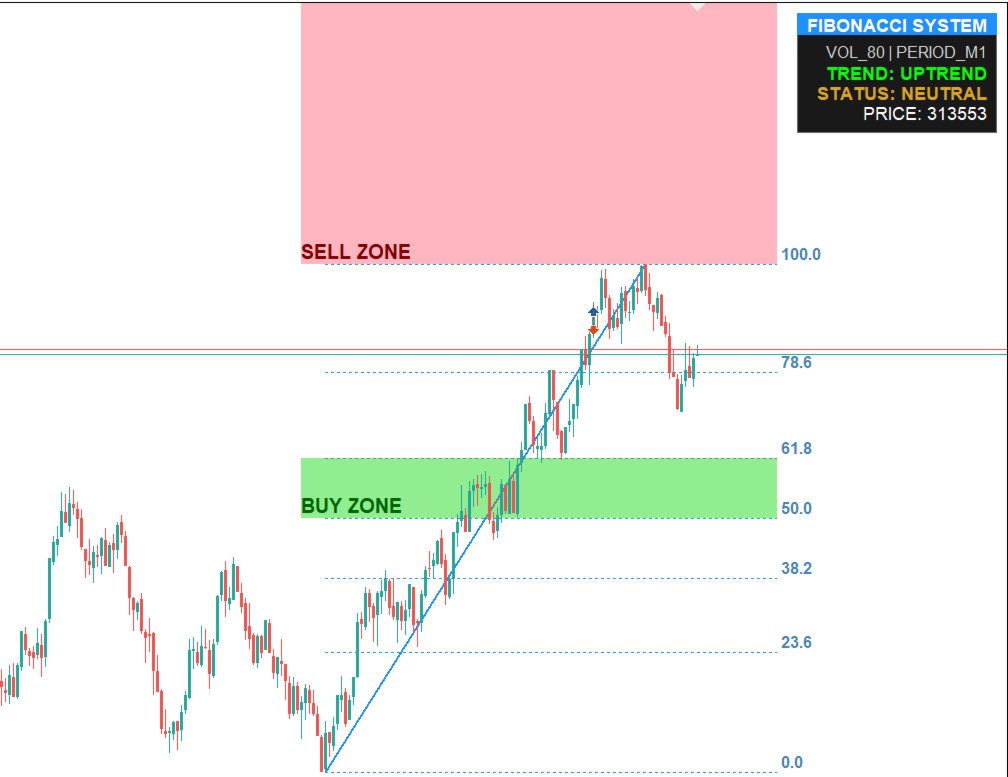
- Uptrend: Highlights a "BUY ZONE" at the 50.0%–61.8% retracement levels (optimal pullback entries) and a "SELL ZONE / TP" at the 100.0%–161.8% extension levels.
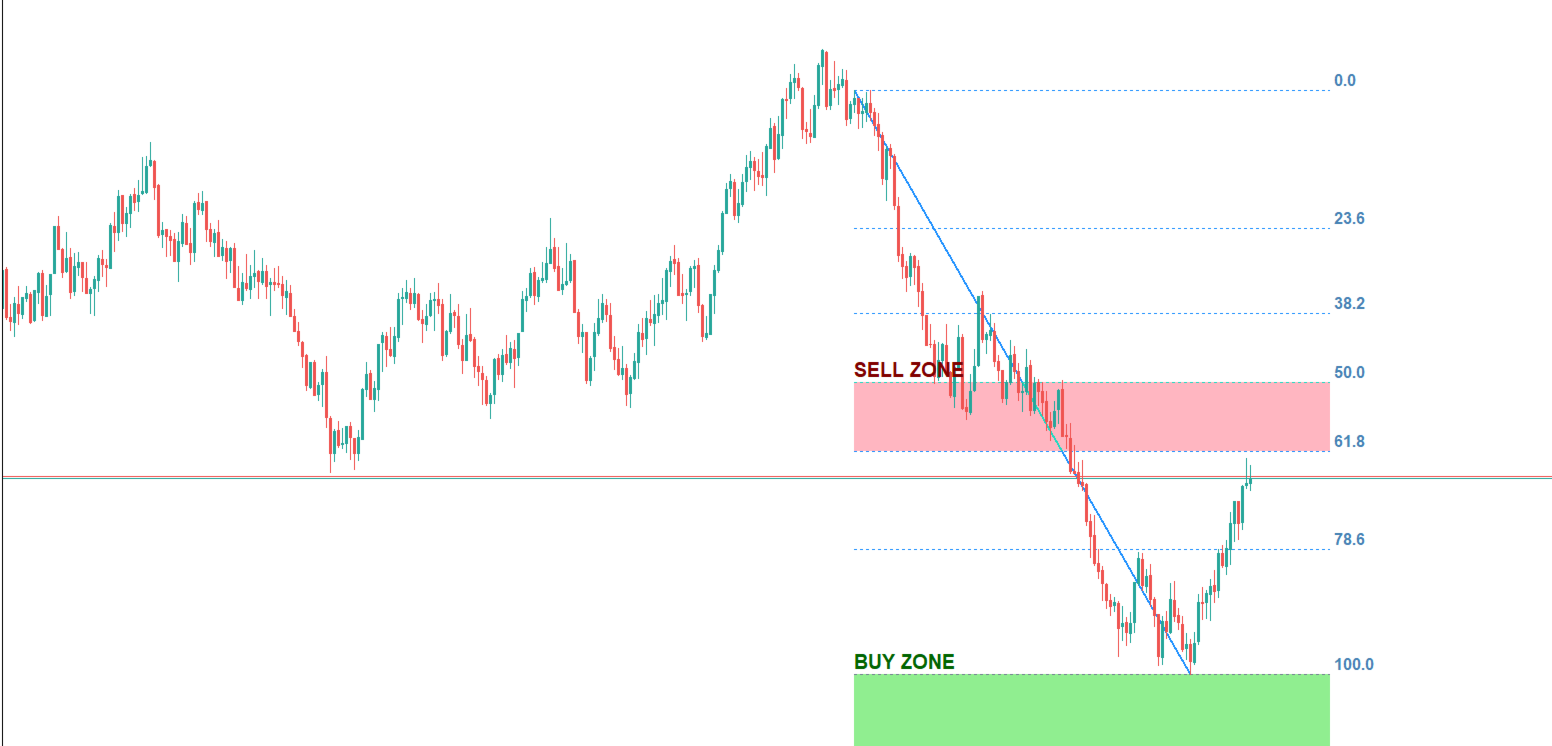
- Downtrend: Highlights a "SELL ZONE" at the 50.0%–61.8% retracement levels and a "BUY ZONE / TP" at the 100.0%–161.8% extension levels.
- Elegant On-Chart Dashboard: A clean, non-intrusive dashboard located at the top right corner displays real-time data, including Symbol, Timeframe, Current Trend Direction, Active Zone Status (Buy/Sell/Neutral), and Live Price.
- Built-in Alert System: Never miss a trading opportunity. The indicator triggers a pop-up alert with a sound notification the moment the price enters the designated Buy or Sell zone. (Alerts are smartly coded to trigger only once per zone to prevent spam).
- Universal Compatibility: Works flawlessly on M1, M5, M15, H1, H4, D1, and all other timeframes.
- Lag-Free Optimization: Coded with performance in mind. It uses optimized object-handling functions to update chart drawings instantly without slowing down your MT5 terminal.
⚙️ Input Parameters
Customize the indicator to fit your trading style using the following inputs:
Fibonacci Settings:
- Detection Period (InpLookback) - The number of candles used to scan for the Highest High and Lowest Low. (Default: 100). Auto-adjusts to the selected timeframe.
- Fibonacci Line Color (InpFibColor) - Color of the main Fibonacci trendline and horizontal level lines. (Default: DodgerBlue)
- Level Text Color (InpTextColor) - Color of the text labels for Fibonacci levels (e.g., 61.8%, 100%). (Default: SteelBlue)
Zone Settings:
- BUY Area Color (InpBuyColor) - The fill color for the designated Buy/Entry zone. (Default: LightGreen)
- SELL Area Color (InpSellColor) - The fill color for the designated Sell/TP zone. (Default: LightPink)
Alert Settings:
- Enable Buy/Sell Alerts (InpAlerts) - Turn Pop-up alerts ON or OFF when price enters a Buy/Sell zone. (Default: true)
Dashboard Settings:
- Show Dashboard (InpShowDashboard) - Toggle the on-chart info dashboard ON or OFF. (Default: true)
- Dashboard Background Color (InpDashBgColor) - Background color of the dashboard body. (Default: Dark Gray)
- Dashboard Header Color (InpDashHeaderColor) - Background color of the dashboard top header. (Default: DodgerBlue)
📖 How to Use
- Trend Confirmation: Look at the dashboard to see if the trend is UPTREND or DOWNTREND.
- Wait for the Zone: Do not trade immediately. Wait for the price to retrace into the highlighted BUY ZONE (in an uptrend) or SELL ZONE (in a downtrend).
- Entry: Once the price enters the zone (or when the alert sounds), look for your preferred candlestick confirmation (e.g., Pin Bar, Engulfing) to enter the trade.
- Take Profit: Set your Take Profit targets at the opposite zone (the 100% - 161.8% extension area).
⚠️ Disclaimer
Risk Warning: Trading in the financial markets involves a high level of risk and may not be suitable for all investors. Past performance is not indicative of future results. The Auto Fibonacci Buy/Sell Zones indicator is a technical analysis tool designed to assist traders in visualizing market structure and potential reversal zones. It does not guarantee profitable trades.
No Investment Advice: The information and features provided by this indicator are for educational and informational purposes only and should not be construed as financial or investment advice. Always conduct your own analysis and seek advice from an independent financial advisor before making any trading decisions. The developer (Ilham Hijrah Saputra) holds no responsibility for any financial losses or damages incurred while using this software. Use this tool at your own discretion and risk.






































Пользователь не оставил комментарий к оценке