SMC Inducement
- Индикаторы
-
Minh Truong Pham
 Hello, my name is Pham and I am a programmer and trader! At here, I create amazing forex indicators and expert advisors for Metatrader.
I will try:
+ Provide best tools base on my 5 years experience as a trader and 10 years as a programmer. - Версия: 1.0
- Активации: 20
An inducement scanner that shows you the liquidity price has to take before the zone is worth trading — and keeps score of every setup it ever found on your chart.
The pullback you are looking at is usually the bait
Structure breaks. A clean order block is left behind. You mark it, price comes back, you enter at the top of the zone — and price runs twenty pips past your stop before turning around and going exactly where you thought it would.
Nothing was wrong with your zone. What was wrong was the timing. Between the pullback low and the break of structure there is almost always a small, obvious low sitting in plain sight, and every trader watching that chart has an order under it. That low is not support. It is fuel. Price is going to take it, and only then is the zone behind it worth anything.
Most structure indicators never draw that low. They mark the order block, extend it forward, and leave you to guess whether the tap you are watching is the real one or the one that exists purely to collect your stop.
SMC Inducement draws it. The structure, the break, the inducement, the zone and the levels are all marked as one object, the entry is only recognised after the inducement has actually been taken, and a panel in the corner tallies every setup on the chart in front of you — your symbol, your broker's history, your settings.
What it draws, and how to read it
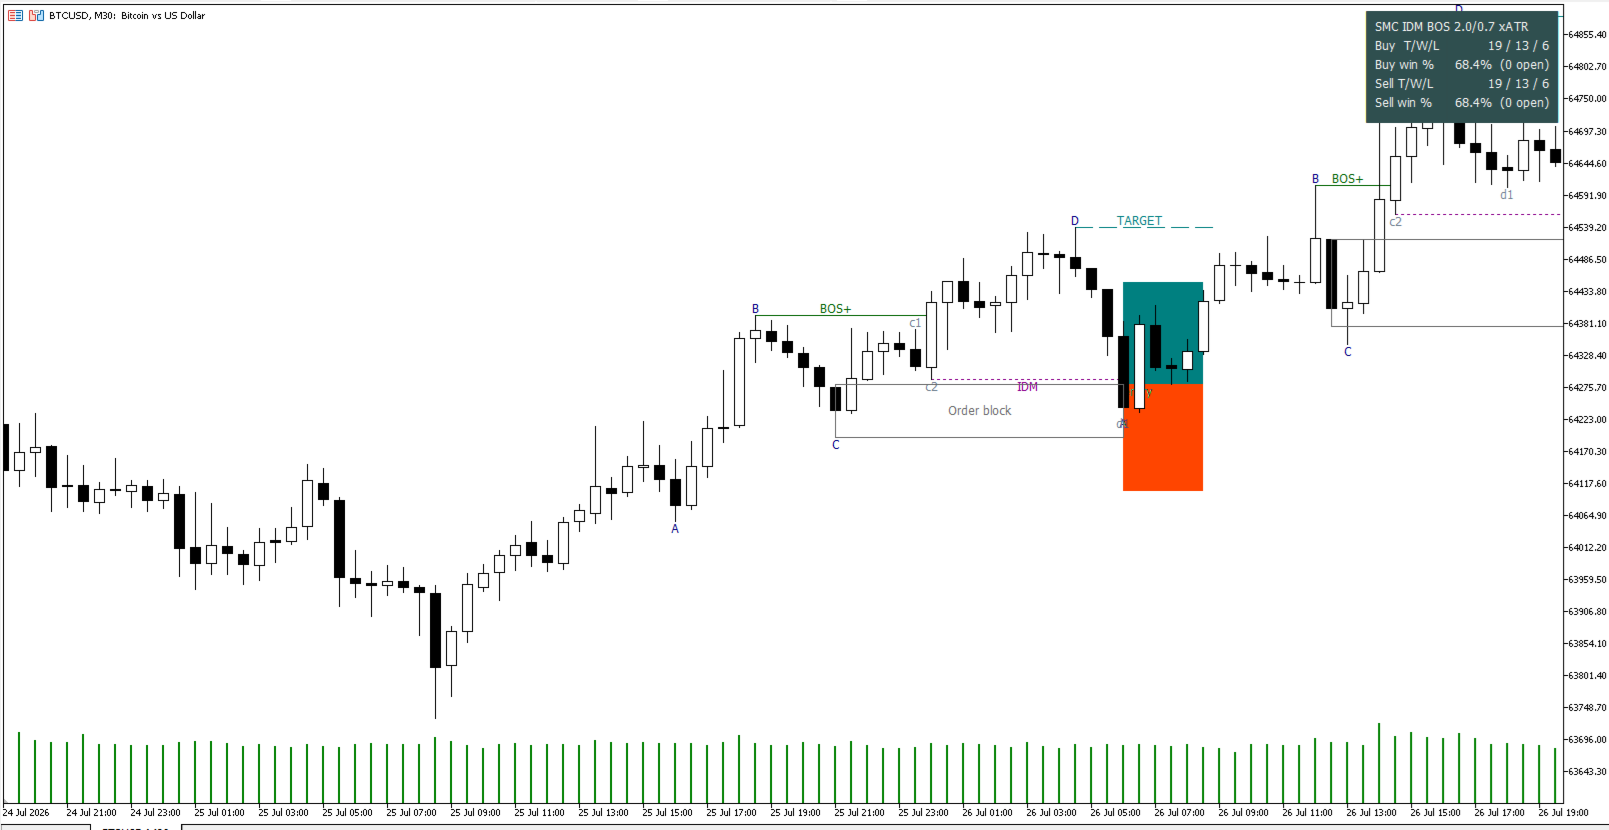
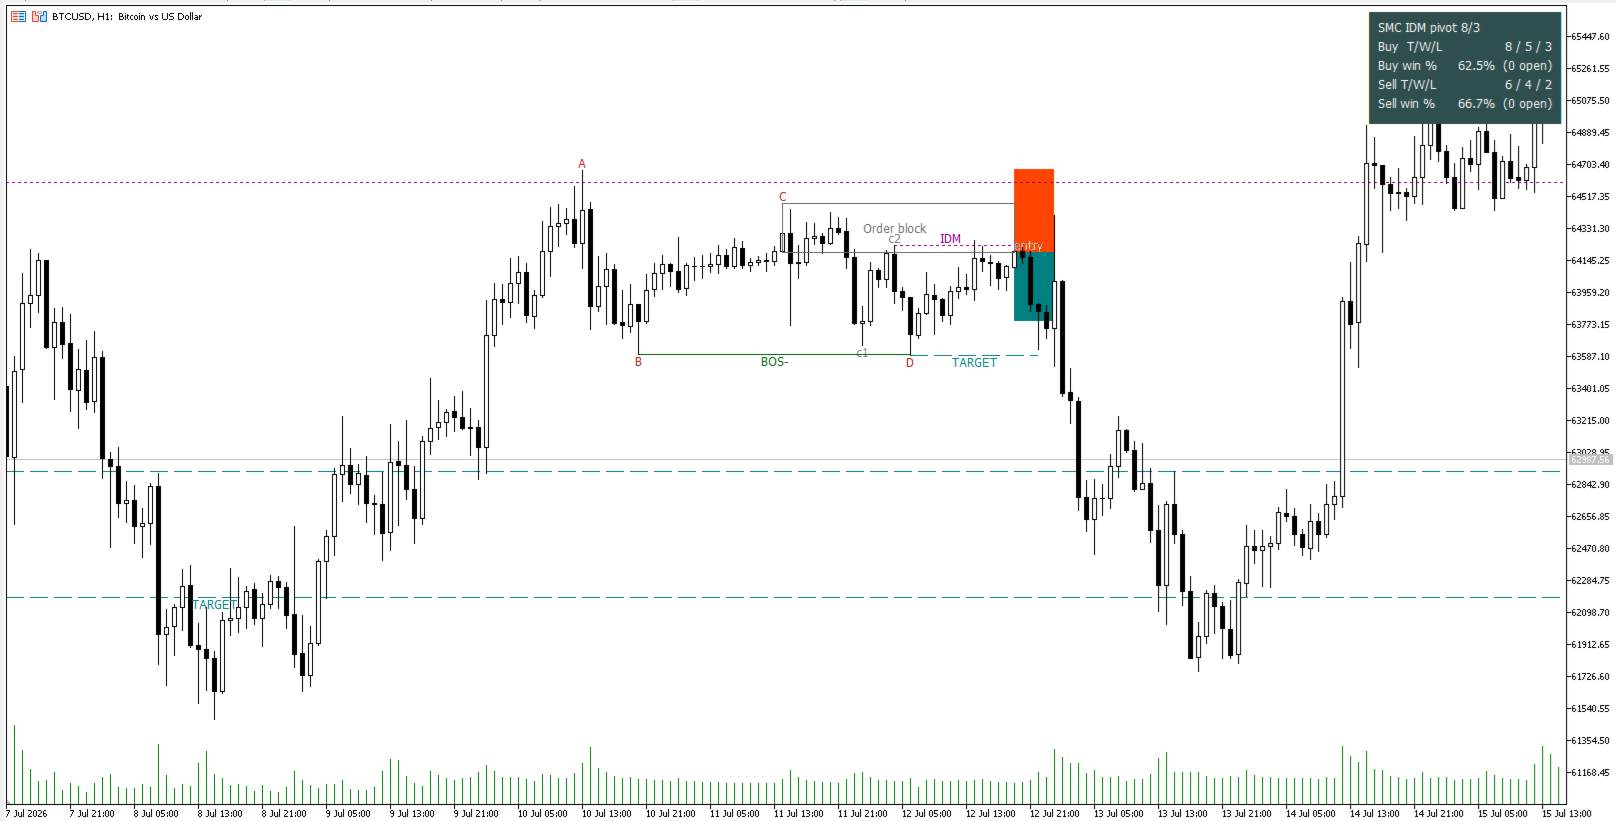
The indicator marks the pattern in both directions. Uppercase labels come from the main structure; lowercase labels come from a second, finer swing scale that exists purely to expose the small moves inside it.
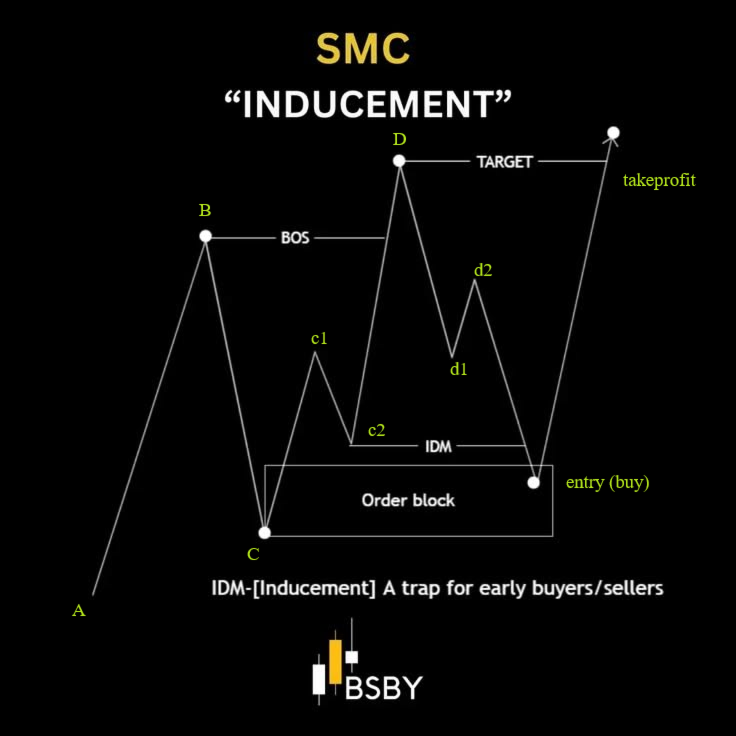
Reading a bullish setup left to right:
| Label | What it is |
|---|---|
| A | the low the leg starts from |
| B | the structure high that is going to be broken |
| C | the pullback low that holds the order block |
| c1 | the minor high inside the leg away from C |
| c2 | the minor low after it — this is the inducement |
| BOS | the horizontal line from B to the bar that broke it |
| D | the new high after the break — the TARGET line |
| d1 / d2 | the minor low and high that shape the retracement from D |
| entry | price sweeps c2, taps the order block at C, and the levels appear |
A bearish setup is the exact mirror, top to bottom.
The chart tells this story in three stages.
Stage one — the structure appears. As soon as the swing at D is confirmed, the whole picture is drawn at once: the labels, the BOS line marking where structure actually broke, the dotted IDM line running forward from the inducement, the dashed TARGET line at D, and the order block at C boxed and extended to the right in the "waiting" colour. Nothing has happened yet, and the chart says so.
Stage two — price comes back. When price returns, takes the inducement, and trades into the block while the block is still alive, the entry label is placed at the near edge of the zone and two boxes are drawn from it — one to the stop loss, one to the take profit. The zone box stops at the entry bar and changes colour. If price never comes back, the pattern stays at stage one forever; no entry is invented to make the picture look complete.
Stage three — the retracement fills in. The minor points d1 and d2 are added once the pullback has shaped them, and d2 is only labelled while it stays inside D. If the retracement does not have that shape, the labels are simply left off rather than forced on.
The visual language stays small on purpose: labels for structure, three horizontal levels, one box for the zone, two boxes for risk and reward. No arrows, no clouds, no repainted candles.
The inducement is the entry condition, not a decoration
Drawing the trap is the easy half. The half that changes results is refusing to call anything an entry until the trap has been sprung.
By default the indicator requires the inducement to be taken first. Price reaching the zone without having swept c2 is not an entry — it is price arriving early, which is exactly the sequence that produces the stop-hunt you have been eating. Both halves of the rule are switchable: you can require an inducement to exist at all before a pattern is accepted, and you can require it to be swept before an entry is recognised. Turn both off and you get the plain order-block behaviour, which makes the difference easy to measure on the statistics panel.
The inducement also has to be a genuine one. A minor low that sits below C is not a pullback inside the leg — it is a break of it, and the pattern is rejected rather than stretched to fit.
Two detection engines. Switch between them with one dropdown.
There is no universally correct way to decide what counts as a swing, and that choice changes everything downstream. So the indicator ships with two independent structure engines and one parameter to select between them.
Engine 1 — bar-based. A swing must stand clear of a fixed number of bars on each side. Familiar, predictable, easy to reason about. Its weakness is that it measures structure in bars: the same market move is recognised when it develops slowly and missed when it develops quickly. In this engine the break of B is judged by price alone.
Engine 2 — volatility-based (default). A swing is confirmed when price retraces against it by a configurable multiple of current market volatility. Nothing is measured in bars, so one setting travels between a fast metal and a slow currency pair without re-tuning. This engine also validates the structure differently and more strictly:
- The break of B must be a genuine close beyond it, recorded before D forms. A long wick through the high that closes back underneath is not a break — and a large class of false structures disappears with it.
- The chain is explicitly invalidated: if price closes beyond A before D is reached, the whole setup is discarded instead of being counted.
Both engines feed the identical downstream logic — same inducement rule, same order block, same entry, same levels, same statistics. That is the entire point. Flipping the dropdown changes only how structure is read, so the panel gives you a like-for-like comparison of the two engines on your own instrument. Most users find one clearly suits their market better than the other, and now they can prove which.
Each engine carries its own sensitivity for the major structure and for the minor swings that expose the inducement, so you can read big structure while still seeing the small low inside it.
Zones that know when they are dead
An order block is liquidity, and liquidity only matters while price has not traded through it.
Every zone here is an object with a lifetime. It stays valid until a candle closes beyond it — never merely wicks beyond it. A wick that pierces the zone and closes back inside leaves the block alive, which is exactly right: reaching for liquidity and failing to hold there is a signal, not an invalidation.
When a zone dies it is not faded or left as decoration. If the block was invalidated before it ever produced an entry, the whole pattern is discarded — off the chart and out of the statistics. Setups that never became tradeable do not get to flatter the numbers.
The same discipline applies to the levels. The stop is pushed outside the zone, away from the entry, so the position has room to breathe. The target is pulled inside D, towards the entry, so profit is taken before price is required to break the prior extreme. Both offsets are calibrated to market volatility at the entry bar, and both are configurable. If the geometry leaves no room between entry and target, the setup is dropped rather than reported as a trade that won at the moment it opened.
The statistics panel — verify the idea on your own chart
A compact panel sits in the corner and shows, separately for buys and sells:
- Total / Won / Lost — every pattern that actually produced an entry
- Win rate
Two things matter more than the numbers themselves.
They are computed on your chart. Your symbol, your broker's history, your timeframe, your settings. Change the engine, change the swing sensitivity, switch the inducement requirement off and on, move the stop and target multiples — the panel recalculates. You are not being asked to believe someone else's screenshot.
They are deliberately conservative. A pattern only counts once price returned and an entry existed. A bar that touches both the stop and the target is recorded as a loss, because the indicator cannot know which came first and the pessimistic reading is the honest one. Patterns whose zone died before an entry are removed from the sample entirely rather than counted as losses avoided.
Read the panel for what it is: a fast, close-only historical tally that ignores spread, commission, slippage and execution quality. It is a research tool for comparing settings against each other — not a broker statement.
Keep the chart to what is still tradeable
History is useful for judging the concept and terrible for trading in front of. One switch — Draw only the newest pattern plus every waiting one — reduces the chart to the setups you can still act on: the most recent structure in each direction, plus every pattern whose zone is alive and still waiting for price.
The statistics do not change. The filter affects drawing only; the panel keeps scoring the full history behind it. You get a clean chart and an honest sample at the same time, which is normally a trade-off you are forced to make.
Alerts that respect your attention
Two alert modes, selectable:
Touch — fires the moment price trades into the zone, evaluated on every tick. Use this when you want to be at the chart while the zone is being tested.
Bar close — fires only when a bar closes, and only if that bar reached into the zone without closing beyond it. A wick through the block that closes back inside still qualifies. This is the filtered mode: it stays quiet when price is slicing straight through and speaks when the zone actually produced a reaction.
In both modes the alert follows the setup that is still waiting, not one that has already played out, and where the inducement rule is active the alert waits for the sweep as well. At most one alert per bar per direction. Loading the indicator, switching timeframes or restarting the terminal never replays historical signals — the first calculation pass runs silently by design. Delivery can be a terminal pop-up, a mobile push notification, e-mail, or Telegram.
Symbols, timeframes and presentation
Any symbol, any timeframe. No hard-coded instrument, no hard-coded session. With the volatility-based engine there is no bar-count parameter to re-tune when you change market.
Attach it to the chart you want to read. The indicator does not quietly pull other timeframes behind your back; everything you see is computed from the chart it is on. Want higher-timeframe context? Attach a second copy to a higher-timeframe chart — object names are made unique automatically, so instances never collide.
Light and Dark themes built in. Pick the preset that matches your chart and every colour is set for you, including a statistics panel deliberately styled to contrast with your background so it stays readable, and sized from the text it holds so nothing is ever clipped. Prefer your own palette? Switch the theme to Custom and every colour becomes editable.
What to expect — honest talk
This is an analysis tool, not a trading system. It marks structure, the inducement, the zone and the levels. It does not open, modify or close orders, and it makes no claim about what you should do with the information.
Not every pattern produces a trade. Price frequently never comes back, or comes back without ever taking the inducement. That is normal, and it is visible: those patterns stay at stage one instead of being quietly converted into signals.
The structure appears after its final swing is confirmed, not at the exact high or low. Every honest structure reading has this delay — a swing is not a swing until price has moved away from it. What the indicator guarantees is that it never looks into the future: the entry is only ever searched for on bars after the pattern became visible, so what you see on history is what you would have seen live.
Settings matter, and the right ones depend on your market. Swing sensitivity is the parameter that moves results the most, and the minor sensitivity decides whether the inducement you see is the one you meant. Loosen them and you catch only large structures; tighten them and you catch many more, with more noise. Use the panel to find the balance on your instrument instead of assuming the defaults are optimal for you.
Past performance does not guarantee future results. The panel describes what happened on historical data under simplified assumptions. It is not a forecast and it is not investment advice.
Run it on a demo chart for a couple of weeks before you rely on it. Watch how the zones and the sweeps behave on your symbol. That is the only test that counts.
Quick setup
- Attach SMC Inducement to the chart you want to read — any symbol, any timeframe.
- Pick your Colour theme: Light for a white background, Dark for a dark one.
- Leave Detection method on the default volatility-based engine to start.
- Watch the panel and adjust the major swing threshold until the number of patterns on your chart looks reasonable, then the minor threshold until the inducement lands where your eye says it should.
- Turn on Draw only the newest pattern plus every waiting one once you are done exploring history.
- Set Alert mode and Alert channel if you want to be told when price reaches a zone.
Main parameters
| Parameter | Default | Description |
|---|---|---|
| Detection method | Volatility-based | Which structure engine is active. Switch to compare the two. |
| Major swing threshold | 2.0 | Volatility multiple a retracement must reach to confirm a main swing. The primary sensitivity control. |
| Minor swing threshold | 0.7 | Same idea for the finer scale that exposes the inducement. |
| Major / minor pivot length | 8 / 3 | Bars required each side of a swing — used only by the bar-based engine. |
| An inducement is required | On | Reject structures that never left a trap behind. |
| Entry only after the sweep | On | The inducement must be taken before a tap into the zone counts. |
| Detect BUY / SELL patterns | On / On | Enable each direction independently. |
| Patterns drawn per direction | 3 | How many recent patterns stay on the chart. |
| Draw only newest + waiting | Off | Chart shows only what is still actionable. Statistics still cover the full history. |
| Bars to calculate | 3000 | History depth. Raise it for a larger statistical sample. |
| Stop loss offset | 1.0 | How far outside the zone the stop sits, in volatility multiples. |
| Take profit offset | 1.0 | How far inside the target extreme the take profit sits, in volatility multiples. |
| Points may be non-adjacent | Off | Allows minor swings to sit inside the structure. Turn on to detect more patterns. |
| Colour theme | Light | Light, Dark, or Custom. |
| Alert mode | On bar close | Off, on touch, or on bar close. |
| Alert channel | Terminal alert | Terminal, mobile push, e-mail, or Telegram. |
| Object name tag | (auto) | Leave empty for automatic uniqueness across multiple instances. |
Everything else is presentation: fonts, individual colours, panel position and offsets.