• Тип индикатора
  • Цена
     - 
  • Сбросить
Смотри обучающее видео по маркету на YouTube
Как купить торгового робота или индикатор
Запусти робота на
виртуальном хостинге
Протестируй индикатор/робота перед покупкой
Хочешь зарабатывать в Маркете?
Как подать продукт, чтобы его покупали

Технические индикаторы для MetaTrader 5 - 6

icon На основании сигналов технических индикаторов принимаются решения относительно открытия или закрытия сделки на фондовом и форекс-рынках. Суть индикаторов заключается в математическом преобразовании цены и/или объемов финансового инструмента для прогнозирования изменений цен в будущем. Протестируйте технические индикаторы, чтобы лучше предсказывать поведение рынка и зарабатывать на этом.
Индикатор индекс относительной силы (RSI - Relative Strength Index) с динамическими уровнями зон перекупленности и перепроданности. Динамические уровни изменяются и подстраиваются под текущие изменения индикатора и цены, и представляют собой своеобразный канал. Настройки индикатора period_RSI - Период усреднения для вычисления индекса RSI. applied_RSI - Используемая цена.Может быть любой из ценовых констант: PRICE_CLOSE - Цена закрытия, PRICE_OPEN - Цена открытия, PRICE_HIGH - Максимальная за
FREE
RSI Entry Points is the upgrade of the standard RSI indicator to avoid lagging. Indicator draws the clouds and the arrows to have clear picture where price is and what to wait for. Why standard RSI is lagging? because mostly we do not use it correctly and it is with very weak visual flexibility, less informativity. With my current upgrade I tried to Fix both problems same time and I got much better results and more exact entries than standard RSI has. To make yourself sure check out the screens
This is diamond! Diamond Pattern is based on Read The Market(RTM) concepts. The purpose of this model is to face the big players of the market (financial institutions and banks), As you know in financial markets, big traders try to fool small traders, but RTM prevent traders from getting trapped. This style is formed in terms of price candles and presented according to market supply and demand areas and no price oscillator is used in it. RTM concepts are very suitable for all kinds of inves
This indicator finds Double Top and Double bottom Example : What is Double Top When price establishes a new high and then falls, then reverse to the same candle area of High then its considered a valid double top and vice versa for double bottom. 1. It plots and high and low on visible chart if ChartChange is set to true else it searches on new bar opening 2. If there is double top and double bottom found in visible chart window then it plots a line 3. It has options to customize text color, te
FREE
BoxProfile MT5
Evgeny Shevtsov
4.56 (9)
Индикатор отображает профили объёма по принципу вложенности. Периоды профилей предустановлены так, что каждый последующий профиль имеет протяжённость вдвое большую, чем протяжённость предыдущего профиля. Помимо профилей индикатор отображает кластеры объёма, отсортированные по цвету, в зависимости от содержащегося в них объёма. Особенности работы индикатора Индикатор работает на типовых таймфреймах от M5 до MN, но для вычислений использует исторические данные меньших таймфреймов: M1 - для тайм
FREE
Индикатор Candle_Timer_and_Spread показывает на одном графике время до конца свечи и процент изменения цены вместе со спредом по выбранным символам. Таймер времени до конца свечи по текущему таймфрейму и изменение цены в процентах относительно цены открытия дня по умолчанию расположен в правом верхнем углу графика. Панель показывает спред и процент изменения текущей цены относительно открытия дня для выбранных символов. Панель располагается по умолчанию в левом верхнем углу. Входные настрой
FREE
Premium Trend Entry Pro TZ Trade Logics, представляет вам улучшенную версию входа в тренд Premium Этот выпуск принесет вам гораздо более расслабленное состояние торговли с расширенными функциями для фильтрации тренда и временем входа премиального сигнала. Для нас важно не создание продукта! но продолжали обслуживание и обучение пользователей. Благодаря нашим специальным средствам связи с нами вы получите подробное руководство по использованию продукта и другие соответствующие тренинги, св
FREE
O indicador criado por Didi Aguiar, o mestre das Agulhadas! O padrão do indicador é o cruzamento de três médias móveis simples. Média rápida, período 3. Média normalizada, período 8. Média lenta, período 20. Quando as três médias se cruzam próximas o suficiente, acontece a agulhada! Pela posição das médias é possível identificar: Agulhada de compra, agulhada de venda, ponto falso e beijo da mulher aranha. Quer saber mais? Procure pelo site dos robôs oficiais da Dojistar: tradesystembots.co
FREE
На самом деле это просто комбинация из 3 классических индикаторов TTM_SQUEEZE, ничего особенного. Насколько мне известно, именно это реализовано в оригинальном индикаторе TTM_Squeeze PRO. Он показывает сильное, среднее и слабое нажатие. Если кому-то интересно, то TTM_Squeeze не является полностью изобретением Джона Картера. Концепция сжатия широко известна, как и метод поиска сжатия с использованием полос Боллинджера и каналов Кельтнера. Как использовать Как всегда существует множество вари
FREE
Описание индикатора: MACD EMA Crossover MACD EMA Crossover - это мощный индикатор MetaTrader 5 (MT5), разработанный для генерации торговых сигналов на основе пересечений между индикаторами Moving Average Convergence Divergence (MACD) и Exponential Moving Average (EMA). Этот индикатор помогает трейдерам выявлять подходящие сигналы на покупку и продажу, с особым вниманием к разворотам тренда. Особенности: MACD пересекает нулевую линию (сигнал на покупку): Когда линия MACD пересекает сигнальную ли
FREE
Buy Sell Signal Low TF gives buy/sell signals and alerts with up and down arrow at potential reversal of a pullback or a trend continuation pattern in low timeframe. This is an indicator which gives signals based on trend => It works best in trend market with the principle is to ride on the trend not trade against the trend.   The components of Buy Sell Signal Low TF: - The trend is determined by SMMA 13 , SMMA 21 and SMMA 35 ( can be changed manually to suit your preference). - The signal is
FREE
Peak Trough Analysis - отличный инструмент для обнаружения пиков и впадин на графике. Peak Trough Analysis может использовать три разных алгоритма обнаружения пиков и впадин. Эти три алгоритма включают в себя оригинальный индикатор Fractals Билла Вильямса, модифицированный индикатор Fractals и индикатор ZigZag. Вы можете использовать этот инструмент анализа пиков и впадин для обнаружения паттернов, составленных Равновесным Фрактально-Волновым процессом. Для дальнейшего использования имеется хоро
FREE
Guppy Zones
Flavio Javier Jarabeck
4.87 (23)
If you have the opportunity to read the book " Trend Trading - A Seven-Step Approach to success " by Daryl Guppy, you will have a great deal of information about how to "read" the market. In his book Daryl show, among other things, how can we use a visual tool to measure the volatility and trend between Long and Short-term periods: The GMMA - Guppy Multiple Moving Averages . Instead of using his original idea of having 12 Exponential Moving Averages in your chart - which could be very CPU-dem
FREE
AW Flexible Fractals MT5
AW Trading Software Limited
3.92 (12)
Индикатор анализирует ценовую структуру фракталов и определяет возможные точки разворотов рыночной динамики.  Фракталы могут использоваться в качестве уровней поддержки и сопротивления Преимущества: Работает на всех инструментах и таймсериях, Не перерисовывает свои результаты, Настраиваемые цвета элементов индикатора, Отлично сочетается с любой трендовой стратегией, Регулировка силы фракталов. MT4 версия индикатор ->  ЗДЕСЬ   /   AW Fractals EA MT5  ->  ЗДЕСЬ Стратегия: Фракталами наз
FREE
Jackson trendlines
Mthandeni Mnyandu
3.75 (4)
Jackson trendline scanner   it a powerful   price action   tool which draw   accurate trendlines   and   alert   a   breakout signals . As we all know that trendlines it a most powerful tool in price action by providing  us with different chart patterns. e.g. Bullish flag, Pennant, Wedges and more...It not easy to draw trend lines, Most successful traders use trendlines to predict the next move based on chart pattern and breakout. Drawing a wrong trendline it a common problem to everyone, wrong
FREE
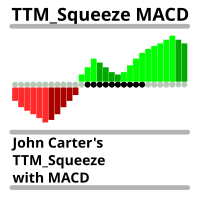
Этот индикатор создан на основе оригинального индикатора TTM_Squeeze Джона Картера и представляет собой "сжатие" рынка, за которым могут последовать (а могут и не последовать) значительные движения. Оригинальный индикатор печатает черные точки, когда полосы Боллинджера находятся внутри каналов Кельтнера, и именно это реализовано в этой пользовательской версии. Вместо оригинальной реализации в качестве индикатора импульса используется индикатор MACD со стандартными настройками 12-26-9. Главным об
FREE
The Weis Waves RSJ Indicator sums up volumes in each wave. This is how we receive a bar chart of cumulative volumes of alternating waves. Namely the cumulative volume makes the Weis wave charts unique. It allows comparing the relation of the wave sequence characteristics, such as correspondence of the applied force (expressed in the volume) and received result (the price progress). If you still have questions, please contact me by direct message:  https://www.mql5.com/en/users/robsjunqueira/
FREE
Investment Castle Supply and Demand
Ahmed Alaaeldin Abdulrahman Ahmed Elherzawi
5 (4)
Supply and Demand indicator does not repaint as it counts the number of tests/retests occurred in the past x number of times. As a trader you need a path to be able to place your buy and sell trades such as: Supply and Demand, Falling & raising channels . Experienced trades will draw the key levels and channels around the timeframes. But, they will not be able to draw them on the small time frames as the price changes too frequent. This indicator is based on Shved supply and demand indicator, b
FREE
CandleStick Pattern Indicator MT5
Driller Capital Management UG
5 (2)
This is a simple Candle Stick Pattern Indicator, which shows in the current time period all standardisized Patterns in the chart. All Patterns will be calculatet automatically based on standard conditions. Following Candle Stick Patterns are included: Bullish Hammer | Bearish Hammer Bullish Inverted Hammer | Bearish Inverted Hammer Bullish Engulfing | Bearish Engulfing Piercing | Dark Cloud Cover Bullish 3 Inside | Bearish 3 Inside There are only a few settings at the begining to take. Every Pat
FREE
**   All Symbols   x   All Timeframes   scan just by pressing scanner button ** *** Contact me after the purchase to send you instructions and add you in "M W Scanner group" for sharing or seeing experiences with other users. Introduction: Double Top(M) and Double Bottom(W) is a very repetitive common type of price reversal patterns. Double Top resembles M pattern and indicates bearish reversal whereas Double Bottom resembles W pattern and indicates a bullish reversal that they have  high win  r
Надоело строить трендовые линии? Индикатор PZ TrendLines MT5 применяет механический подход к построению трендовых линий за вас! Он может нарисовать до 18 линий По желанию трендовые линии могут основываться на фракталах Каждая линия представляет уровень пробоя Каждая трендовая линия может быть пробита или отклонена Настраиваемое число линий Настраиваемое число цветов Автор Артуро Лопез Перез, частный инвестор, биржевой спекулянт, программист и основатель Point Zero Trading Solutions.
FREE
Professional Histogram MT5 или сокращенно PH - это высокоэффективный и надежный инструмент, который позволяет определить направление и силу тренда. PH прост в использовании и настройке, поэтому подойдет как начинающим так и опытным трейдерам. В отличие от большинства индикаторов, Professional Histogram находит более длительные тренды и дает меньше ложных сигналов. При появлении сигнала на покупку или продажу срабатывает алерт, что позволяет своевременно открыть позицию и не сидеть постоянно у мо
Индикатор PipTick Pivot автоматически вычисляет и отображает уровни пивотов и уровни поддержки и сопротивления. Пивоты могут быть рассчитаны по формулам: Classic, Floor, Fibonacci, Woodie, Camarilla или DeMark. Также имеется возможность выбора периода для расчета индикатора. Можно выбрать дневной, недельный, месячный или пользовательский период. Типы пивотов Classic. Floor. Fibonacci. Woodie. Camarilla. DeMark. Основные характеристики Индикатор показывает текущие и исторические уровни пивото
FREE
Тиковые графики показывают количество сделок на каждом баре. Например, если на вашем графике 233 тика, каждому бару соответствуют 233 сделки. После 233 сделок отрисовывается новый бар. Вы можете выбрать любое количество тиков за бар, но большинство трейдеров выбирают числа Фибоначчи (1, 2, 3, 5, 8, 13, 21, 34, 55, 89, 144, 233...). Индикатор использует тиковые данные для настройки, а реальные тики - для построения текущего графика. Данный метод расчета позволяет создавать очень точные графики бе
Рыночные структуры - это те, которые при прорыве на более высоком таймфрейме могут помочь трейдеру очистить тренд. 1. Этот индикатор нарисует ZigZag только до 2 последних структур (предыдущий максимум и минимум ZigZag), а новый бар ZigZag будет сформирован только тогда, когда произойдет разрыв структуры. 2. Он дает Терминал и Push-уведомление о нарушении структуры 3. Увеличьте и уменьшите Extdepth зигзага с помощью клавиш [ и ] для регулировки колебания 4. Измените цвета линий AB BC
Heikin Ashi MACD
Wojciech Daniel Knoff
5 (2)
Check my version of the moving average convergence divergence (MACD) indicator based on Heikin Ashi calculations. Here you find multi-colored histogram which corresponds to bull (green) / bear(red) trend. Dark and light colors describes weakness/strenght of price trend in time. Also you can switch calculations between normal and Heikin Ashi price type. Note: Buffers numbers for iCustom: 0-MACD, 2-Signal line
FREE
Индикатор визуальной линии прибыли в валюте депозита. Работает только при наличии открытых позиций в рынке по символу на котором установлен индикатор. Линию можно двигать мышкой или включить автоматическое следование за ценой Bid. Описание настроек индикатора: colotLine - цвет линии WidthLine - толщина линии colotText - цвет текста FontSize - высота текста Anchor - способ привязки для текста FollowBid - следовать за ценой Bid
FREE
Necessary for traders: tools and indicators Waves automatically calculate indicators, channel trend trading Perfect trend-wave automatic calculation channel calculation , MT4 Perfect trend-wave automatic calculation channel calculation , MT5 Local Trading copying Easy And Fast Copy , MT4 Easy And Fast Copy , MT5 Local Trading copying For DEMO Easy And Fast Copy , MT4 DEMO Easy And Fast Copy , MT5 DEMO Расширенные полосы Боллинджера: 1. Рельс Боллинджера изменит цвет в зависимости от направлен
FREE
Arrowhead MT5
Ivan Grachev
4.54 (13)
Индикатор определяет направление движения цены, обсчитывает по внутренней формуле возможность входа в рынок и отображает сигнал входа на пробой. Сигналы индикатора появляются как при начале трендовых движений, так и в обратном направлении, что позволяет максимально эффективно открывать и закрывать ордера в любом из состояний рынка. Версия для MT4: https://www.mql5.com/ru/market/product/58349 Преимущества: уникальная формула расчета сигнала; высокая точность сигнала; не перерисовывается, не запаз
FREE
NakaTrend
Ricardo De Andrade Nakano
"Представляем вам NakaTrend: ваш идеальный индикатор тренда для MetaTrader 5! Готовы к революции в вашем опыте торговли? Знакомьтесь с NakaTrend, вашим надежным индикатором для определения изменений тренда с точностью и легкостью. С NakaTrend вы никогда не упустите возможность скапитализировать на изменениях рынка. Когда появляется бычий тренд, NakaTrend сигнализирует о нем зеленым знаком доллара, подталкивая вас к оформлению ордера на покупку. И когда наступает медвежий период, появляется
FREE
Индикатор неотстающей волатильности. Кардинальная модификация любимого многими индикатора ATR, в которой исправлены все его недостатки (на картинке представлена разница с ATR). Индикатор показывает размах текущего рыночного движения.  Особенности: не имеет периода временного окна, т.е. каких-либо субъективных настроек неотстающий, экстремумы индикатора всегда совпадают с экстремумом цены (обратите внимание на картинку) нормирован посредством цветового решения, т.е. имеет свойства осциллятора, пр
Boom Scalper Gold
Ignacio Agustin Mene Franco
Boom Scalper Gold It is an indicator, programmed to scalp in a timeframe of 1/5 and 15 Minutes, perfect for hunting spikes and trend sails, where in the parameters of (70) it sends you a sale/sell alert and in the level parameter (8) it sends you a buy signal It is used for indices (BOOM) of synthetic indices (Deriv) It's easy and simple to use, it does all the work by sending you the alerts! the indicator during this period will remain on SALE! Without further ado, enjoy! Good profit. World Inv
The Danko Trend Color indicator is actually a candle coloring to bring practicality, ease and information to your charts. Danko Trend Color combines PRICE AND VOLUME indicators to define the prevailing trend, so the colors are: Blue (indicates an uptrend) Orange (indicates a downtrend) White (indicates undefined trend) I don't like to promise anything with my indicators, I ask you to download, test it for free (for use in backtesting) and see if the indicator can, in some way, help you
Sessions are very important in trading and often good area where to look for setup. In SMC, ICT we will look for Asian session to serve as liquidity This indicator displays: High & Low of the Asia session Midnight New York time opening line Congifuration Line Style, color Label position, size, color Start of the level (Start of the day, Start of the session, Highest or Lowest point in the session) Any questions or comments, send me a direct message here  https://www.mql5.com/en/users/mvonl
FREE
MOST is applied on this RSI moving average with an extra default option added VAR/VIDYA (Variable Index Dynamic Moving Average) MOST added on RSI has a Moving Average of RSI and a trailing percent stop level of the Moving Average that can be adjusted by changing the length of the MA and %percent of the stop level. BUY SIGNAL when the Moving Average Line crosses above the MOST Line LONG CONDITION when the Moving Average is above the MOST SELL SIGNAL when Moving Average Line crosses belo
MT4 Version Kill Zones Kill Zones allows you to insert up to 3 time zones in the chart. The visual representation of the Kill Zones in the chart together with an alert and notification system helps you to ignore fake trading setups occurring outside the Kill Zones or specific trading sessions. Using Kill Zones in your trading will help you filter higher probability trading setups. You should select time ranges where   the market   usually reacts with high volatility. Based on   EST time zone, f
MT4 Version GaussChannelPro is a powerful and innovative trading indicator designed to enhance your trading strategy with the precision of Gaussian-based channels. Leveraging the principles of Gaussian (normal) distribution, this indicator creates a unique channel on your price chart, offering valuable insights into market trends and potential turning points. Utilizing advanced statistical analysis, GaussChannelPro calculates the optimal channel boundaries based on historical price data, present
The   Clean Trading Sessions indicator  shows the most significant trading sessions for the Forex market, such as London, New York, Tokyo. The   Clean Trading Sessions indicator is a simple and, at the same time, quite functional Forex sessions indicator, developed for the MT5 terminal. It is available to download for free. How is this Forex market session indicator used? Traders normally use trading sessions to determine the volatile hours throughout the day, since the trading activities vary
FREE
This indicator analyzes price action patterns and helps you to make positive equity decisions in the binary options market. [ Installation Guide | Update Guide | Troubleshooting | FAQ | All Products ] Easy to trade Trade both call and put options No crystal ball and no predictions The indicator is non-repainting The only strategy suitable for binary options is applying a mathematical approach, like professional gamblers do. It is based on the following principles: Every binary option represents
FREE
This indicator is created by using an exclusive algorithm to indicate you Buy or Sell in an accurate way all the possibles reversals within a normalized trending bands. The main goal for this algorithm is to achieve fast profitable movements and aggressive retracement. Thanks to the normalized bands, using the noises of the market. We have added the "Golden Trade", we define it as the perfect order:   For those orders that had the perfect entry price. They were always in profit, or the final pr
Получайте оповещения о прорыве тренда. Этот индикатор сигнализирует, когда цена совершает большое движение в направлении доминирующего тренда. Эти сигналы могут служить точками входа или точками для добавления к существующей позиции в тренде. Примечание: При следовании за трендом вероятность выигрыша невелика (менее 50 процентов), но доходность средней выигрышной сделки обычно в 3-5 раз превышает среднюю убыточную сделку.  Простая настройка Перетащите на любой график в любой период времени.
FREE
Big Player Candles
Flavio Javier Jarabeck
4.75 (28)
If you heard about The Wyckoff Method, Volume Spread Analysis, etc... You are probably searching for the candlestick indicator that shows you the Volume spread all over the current bar, signaling every types of market status... You can control the several Market Levels with custom colors... It is up to you to decide how to use it. Our job is provide you with the indicator... If you like this indicator, all I am asking is a little Review (not a Comment, but a REVIEW! )...    This will mean A
FREE
Ищете качественный индикатор точек разворота? Значит, PZ Pivot Points - это то, что вам нужно! Он строит уровни не только за текущий день. Он строит исторические уровни для проведения тестирования на истории Вы сами выбираете таймфрейм Цвета и размеры настраиваются Что такое "точки разворота"? Анализ точек разворота зачастую применяется совместно с расчетом уровней поддержки и сопротивления, как и в случае с анализом трендовых линий. При анализе точек разворота первые уровни поддержки и сопрот
FREE
Moving Average Trend Scanner is a multi symbol multi timeframe triple MA crossover dashboard that helps traders to monitor, and identify potential market trends from one chart. This panel scans 3 moving averages in up to 28 configurable instruments and 9 timeframes for triple moving average alignment and moving average crossover with a deep scan feature to scan all market watch symbols (up to 1000 instruments!).   Download Demo   here   (Scans only M1 and M6) Settings description   here MT4 v
Hyper Renko
Rodrigo Matheus da Silva
4.17 (6)
Ренко - это вневременной график, то есть он учитывает не период времени, а изменение цены, что делает изменение цены на графике более четким. Hyper Renko является индикатором, который обеспечивает это. Для настройки у вас есть только один параметр - размер свечи в тике *, который вы хотите использовать. * галочка: это наименьшее возможное изменение актива. Спасибо за выбор индикатора Hyper Trader. Википедия: Диаграмма Ренко показывает минимальное изменение значения переменной - наприм
FREE
Институциональные уровни / Банковские уровни ... Психологические уровни / Теория кварталов. Этот индикатор будет автоматически отображать на графике уровни «000, 200, 500 и 800», которые я знаю как «Институциональные уровни», ИЛИ также может отображать на графике уровни «000, 250, 500 и 750». В зависимости от того, где вы изучали торговлю на институциональном уровне / теорию кварталов, вы можете знать их под разными именами, по сути, основная идея состоит в том, что эти уровни действуют ка
FREE
Introduction This indicator detects volume spread patterns for buy and sell opportunity. The patterns include demand and supply patterns. You might use each pattern for trading. However, these patterns are best used to detect the demand zone (=accumulation area) and supply zone (=distribution area). Demand pattern indicates generally potential buying opportunity. Supply pattern indicates generally potential selling opportunity. These are the underlying patterns rather than direct price action. T
FREE
This is a derivative of John Carter's "TTM Squeeze" volatility indicator, as discussed in his book "Mastering the Trade" (chapter 11). Gray  dot on  the midline show that the market just entered a squeeze (Bollinger Bands are with in Keltner Channel). This signifies low volatility, market preparing itself for an explosive move (up or down). Blue dot signify "Squeeze release". Mr.Carter suggests waiting till the first blue after a gray dot, and taking a position in the direction of the mo
FREE
Добро пожаловать в RSI Colored Candles, инновационный индикатор, разработанный для улучшения вашего опыта торговли путем интеграции индекса относительной силы (RSI) непосредственно на вашем графике цен. В отличие от традиционных индикаторов RSI, RSI Colored Candles использует четырехцветную схему, чтобы представить уровни RSI непосредственно на ваших свечах, обеспечивая вам ценные инсайты на первый взгляд. Особенности и преимущества: Экономия места: Попрощайтесь с перегруженными окнами индикатор
FREE
Используя вдохновение от Приватного Курса Менторства ICT 2016 года (месяц 05), размещенного на YouTube, наш инновационный инструмент дает трейдерам возможность навигации по рынкам с точностью. Помечая периоды в 60, 40 и 20 дней, он помогает выявлять значимые движения на рынке, опираясь на мудрость, внушенную ICT. То, что действительно отличает этот индикатор, - его способность к прогнозированию, функция, предлагающая бесценные идеи о поведении будущего рынка на основе тщательного анализа историч
FREE
This indicators automatically draws the   support and resistances   levels (key levels) for you once you've dropped it on a chart. It reduces the hustle of drawing and redrawing these levels every time you analyse prices on a chart. With it, all you have to do is drop it on a chart, adjust the settings to your liking and let the indicator do the rest. But wait, it gets better; the indicator is absolutely free! For more information:  https://youtu.be/rTxbPOBu3nY For more free stuff visit:  https
FREE
Когда вы работаете с несколькими активами и имеете несколько открытых позиций по активам, немного сложно визуализировать, когда прибыль или прибыль дает каждая активная проблема, поэтому с учетом этого мы разрабатываем этот индикатор, где он облегчает визуализацию операций с активами. , где вы сможете открыть несколько разных ресурсов и сможете визуализировать индивидуальный результат каждого актива и ускорить принятие решений в своем бизнесе.
FREE
Раскройте торговую информацию с помощью Auto Anchored VWAPs: Auto Anchored VWAPs служат вашим руководящим спутником в мире торговли. Эти индикаторы указывают на важные точки разворота на рынке и иллюстрируют их на вашем графике с использованием линий VWAP. Это изменит игру для трейдеров, использующих стратегии с якорными VWAP. Как это работает? Определение верхних точек: Если наивысшая цена текущей свечи ниже наивысшей цены предыдущей свечи, И предыдущий максимум выше, чем предыдущий, Мы определ
FREE
Hull MA
Flavio Javier Jarabeck
4.58 (19)
The Hull Moving Average is not very well know in novice and maybe in intermediate trading circles, but it is a very nice solution created by the trader Alan Hull - please visit www.AlanHull.com for full details of his creation. The purpose of this moving average is to solve both problems that all famouse and common moving averages have: Lag and Choppiness . The implementation we did has, apart of the Period configuration and Price type to use in the calculations, a "velocity" factor, which could
FREE
Candle Timer and Spreed
Karin Klayton Schiochet
4.91 (11)
A very simple indicator, but one that cannot be missed when carrying out your operations. Fast and accurate Spreed information before entering a trade as well as the time to start another candlestick. Spread refers to the difference between the buy (purchase) and sell (offer) price of a stock, bond or currency transaction. Come and see our mql5 signals too. https://www.mql5.com/pt/signals/899841?source=Site +Signals+From+Author
FREE
SUPERTREND ; Это индикатор следования за трендом, основанный на SuperTrend ATR, созданном Оливье Себаном. Его можно использовать для обнаружения изменений в направлении тренда и обнаружения стопов. Когда цена падает ниже кривой индикатора, она становится красной и указывает на нисходящий тренд. И наоборот, когда цена движется выше кривой, индикатор становится зеленым, указывая на восходящий тренд. Как и другие индикаторы, он хорошо работает с SuperTrend в сочетании с другими индикаторами, такими
FREE
ZigZag Support Resistance
Emmanuel Tshepang Mosweu
5 (3)
This indicator uses the Zigzag indicator to identify swing highs and swing lows in the price chart.  Once it has identified the swing highs and swing lows, it can use them to determine potential support and resistance levels. A support level is formed when the price drops and bounces back up from a swing low, indicating that there is buying pressure at that level. A resistance level is formed when the price rises and reverses downward from a swing high, suggesting selling pressure at that level.
FREE
Данный индикатор определяет внутренние бары нескольких диапазонов, тем самым упрощая обнаружение и принятие мер по пробою внутреннего бара трейдерам, торгующим по ценовому действию. Прост в понимании и использовании Настраиваемый выбор цвета В индикаторе предусмотрены визуальные/почтовые/push/звуковые уведомления. Индикатор не перерисовывается и не рисует на истории Внутренним называется бар (или серия баров), который полностью находится в пределах диапазона предыдущего бара. Синяя рамка - это б
FREE
QuantAlgo Signal is one of our best Premium Indicators.  It was designed with an intention of giving traders clear and precise entry signals.  It's main strength is in the possibility of simulating the trades and giving you realistic results.  With this features it is incredibly simple to find the settings you like the best!  QuantAlgo Signal is very simple to use, therefore it is suitable for both beginning and experienced traders.  Features: Precise Entries Backtesting simulation
Advanced Market Analysis Tool : Dive into market depth with the MT5 Volume Profile Indicator. Seamless MT5 Integration : Perfectly compatible with the MT5 platform. Enhances Pro Thunder v9 : Integrates smoothly with Pro Thunder v9 for deeper market insights. Detailed Volume Analysis : Explore market dynamics through in-depth volume data. ️ Simple Installation : Easy-to-follow setup steps for quick integration with MT5. Efficient Single Chart Application : Best used on a single c
FREE
Rejection Candle
Usiola Oluwadamilol Olagundoye
The Expert Advisor for this Indicator can be found here:  https://www.mql5.com/en/market/product/116472 Introducing the Rejection Candle MT5 Indicator, a robust tool designed to revolutionize your trading experience on the MetaTrader 5 platform. Built to pinpoint potential reversals with precision, this indicator offers unparalleled insights into market sentiment shifts, empowering traders to seize profitable opportunities with confidence. Key Features: Advanced Rejection Candle Detection: Uncov
FREE
HiLo Activator is a technical analysis indicator developed by Robert Krausz, a renowned hungarian trader with a career in the USA. It is a trend indicator that helps you to predict the cange of the current trend. In an uptrend it is displayed at the bottom of the candles; in a downtrend it is displayed at the top. Its only setting is the calculation period. It is possible to have alerts when a new trend begin. Enjoy! This is a free indicator, but it took hours to develop. If you want to pay m
FREE
TRIXs
PATRICK ANTONIO MORELO A.
5 (6)
The TRIXs Indicator is the combination of the TRIX (Triple Exponential Moving Average) indicator with the addition of a SMA (Simple Moving Average) signal. It provides signs of trend continuity and the start of a new trend. The entry and exit points of operations occur when the indicator curves cross. It performs better when combined with other indicators.
FREE
Ai Trend Spotter (D Originals). Падение Форекса. Мы часто спрашиваем: " Как брокерские компании зарабатывают деньги? ", и отмечаем любые небольшие выигрышные сделки с нашей стороны. Но после использования (D Originals) вы спросите себя: "Как я стал богатым в одночасье?" . Настолько глубоко, действие говорит громче, чем голос. С Ai Trend Spotter не бойтесь:     *Манипулирование рынком *Разворот рынка * Снайперский вход и существование *Прыжок со свечой Индикатор предназначен для ка
This is one of the most popular and highly rated   volatility index (VIX)   indicators on the market. It provides the same readings as the VIX does for stock indexes. However, this indicator works across all asset classes.  VIX Fix Finds Market Bottoms.  This indicator is not for inexperienced traders. Use it for day and swing trading. MT4 Version -  https://www.mql5.com/en/market/product/112238 Bernard Baruch summed it out best: "Markets fluctuate." The Chicago Board Options Exchange (CBOE) Vo
FREE
Spike Dragon Indicator is Specially Designed for Boom 300 and Crash 500 Indices. We decided to add the indicator after extensive testing. The strategy is Based on Supply and Demand levels, RSI ,MACD and 1 other custom indicator designed to filter out less probability signals.We accept suggestions in improving our system. Why choosing Spike Dragon : Easy Installation and compatible with MT5 Platform Onpoint Signals on M1 Timeframe making the system fast in generating Spikes Good risk Managemen
Candlestick Pattern Detector
Adhemar Braganca Correa Travassos
This indicator can identify more than 60 candlestick patterns on the chart, including their bullish and bearish variants. Just choose the pattern you want in the settings. Available Patterns 2 Crows Gravestone Doji On Neck 3 Black Crows Hammer Piercing 3 Inside Hanging Man Rick Shawman 3 Line Strike Harami Rising and Falling Three Method 3 Outside Harami Cross Separating Lines 3 Stars in South High Wave Shooting Star 3 White Soldiers Hikkake Short Line Abandoned Baby Hikkake Modified Spinning
Multi Timeframe VWAP
Carlos Gomez Zorrilla Amate
The multi VWAP indicator will plot on your chart up to 7 different VWAPs: daily, weekly, quarterly and yearly plus up to 2 customizable intraday sessions. It will also plot the closing level of the previous period for each of the VWAPs displayed e.g. during the month of November you will see the VWAP closing level of October or during Q3 you will see the Q2's closing VWAP price. All levels can also display an optional label. Besides, in order to improve the indicator precision, it will automatic
This incicator shows you when a pin bar is formed, and aid you perform a inversion strategy or a trend continuation based on resistence support and or channel. Typically a pin bar shows you a price rejection from the market and the signal most of time is profitable. So i suggest to use buy/sell limit order over ratrace SL little bit over or below bar and take profit based on your strategy and money management. Best timeframe are D H4 H1
Индикатор RSI magic kjuta5 . Пользовательский   Индикатор ( RSI magic kjuta ) на основе стандартного Индикатора Силы ( Relative Strength Index, RSI ) с дополнительными настройками и функциями. К стандартной линии RSI добавлены линии максимального и минимального значения RSI на графике. Теперь можно визуально наблюдать прошедшие максимумы и минимумы RSI , а не только значения по закрытию баров, что позволяет избежать путаницы   при анализе торгов. Например, советник открыл или закрыл ордер, но

MetaTrader Маркет позволяет максимально безопасно покупать программы для платформы MetaTrader. Вы можете скачать демо-версии понравившихся роботов и индикаторов прямо из терминала и проверить их в тестере стратегий.

Протестируйте программы в различных режимах перед покупкой для получения максимального представления о продукте и оплатите понравившийся продукт через платежную систему MQL5.community.

Платежная система MQL5.community обеспечивает оплату продавцам, а возможность тестирования программ в различных режимах позволяет покупателям получить максимальное представление о продукте.