Подсчёт тикового объёма
Aliaksei Karalkou:
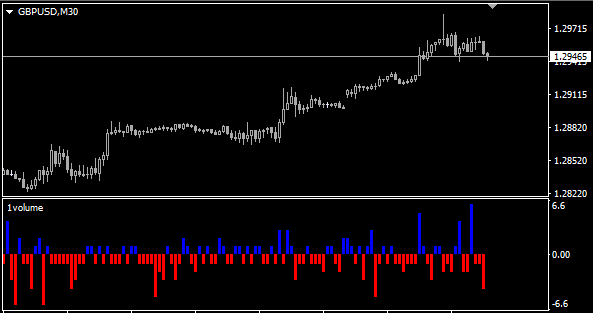
Есть начальный код Выражение подсчёта тиков вверх и вниз идёт в виде гистограммы , а нужно что бы отображалась как линия в процентном выражении за несколько баров.
Заранее спасибо за помощь.
Есть начальный код Выражение подсчёта тиков вверх и вниз идёт в виде гистограммы , а нужно что бы отображалась как линия в процентном выражении за несколько баров.
Заранее спасибо за помощь.
Пример на скрине бы что именно требуется и пример расчёта в процентном выражение (что это)
Чуток подправил
буферы
//-------------------------------------------------------------------+
//|                            Copyright © 2019, forex-time@mail.ru  |
//-------------------------------------------------------------------+
#property copyright   "Copyright © 2019, forex-time@mail.ru"
#property strict
//-------------------------------------------------------------------+
#property indicator_separate_window
#property indicator_buffers 2
#property indicator_color1  Blue
#property indicator_width1  2
#property indicator_color2  Red
#property indicator_width2  2

//--- indicator buffers
double up[];
double dn[];
//---
int i;
double last;
//+------------------------------------------------------------------+
//| Custom indicator initialization function                         |
//+------------------------------------------------------------------+
int OnInit(){
//--- indicator buffers mapping
   SetIndexBuffer(0,up); SetIndexStyle(0,DRAW_HISTOGRAM);
   SetIndexBuffer(1,dn); SetIndexStyle(1,DRAW_HISTOGRAM);
//---
   last=Bid;
//---
return(INIT_SUCCEEDED);}
//+------------------------------------------------------------------+
//| Custom indicator iteration function                              |
//+------------------------------------------------------------------+
int OnCalculate(const int rates_total,
                const int prev_calculated,
                const datetime &time[],
                const double &open[],
                const double &high[],
                const double &low[],
                const double &close[],
                const long &tick_volume[],
                const long &volume[],
                const int &spread[])
  {
//---
   if(last!=Bid)
     {
      if(Bid-last>0){
         up[i]=(Bid-last)/_Point;
         i++;}

      if(Bid-last<0){
         dn[i]=(Bid-last)/_Point;
         i++;}

      last=Bid;
     }
//--- return value of prev_calculated for next call
return(rates_total);}
//+------------------------------------------------------------------+
Aliaksei Karalkou:
Есть начальный код Выражение подсчёта тиков вверх и вниз идёт в виде гистограммы , а нужно что бы отображалась как линия в процентном выражении за несколько баров.
Заранее спасибо за помощь.
Есть начальный код Выражение подсчёта тиков вверх и вниз идёт в виде гистограммы , а нужно что бы отображалась как линия в процентном выражении за несколько баров.
Заранее спасибо за помощь.
Ну во первых, инкремент i - это не способ получить гистограмму, а способ отразить измненение цены за один тик, через короткое время "гистограмма" скроется за краем графика а еще через какое-то время будет ошибка по размеру массива. Короче код который Вам кажется нужен значительно проще:
int Pips = 1/_Point;
double last=0;
//+------------------------------------------------------------------+
//| Custom indicator initialization function                         |
//+------------------------------------------------------------------+
int OnInit()
  {
//--- indicator buffers mapping
   SetIndexStyle(0,DRAW_HISTOGRAM,0,4,Blue);
   SetIndexStyle(1,DRAW_HISTOGRAM,0,4,Red);

   SetIndexBuffer(0,up);
   SetIndexBuffer(1,dn);

   last=Bid;
//---
   return(INIT_SUCCEEDED);
  }
//+------------------------------------------------------------------+
//| Custom indicator iteration function                              |
//+------------------------------------------------------------------+
int OnCalculate(const int rates_total,
                const int prev_calculated,
                const datetime &time[],
                const double &open[],
                const double &high[],
                const double &low[],
                const double &close[],
                const long &tick_volume[],
                const long &volume[],
                const int &spread[])
{
//---
  if(NewBar){
    up[0] = 0;
    dn[0] = 0;
  }
  double diff = (Bid-last)*Pips;
  if(diff > 0) up[0] += diff;
  else         dn[0] += diff;
  last = Bid;

  NewBar - вариант определения старта новой свечи - на Ваше усмотрение.

  сюда можно вставить дополнительный код по анализу отношений (%), разниц, сумм и т.п.
  а сейчас в принципе вы получили соотношение прохода цены вверх и вниз,
  разница за весь бар должна быть близка к open - close с соответствующим знаком в пипсах (ни о каком объеме речи не идет).

  тиковый объем считается еще проще

  if(NewBar) volume[0] = 0;
  volume[0]++;


  return(rates_total);
}
//+------------------------------------------------------------------+
Вы упускаете торговые возможности:
- Бесплатные приложения для трейдинга
- 8 000+ сигналов для копирования
- Экономические новости для анализа финансовых рынков
Регистрация
Вход
Вы принимаете политику сайта и условия использования
Если у вас нет учетной записи, зарегистрируйтесь
Заранее спасибо за помощь.