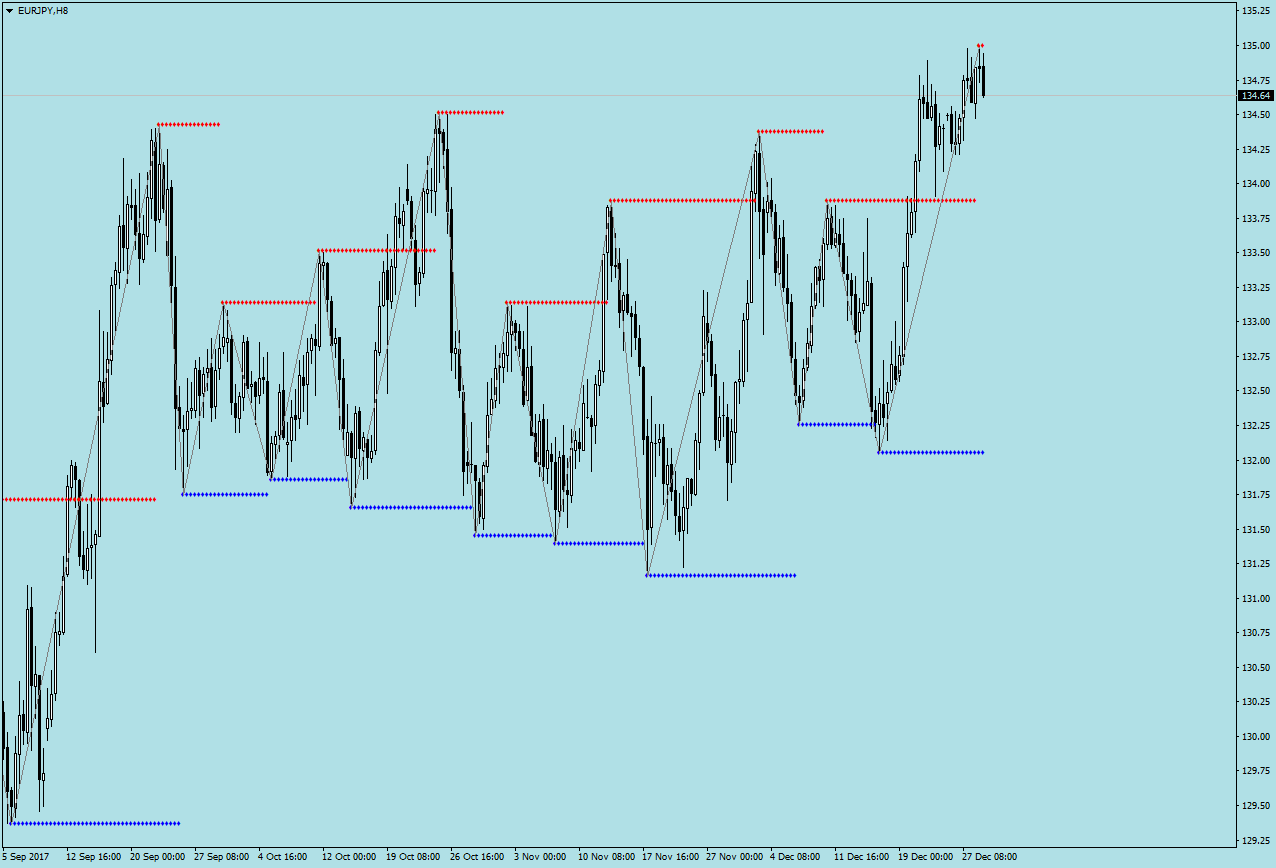
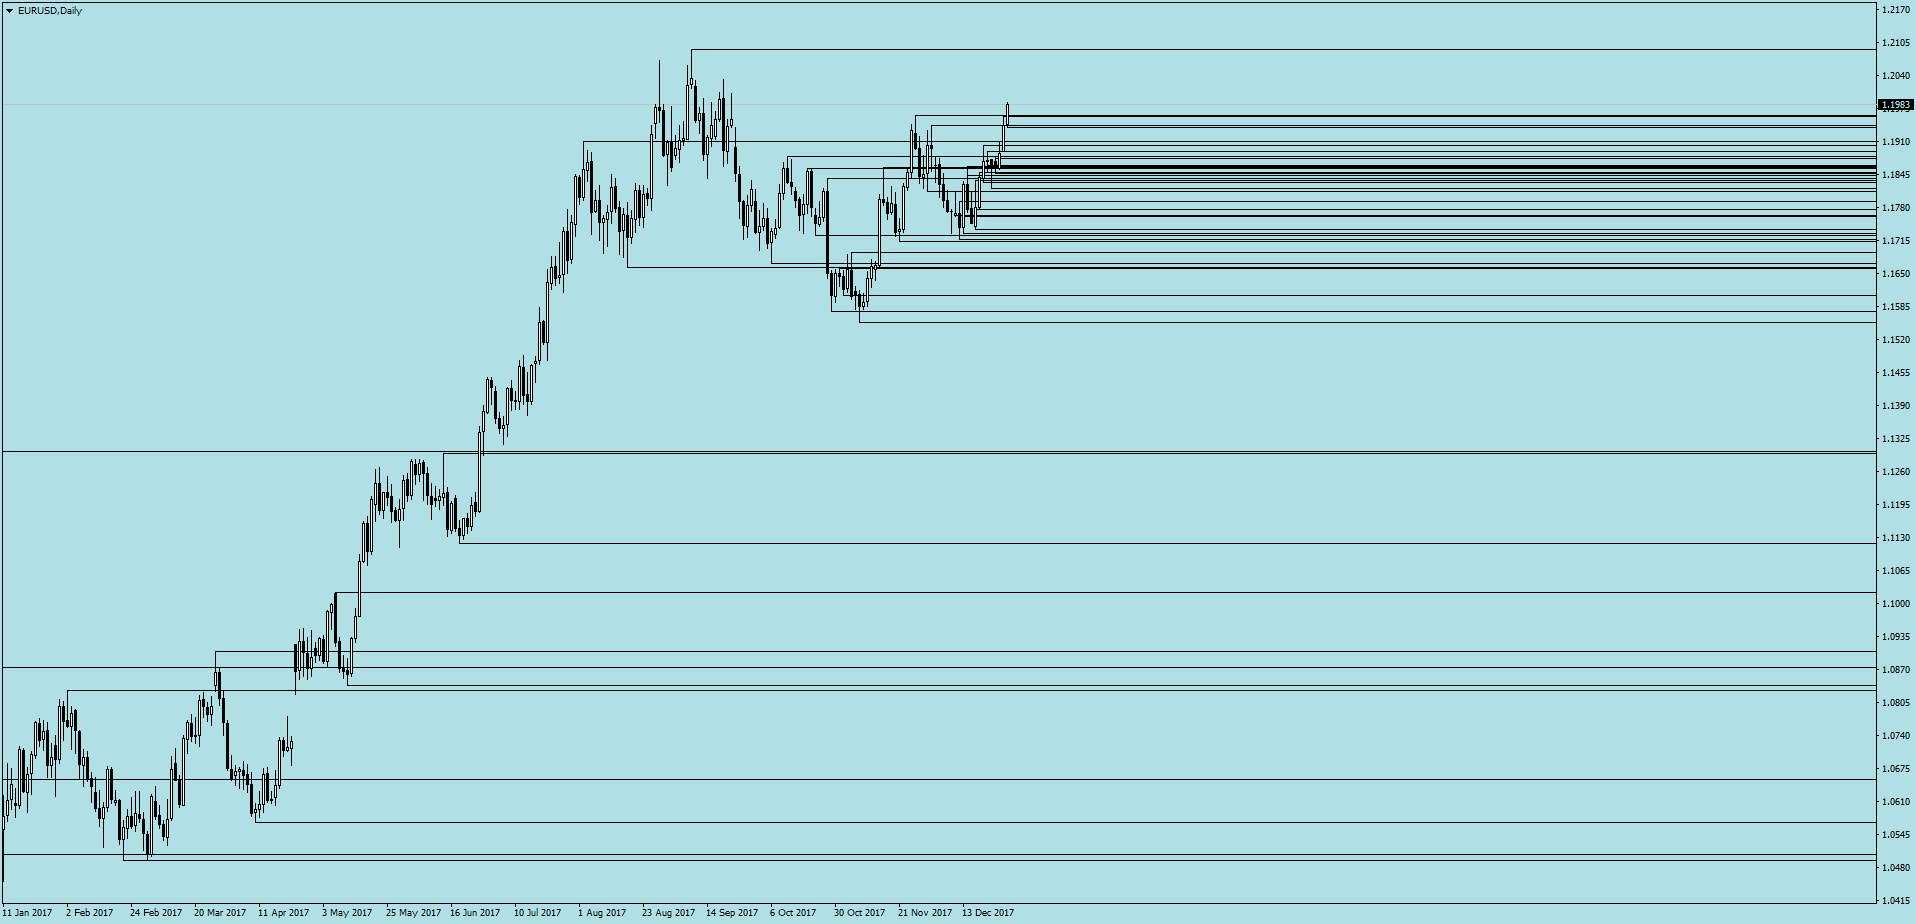
Уровни по пикам ZigZag из mql5 в mql4


Нет опыта с mql5, но знаю что функции почти похожи, но формулировка разная.

Проблема с выделенным, направьте на путь истинный:

//--- copyright MQL5
#property copyright "Copyright © 2014"
//--- a link to the website of the author
#property link ""
//--- indicator version
#property version   "1.00"
//--- drawing the indicator in the main window
#property indicator_chart_window 
//--- two buffers are used for the indicator calculation and drawing
#property indicator_buffers 2
//--- no graphical constructions
#property indicator_plots   0
//+----------------------------------------------+
//| Declaration of enumeration                   |
//+----------------------------------------------+  
enum Width
  {
   Width_1=1, //1
   Width_2,   //2
   Width_3,   //3
   Width_4,   //4
   Width_5    //5
  };
//+----------------------------------------------+
//| Declaration of enumeration                   |
//+----------------------------------------------+
enum Style
  {
   SOLID_,       //Solid line
   DASH_,        //Dashed line
   DOT_,         //Dotted line
   DASHDOT_,     //Dot-dash line
   DASHDOTDOT_   //Dot-dash line with double dots
  };
//+----------------------------------------------+
//| declaration of constants                     |
//+----------------------------------------------+
#define RESET  0 // the constant for getting the command for the indicator recalculation back to the terminal
//+----------------------------------------------+
//| Indicator input parameters                   |
//+----------------------------------------------+
input ENUM_TIMEFRAMES TimeFrame=PERIOD_H4;         // Chart period
input string levels_sirname="ZigZag_NK_MTF_Level"; // A name for the group of levels
input uint SuprTotal=6;                            // The number of maxima and minima
//---
input color  Color_Res = clrAqua;              // Color of resistance
input Style  Style_Res = SOLID_;               // Style of the maximum line
input Width  Width_Res = Width_3;              // Width of the maximum line
//---
input color  Color_Sup = clrMediumOrchid;      // Color of support
input Style  Style_Sup = SOLID_;               // Style of the minimum line
input Width  Width_Sup = Width_3;              // Width of the minimum line
//--- Zigzag parameters
input uint ExtDepth=12;
input uint ExtDeviation=5;
input uint ExtBackstep=3;
//+----------------------------------------------+
//--- declaring dynamic arrays that will be further used as the indicator buffers
double HighestBuffer[],LowestBuffer[];
//--- declaration of strings for storing the names of the lines
string UpLinesName[],DnLinesName[];
//--- declaration of integer variables for the start of data calculation
int min_rates_total,nSuprTotal;
//--- declaration of integer variables for the indicators handles
int Ind_Handle;
//+------------------------------------------------------------------+
//| Custom indicator initialization function                         |
//+------------------------------------------------------------------+  
int OnInit()
  {
//--- memory distribution for variables' arrays  
   ArrayResize(UpLinesName,SuprTotal);
   ArrayResize(DnLinesName,SuprTotal);
//--- initialization of global variables 
   nSuprTotal=int(SuprTotal);
   min_rates_total=int(ExtDepth+ExtBackstep)*nSuprTotal*2;
   for(int count=0; count<nSuprTotal; count++) UpLinesName[count]=levels_sirname+"_Up_"+string(count);
   for(count=0; count<nSuprTotal; count++) DnLinesName[count]=levels_sirname+"_Dn_"+string(count);
//--- getting the handle of the ZigZag_NK_MTF indicator
   Ind_Handle=iCustom(Symbol(),PERIOD_CURRENT,"ZigZag_NK_MTF",TimeFrame,ExtDepth,ExtDeviation,ExtBackstep);
   if(Ind_Handle==INVALID_HANDLE)
     {
      Print(" Failed to get the handle of the ZigZag_NK_MTF indicator");
      return(INIT_FAILED);
     }
//--- set dynamic arrays as indicator buffers
   SetIndexBuffer(0,LowestBuffer,INDICATOR_CALCULATIONS);
   SetIndexBuffer(1,HighestBuffer,INDICATOR_CALCULATIONS);
//--- indexing buffer elements as timeseries   
   ArraySetAsSeries(LowestBuffer,true);
   ArraySetAsSeries(HighestBuffer,true);
//--- determining the accuracy of the indicator values
   IndicatorSetInteger(INDICATOR_DIGITS,_Digits);
//--- Creating labels for displaying in DataWindow and the name for displaying in a separate sub-window and in a tooltip
   IndicatorSetString(INDICATOR_SHORTNAME,"ZigZag_NK_Levels("+string(SuprTotal)+")");
//--- initialization end
   return(INIT_SUCCEEDED);
  }
//+------------------------------------------------------------------+
//| Custom indicator deinitialization function                       |
//+------------------------------------------------------------------+    
void OnDeinit(const int reason)
  {
//---
   for(int count=0; count<nSuprTotal; count++) ObjectDelete(0,UpLinesName[count]);
   for(count=0; count<nSuprTotal; count++) ObjectDelete(0,DnLinesName[count]);
//---
   ChartRedraw(0);
  }
//+------------------------------------------------------------------+
//| Custom indicator iteration function                              |
//+------------------------------------------------------------------+
int OnCalculate(const int rates_total,    // number of bars in history at the current tick
                const int prev_calculated,// amount of history in bars at the previous tick
                const datetime &time[],
                const double &open[],
                const double& high[],     // price array of maximums of price for the calculation of indicator
                const double& low[],      // price array of price lows for the indicator calculation
                const double &close[],
                const long &tick_volume[],
                const long &volume[],
                const int &spread[])
  {
//--- checking if the number of bars is enough for the calculation
   if(BarsCalculated(Ind_Handle)<rates_total || rates_total<min_rates_total) return(RESET);
//--- apply timeseries indexing to array elements  
   ArraySetAsSeries(time,true);
//--- declarations of local variables 
   int limit;
//--- calculation of the starting number limit for the bar recalculation loop
   if(prev_calculated>rates_total || prev_calculated<=0)// checking for the first start of calculation of an indicator
      limit=rates_total-2; // Starting index for the calculation of all bars
   else limit=rates_total-prev_calculated; // starting index for the calculation of new bars
   int to_copy=limit+1;
//--- copy newly appeared data in the arrays
   if(CopyBuffer(Ind_Handle,1,0,to_copy,LowestBuffer)<=0) return(RESET);
   if(CopyBuffer(Ind_Handle,0,0,to_copy,HighestBuffer)<=0) return(RESET);
//---   
   int upcount=0;
   int dncount=0;
//--- main calculation loop of the indicator
   for(int bar=0; bar<rates_total && !IsStopped(); bar++)
     {
      if(dncount<nSuprTotal && LowestBuffer[bar])
        {
         double Min=LowestBuffer[bar];
         datetime end=time[0]+PeriodSeconds(PERIOD_CURRENT);
         SetTline(0,DnLinesName[dncount],0,time[bar],Min,end,Min,Color_Sup,Style_Sup,Width_Sup,DoubleToString(Min,_Digits));
         dncount++;
        }
      //---
      if(upcount<nSuprTotal && HighestBuffer[bar])
        {
         double Max=HighestBuffer[bar];
         end=time[0]+PeriodSeconds(PERIOD_CURRENT);
         SetTline(0,UpLinesName[upcount],0,time[bar],Max,end,Max,Color_Res,Style_Res,Width_Res,DoubleToString(Max,_Digits));
         upcount++;
        }
      if(dncount==nSuprTotal && upcount==nSuprTotal) break;
     }
//---
   for(int count=dncount; count<nSuprTotal; count++) ObjectDelete(0,DnLinesName[count]);
   for(count=upcount; count<nSuprTotal; count++) ObjectDelete(0,UpLinesName[count]);
//---
   ChartRedraw(0);
   return(rates_total);
  }
//+------------------------------------------------------------------+
//|  Trend line creation                                             |
//+------------------------------------------------------------------+
void CreateTline(long     chart_id,      // Chart ID
                 string   name,          // object name
                 int      nwin,          // window index
                 datetime time1,         // price level time 1
                 double   price1,        // price level 1
                 datetime time2,         // price level time 2
                 double   price2,        // price level 2
                 color    Color,         // line color
                 int      style,         // line style
                 int      width,         // line width
                 string   text)          // text 
  {
//---
   ObjectCreate(chart_id,name,OBJ_TREND,nwin,time1,price1,time2,price2);
   ObjectSetInteger(chart_id,name,OBJPROP_COLOR,Color);
   ObjectSetInteger(chart_id,name,OBJPROP_STYLE,style);
   ObjectSetInteger(chart_id,name,OBJPROP_WIDTH,width);
   ObjectSetString(chart_id,name,OBJPROP_TEXT,text);
   ObjectSetInteger(chart_id,name,OBJPROP_BACK,true);
   ObjectSetInteger(chart_id,name,OBJPROP_RAY_RIGHT,true);
   ObjectSetInteger(chart_id,name,OBJPROP_RAY,true);
   ObjectSetInteger(chart_id,name,OBJPROP_SELECTED,true);
   ObjectSetInteger(chart_id,name,OBJPROP_SELECTABLE,false);
   ObjectSetInteger(chart_id,name,OBJPROP_ZORDER,true);
//---
  }
//+------------------------------------------------------------------+
//|  Resetting a trend line                                          |
//+------------------------------------------------------------------+
void SetTline(long     chart_id,      // Chart ID
              string   name,          // object name
              int      nwin,          // window index
              datetime time1,         // price level time 1
              double   price1,        // price level 1
              datetime time2,         // price level time 2
              double   price2,        // price level 2
              color    Color,         // line color
              int      style,         // line style
              int      width,         // line width
              string   text)          // text 
  {
//---
   if(ObjectFind(chart_id,name)==-1) CreateTline(chart_id,name,nwin,time1,price1,time2,price2,Color,style,width,text);
   else
     {
      ObjectSetString(chart_id,name,OBJPROP_TEXT,text);
      ObjectMove(chart_id,name,0,time1,price1);
      ObjectMove(chart_id,name,1,time2,price2);
      ObjectSetInteger(chart_id,name,OBJPROP_COLOR,Color);
     }
//---
  }
//+------------------------------------------------------------------+
 
Файлы:
 
poruchik:

Спасибо, но не подойдёт такой вариант.
Важно чтобы линии продолжались, а не отрезками были до следующего пика.


1

есть такой продукт)

 
Taras Slobodyanik:

есть такой продукт)


Тоже не то))
Все пики должны отрисовываться по текущий бар, даже если они были отработаны.

 
Файлы:
 
poruchik:

Вот это то что нужно))

Буду его редактировать под свои нужды (удаление линий, цвет и т.д.)

Спасибо.

 
NatashkaFX :


Нет опыта с mql5, но знаю что функции почти похожи, но формулировка разная.

Проблема с выделенным , направьте на путь истинный:

Здравствуй

Когда я компилирую это в мета-редакторе, я получаю

1. «BarsCalculated» - функция не определена

«2. CopyBuffer '- функция не определена

3. «CopyBuffer» - функция не определена 137 7


Пожалуйста, помогите?

Спасибо

Причина обращения: