Khurram Mustafa / Perfil
- Informações
|
11+ anos
experiência
|
7
produtos
|
38
versão demo
|
|
0
trabalhos
|
0
sinais
|
0
assinantes
|
Khurram Mustafa
produto partilhado pelo vendedor Sergey Belov
This automated Expert Advisor is designed to work with ECN brokers and low spreads. The EA works around the clock and there is no need to stop it during during important news releases. Trade is conducted by the levels. The EA features the search for the necessary levels at once on two time periods. The EA uses the built-in filter to select levels, at which it will place the pending orders. All orders are opened with the predefined StopLoss and TakeProfit parameters. Thus, even in the
Khurram Mustafa

Andrey Pitikov
Закончил тест советника (Night Warrior - https://www.mql5.com/ru/market/product/12558) по котировкам от Dukascopy с 01.01.2005 по 08.11.2015. Результаты смотрите сами.
Graduated test Adviser (Night Warrior - https://www.mql5.com/ru/market/product/12558) quotes from Dukascopy from 01.01.2005 on 08.11.2015 .
The results , see for yourself .
Graduated test Adviser (Night Warrior - https://www.mql5.com/ru/market/product/12558) quotes from Dukascopy from 01.01.2005 on 08.11.2015 .
The results , see for yourself .

1
Khurram Mustafa

Yury Kirillov
Trading stocks, futures, options and other exchange instruments
https://www.mql5.com/en/forum/stock-exchange
Биржевой трейдинг
https://www.mql5.com/ru/forum/stock-exchange
https://www.mql5.com/en/forum/stock-exchange
Биржевой трейдинг
https://www.mql5.com/ru/forum/stock-exchange
Khurram Mustafa

Khurram Mustafa
Strength Box is a very simple indicator to understand and anyone can use it. This is a totally free version. I am working on other indicators and Expert Advisors and I will add them to the Market soon.
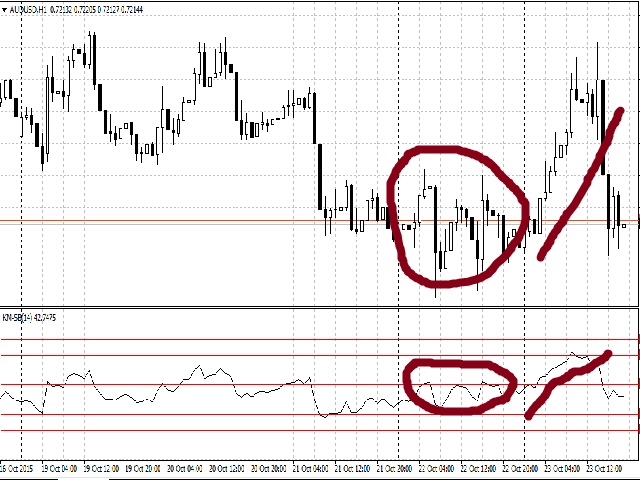
This indicator shows trends and is based on Relative Strength Index (RSI)
Features
20 and 80 - danger area (confirms trend pull back chances)
30 and 70 - thinking area (price pull back chances)
50 - neutral area
Happy Trading!
https://www.mql5.com/en/market/product/12478
This indicator shows trends and is based on Relative Strength Index (RSI)
Features
20 and 80 - danger area (confirms trend pull back chances)
30 and 70 - thinking area (price pull back chances)
50 - neutral area
Happy Trading!
https://www.mql5.com/en/market/product/12478

Khurram Mustafa

Khurram Mustafa
KM Signals
TRADE POLICY:
Hedging Trading (Open buy sell, then at correct time one will loss and try to get profit from second)
News Trading (When News happen will sell or buy for short term)
Use of Indicators My Indicators/Experts (When Indicates I Buy Or Sell - Short Term & Long Term)
Terms: Majority Do Short Term Trades
Timings: Majority In New York Session
Growth: Don't Follow Signal's Growth Because Some Times I Follow My Hedge Trading Strategy, If It Is Then Obviously If I Close Loss Position Then Second Position Will Must In Profit But Growth Will Down Because Of Large Drop Down
FRIENDLY WORDS:
Manage Your Risks As Sharp You Can
Try To Predict What Should Happen With Your Trades
Whatever Loss Or Profit happens, Be Sure You Are Satisfied To Lose It In Forex Market
https://www.mql5.com/en/signals/144149
Khurram Mustafa

Khurram Mustafa
Strength Arrow
KM-Strength Arrow is similar to my first free indicator Strength Box.
The differences between Strength Box and Strength Arrow:
Strength Box is placed in a separate chart window and you take decisions according to its readings.
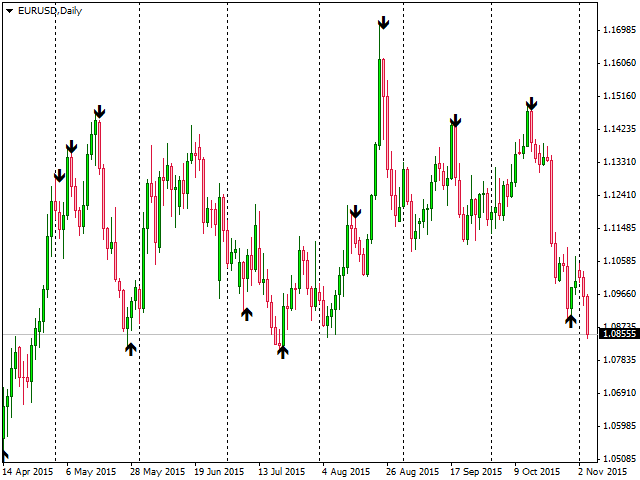
Strength Arrow is placed in chart window and applies arrows of reversal levels. Take an advantage of Trailing Stop and close trades efficiently. Higher timeframes are recommended.
The indicator indicates buy or sell points based on Strength Box Period 5. Please see the screenshots for better understanding.
https://www.mql5.com/en/market/product/12659

Khurram Mustafa

Khurram Mustafa
KM Execute
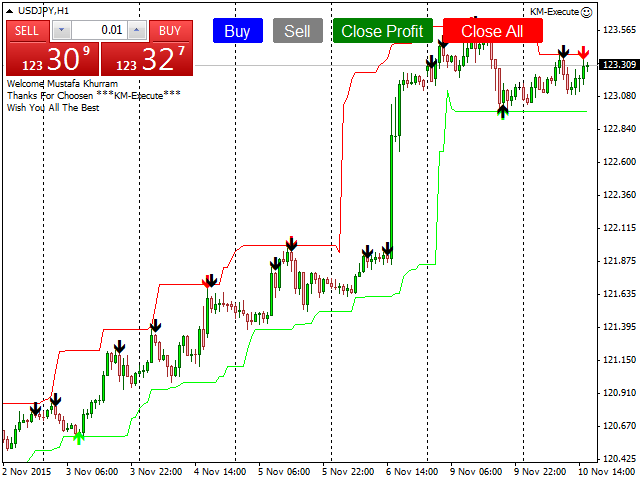
Aim of this development is to save time during order execution delay by software. This application needs only one time setting then users are free from delay in executes.
KM Execute have 4 buttons which are:
Buy => Instant Execute Buy Position (Lots Followed By Settings)
Sell => Instant Execute Sell Position (Lots Followed By Settings)
Close => Close All Positions Instantly (Indeed they were in Loss Position)
Close profit => Close All Profitable Positions Only
https://www.mql5.com/en/market/product/12469

Khurram Mustafa

Khurram Mustafa
Publicado o postagem PANEL FOR INSTANT EXECUTION
Aim of this development is to save time during order execution delay by software. This application needs only one time setting then users are free from delay in executes...
Khurram Mustafa

Insta Trade
Publicado o postagem Обзор и прогноз по рынку от Альфа-Форекс на 18.11.2015
Вчера торги на валютном рынке протекали в ограниченных диапазонах, причем на этот раз доллар показал разнонаправленную динамику, укрепившись против евро и иены и слегка снизившись в паре с фунтом...
Khurram Mustafa
Publicado o postagem PANEL FOR INSTANT EXECUTION
Aim of this development is to save time during order execution delay by software. This application needs only one time setting then users are free from delay in executes...
Khurram Mustafa

KM Execute
Aim of this development is to save time during order execution delay by software. This application needs only one time setting then users are free from delay in executes.
KM Execute have 4 buttons which are:
Buy => Instant Execute Buy Position (Lots Followed By Settings)
Sell => Instant Execute Sell Position (Lots Followed By Settings)
Close => Close All Positions Instantly (Indeed they were in Loss Position)
Close profit => Close All Profitable Positions Only
https://www.mql5.com/en/market/product/12469
Aim of this development is to save time during order execution delay by software. This application needs only one time setting then users are free from delay in executes.
KM Execute have 4 buttons which are:
Buy => Instant Execute Buy Position (Lots Followed By Settings)
Sell => Instant Execute Sell Position (Lots Followed By Settings)
Close => Close All Positions Instantly (Indeed they were in Loss Position)
Close profit => Close All Profitable Positions Only
https://www.mql5.com/en/market/product/12469

Khurram Mustafa

My Trend Lines
This is my second indicator. Its purpose is to understand a trend. This indicator is actually based on moving average.
The default period is 20. Users can change settings as per required.
https://www.mql5.com/en/market/product/12479
This is my second indicator. Its purpose is to understand a trend. This indicator is actually based on moving average.
The default period is 20. Users can change settings as per required.
https://www.mql5.com/en/market/product/12479

Khurram Mustafa

Strength Arrow
KM-Strength Arrow is similar to my first free indicator Strength Box.
The differences between Strength Box and Strength Arrow:
Strength Box is placed in a separate chart window and you take decisions according to its readings.
Strength Arrow is placed in chart window and applies arrows of reversal levels. Take an advantage of Trailing Stop and close trades efficiently. Higher timeframes are recommended.
The indicator indicates buy or sell points based on Strength Box Period 5. Please see the screenshots for better understanding.
https://www.mql5.com/en/market/product/12659
KM-Strength Arrow is similar to my first free indicator Strength Box.
The differences between Strength Box and Strength Arrow:
Strength Box is placed in a separate chart window and you take decisions according to its readings.
Strength Arrow is placed in chart window and applies arrows of reversal levels. Take an advantage of Trailing Stop and close trades efficiently. Higher timeframes are recommended.
The indicator indicates buy or sell points based on Strength Box Period 5. Please see the screenshots for better understanding.
https://www.mql5.com/en/market/product/12659

Khurram Mustafa
KM Signals
TRADE POLICY:
Hedging Trading (Open buy sell, then at correct time one will loss and try to get profit from second)
News Trading (When News happen will sell or buy for short term)
Use of Indicators My Indicators/Experts (When Indicates I Buy Or Sell - Short Term & Long Term)
Terms: Majority Do Short Term Trades
Timings: Majority In New York Session
Growth: Don't Follow Signal's Growth Because Some Times I Follow My Hedge Trading Strategy, If It Is Then Obviously If I Close Loss Position Then Second Position Will Must In Profit But Growth Will Down Because Of Large Drop Down
FRIENDLY WORDS:
Manage Your Risks As Sharp You Can
Try To Predict What Should Happen With Your Trades
Whatever Loss Or Profit happens, Be Sure You Are Satisfied To Lose It In Forex Market
https://www.mql5.com/en/signals/144149
TRADE POLICY:
Hedging Trading (Open buy sell, then at correct time one will loss and try to get profit from second)
News Trading (When News happen will sell or buy for short term)
Use of Indicators My Indicators/Experts (When Indicates I Buy Or Sell - Short Term & Long Term)
Terms: Majority Do Short Term Trades
Timings: Majority In New York Session
Growth: Don't Follow Signal's Growth Because Some Times I Follow My Hedge Trading Strategy, If It Is Then Obviously If I Close Loss Position Then Second Position Will Must In Profit But Growth Will Down Because Of Large Drop Down
FRIENDLY WORDS:
Manage Your Risks As Sharp You Can
Try To Predict What Should Happen With Your Trades
Whatever Loss Or Profit happens, Be Sure You Are Satisfied To Lose It In Forex Market
https://www.mql5.com/en/signals/144149
Khurram Mustafa

Strength Box is a very simple indicator to understand and anyone can use it. This is a totally free version. I am working on other indicators and Expert Advisors and I will add them to the Market soon.
This indicator shows trends and is based on Relative Strength Index (RSI)
Features
20 and 80 - danger area (confirms trend pull back chances)
30 and 70 - thinking area (price pull back chances)
50 - neutral area
Happy Trading!
https://www.mql5.com/en/market/product/12478
This indicator shows trends and is based on Relative Strength Index (RSI)
Features
20 and 80 - danger area (confirms trend pull back chances)
30 and 70 - thinking area (price pull back chances)
50 - neutral area
Happy Trading!
https://www.mql5.com/en/market/product/12478

Khurram Mustafa

Khurram Mustafa
Aim of this development is to save time during order execution delay by software. This application needs only one time setting then users are free from delay in executes.
KM Execute have 4 buttons which are:
Buy => Instant Execute Buy Position (Lots Followed By Settings)
Sell => Instant Execute Sell Position (Lots Followed By Settings)
Close => Close All Positions Instantly (Indeed they were in Loss Position)
Close profit => Close All Profitable Positions Only
Default settings are:
Lots: 0.01 (Minimum)
Stop Loss: 100 (Points)
Take Profit: 5 (Points)
Trailing Start: 3 (Points)
Trailing Stop: 2 (Points)
Slippage: 3
Magic No.: 786
User Can Change These Settings As Per His or Her Requirements
Remember: Trailing Stop & Stop Loss Will execute as per Settings, So set up your SL & TL through settings.
How To Close Application: Use Right Click => Expert => Remove Expert
Thanks for showing interest. Happy Trading
https://www.mql5.com/en/market/product/12469
Khurram Mustafa

Publicado o postagem EUROPE
DateTime (GMT) DateTime (GMT) Name...
Compartilhar nas redes sociais · 3
141
1
Khurram Mustafa
Publicado o postagem NEWZEALAND - COMING WEEK
DateTime (GMT) Name Volatility...
Compartilhar nas redes sociais · 1
106
:
