• Visão global
  • Comentários
  • Discussão
  • O que há de novo

Winshots Massive FX Profits

Pare de procurar e tentar novos indicadores! Obtenha o indicador Winshots Massive FX Profits e destaque-se na multidão.

Anos de experiência em negociações nos levaram à construção de tudo isso em um indicador!

Negocie como um profissional com Winshots Massive FX Profits!

Este indicador usa as seguintes metodologias para ajudá-lo a se tornar um trader lucrativo mais consistente:


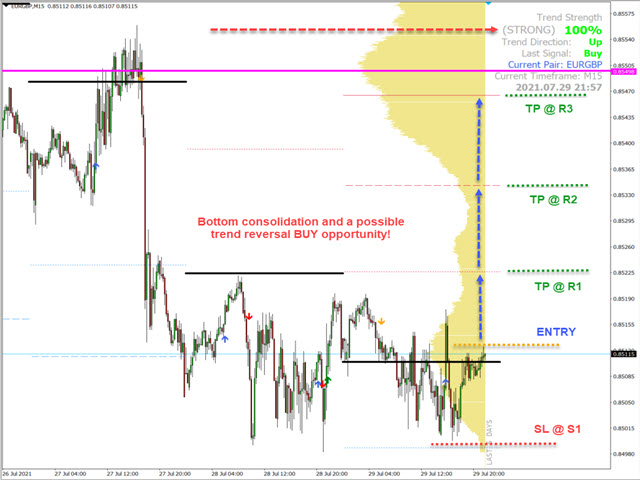
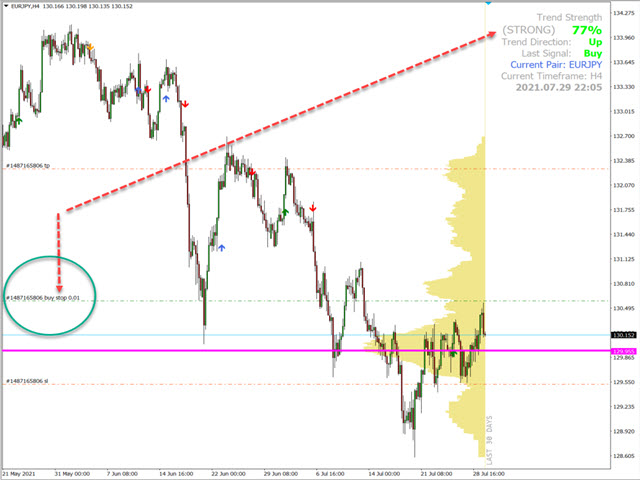
- PERFIL DE VOLUME DE MERCADO
- NÍVEIS DIÁRIOS DE PIVOTOS
- ANÁLISE DE CICLOS DE PREÇOS


O que é VOLUME PROFILE?

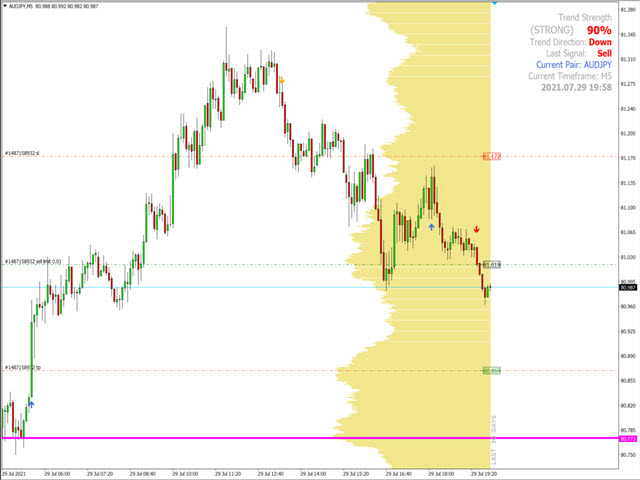
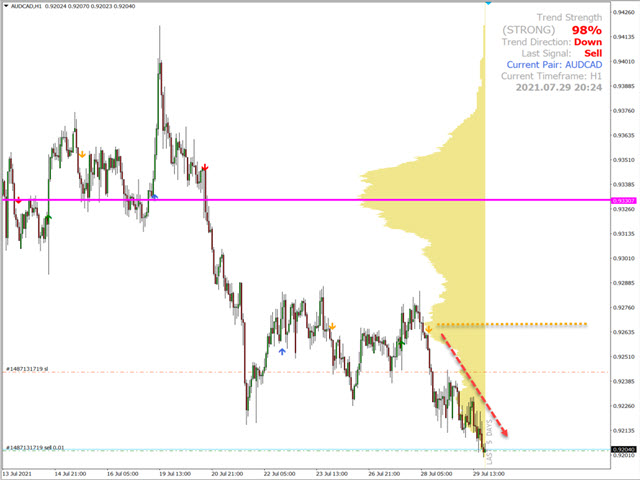
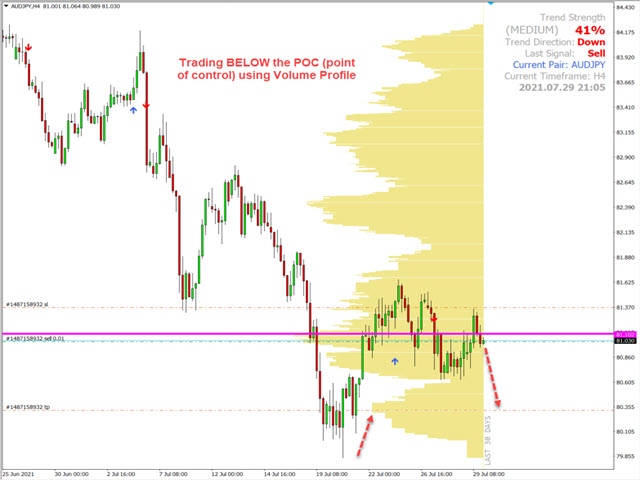
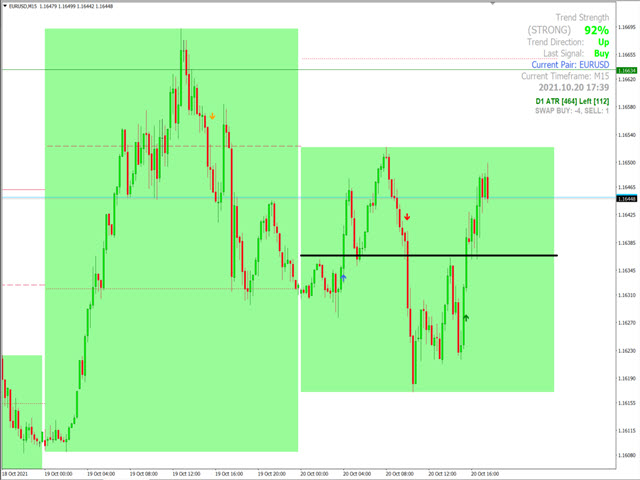
O Perfil de Volume é uma ferramenta de negociação muito útil que muitos traders ignoram - ele permite que você identifique os níveis de preços reais onde ocorreram ações importantes de preços. É semelhante aos níveis de suporte e resistência, mas com uma lógica diferente. O perfil de volume descreve os níveis reais de suporte e resistência onde o comércio institucional ocorreu. Não adivinhe mais! Você saberá exatamente quando todas as negociações pesadas ocorreram com muitos lotes e volume. O POC (ponto de controle) do perfil de volume irá mostrar exatamente onde isso aconteceu, desenhando uma linha em seu gráfico. POC é o nó de volume mais alto no perfil de volume. O ponto de controle é a barra de volume mais longa no perfil de volume e há muitos volumes transacionados lá. Os traders profissionais usam o POC como um forte suporte e resistência ou um importante ponto de reteste.

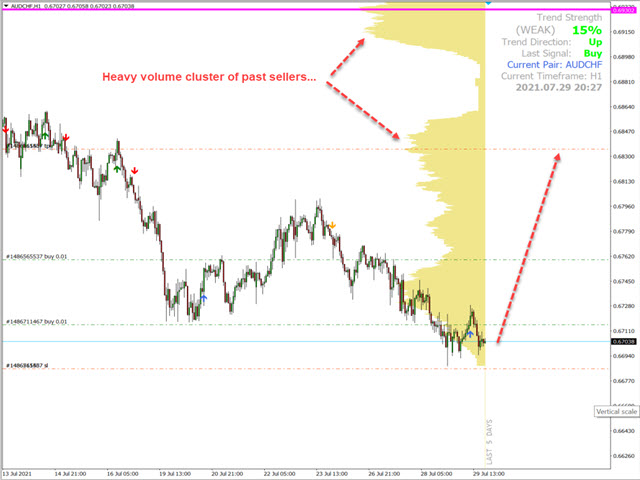
O Perfil de Volume (também chamado de Perfil de Mercado em alguns casos) é uma ferramenta útil para verificar a ação do preço em um gráfico. Uma das primeiras coisas que os traders marcam ao analisar um gráfico é o suporte e a resistência. O Perfil de Volume também pode ser usado para fazer isso. Não apenas o Perfil de Volume permite que você identifique níveis significativos de suporte e resistência, mas também destaca os preços onde houve forte ação de preço no passado (principalmente pelos comerciantes institucionais).

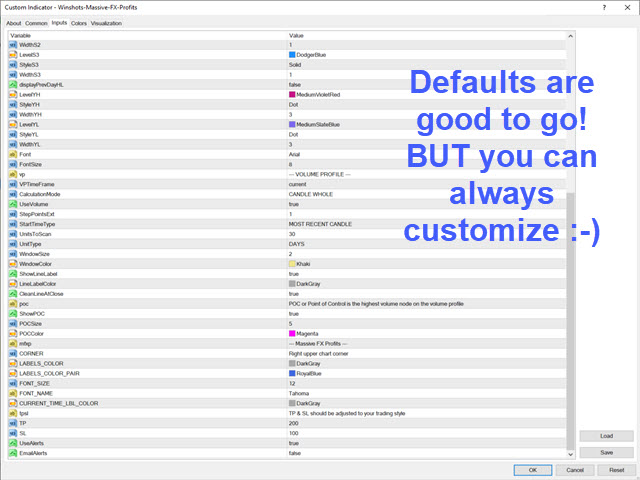
Saber que alguns preços tiveram atividade importante no passado pode ajudar significativamente a configurar negociações, stop-loss e take-profit para suas negociações futuras. O indicador verifica o número definido de barras anteriores e calcula o volume de atividade em cada nível de preço.

O resultado é apresentado por meio de um gráfico de histograma vertical - quanto maior o histograma, maior a atividade naquele nível de preço. Você pode definir o indicador para exibir o perfil de volume até a vela atual mais recente ou até alguma data anterior.

O que são níveis dinâmicos diários?

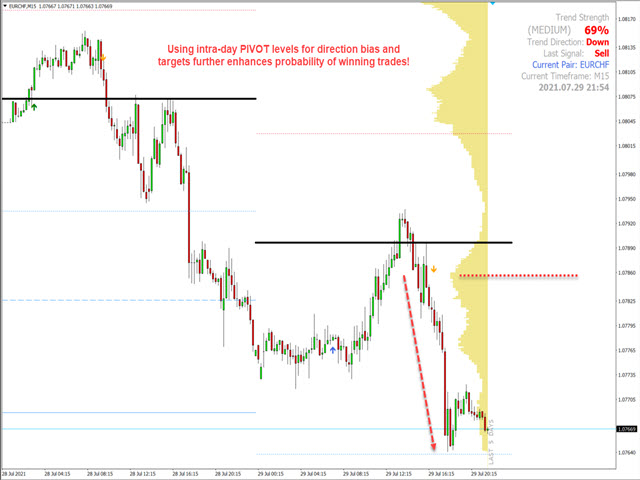
Um pivô é um nível de preço significativo conhecido com antecedência (com base na atividade de negociação do dia anterior) que os traders consideram importante e podem tomar decisões de negociação em torno desse nível. Como um indicador técnico, um preço pivô também é semelhante a um nível de resistência ou suporte. Se o nível do pivô for excedido, espera-se que o preço continue nessa direção ou poderá reverter nesse nível ou próximo a ele.

O que são ciclos de preços?

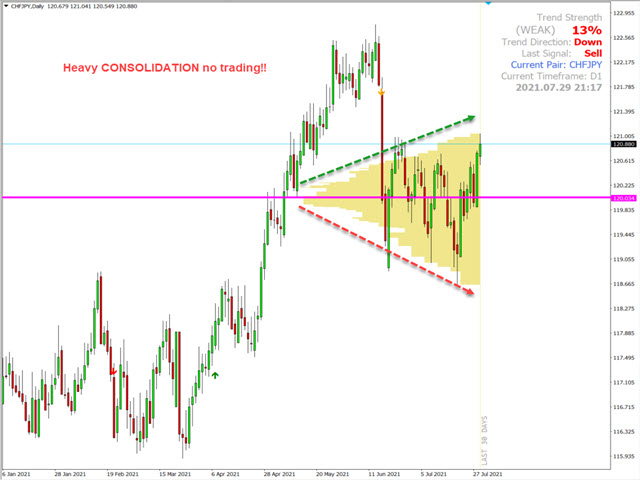
A maioria dos negociantes Forex bem-sucedidos acredita que os mercados têm um ciclo. Este ciclo é resultado do comportamento humano nos mercados. Como resultado desse comportamento humano inato, as tendências parecem se repetir no mercado. Se um trader pode traçar essas tendências e prever movimentos futuros, uma fortuna pode ser feita! A parte crítica aqui é reconhecer os diferentes estágios do mercado e em qual estágio você se encontra atualmente.

O indicador Winshots Massive FX Profits utiliza várias técnicas para analisar o movimento dos preços e determinar seus ciclos de preços. Essa análise é feita separadamente em seu gráfico sempre que você muda para um novo período de tempo. Isso torna o Winshots Massive FX Profits ideal para escalpelamento intradiário, bem como para negociação de swing.

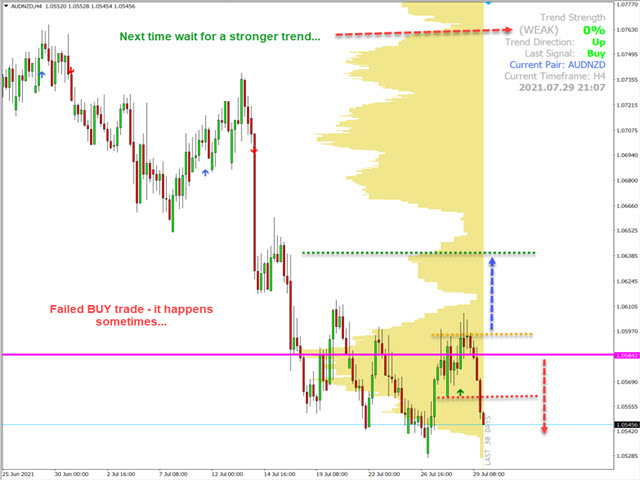
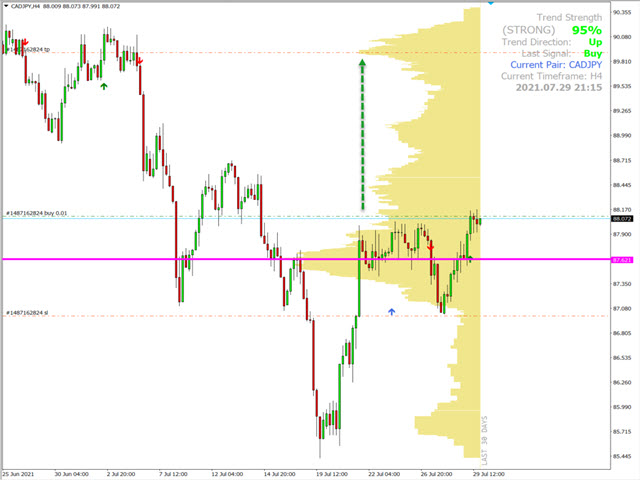
Com a ajuda do indicador Winshots Massive FX Profits, você poderá realmente VER com um alto grau de probabilidade qual pode ser o próximo movimento institucional!
Produtos recomendados
Este indicador é um indicador de análise automática de onda perfeito para negociação prática! A definição padronizada da banda não é mais uma onda de pessoas diferentes, e o desenho de interferências feitas pelo homem é eliminado, o que desempenha um papel fundamental na análise rigorosa da abordagem. =》Increase the choice of international style mode, (red fall green rise style)             Atualmente comprando desconto!   Conteúdo do índice: 1         Onda básica:   Primeiro, encontram
If you are using volume spread analysis, whether your are a beginner or an expert, this system will give you a lot of features and help in your analysis. Please watch the video to see all the features. Features With one click you will find all the VSA patterns on your chart . Bars without opening price. Easy to read volume indicator. Bar reader (Bar type - Close type - Volume type - Spread type). Daily and weekly levels (Pivot - Camarilla - Fibo). Very light on the trading platform and moving
American Hunters
Mehmet Ozhan Hastaoglu
This indicator guides you like a hunter. Tacheprofit and StopLoss levels. See the difference in the experiment. Works in all periods. Works at all rates. You can win with this system. The crossing of the mean and the re-test were done according to the rule. You can see the transactions by moving backwards on the strategy test screen. The whole system is automatically calculated.
To get access to MT5 version please click   here . This is the exact conversion from TradingView: QQE MT4 Glaz-modified by JustUncleL This is a light-load processing and non-repaint indicator. All input options are available. This is not a multi time frame indicator. Buffers are available for processing in EAs. You can message in private chat for further changes you need.
Market Profile
Artem Titarenko
5 (1)
The "Market Profile" indicator displays the profiles and volumes of periods – weekly, daily, session (8-hour), 4-hour, hour, summary. The VAH/VAL price area is automatically highlighted by a dotted line for each profile (except for the summary). The indicator includes chroma Delta, which colors the profile areas. The areas of prevailing Buys is colored in green, that of Sells - in red. The intensity histogram features blue/red respectively. In the filter mode, the indicator displays the volume a
Introduction This indicator detects volume spread patterns for buy and sell opportunity. The patterns include demand and supply patterns. You might use each pattern for trading. However, these patterns are best used to detect the demand zone (=accumulation area) and supply zone (=distribution area). Demand pattern indicates generally potential buying opportunity. Supply pattern indicates generally potential selling opportunity. These are the underlying patterns rather than direct price action. T
Market Structure Zig Zag
Lesedi Oliver Seilane
4.8 (25)
Free Market structure zig zag to assist in price action trading the screenshots describe how to use and how to spot patterns new version comes with alerts, email alert and  push notification alert can be used on all pairs  can be used on all timeframes  you can add additional confirmation indicators the indicator shows you your higher high and low highs as well as your lower lows and lower highs  the indication makes price action analysis easier to spot.
FREE
Gioteen Volatility Index (GVI)   - your ultimate solution to overcoming market unpredictability and maximizing trading opportunities. This revolutionary indicator helps you in lowering your losing trades due to choppy market movements. The GVI is designed to measure market volatility, providing you with valuable insights to identify the most favorable trading prospects. Its intuitive interface consists of a dynamic red line representing the volatility index, accompanied by blue line that indicat
The Trend Professor is a moving average based indicator designed for the purpose of helping the community of traders to analyse the price trend. The indicator will be displayed in the main chart as it is indicated on the screenshot section. How it works The indicator has lines of moving averages and colored histograms to depict the direction of the trend. There will be a fast signal line colored blue/yellow/red at some points. The red/yellow colored lines stands for bearish trend/signal while th
Dear traders I am happy to introduce to you my new tool called "Brilliant Oscillator" Indicator. This is one of the indicators that can be used as a stand alone indicator. WHAT I LIKE ABOUT THIS TOOL IS Fast and reliable signals Purpose The purpose of this tool is to assist both newbie and Advanced traders to analyze the market with high level of accuracy in both bearish and bullish market trends. The inputs In the input section you will be able to change colors of the indicator only. Currency p
The SPV Volatility indicator is one of the most effective filters. Volatility filter. Shows three volatility options. The so-called limit, real, and the last most effective filter for the filter is the percentage filter. Percentage display of folatility shows the ratio of limit to real volatility. And thus, if we trade in the middle of the channel, then it is necessary to set a condition that the percentage is less than a certain indicator value. If we trade on the channel breakout - following t
Indicator for binary options arrow is easy to use and does not require configuration works on all currency pairs, cryptocurrencies buy signal blue up arrow sell signal red down arrow tips do not trade during news and 15-30 minutes before their release, as the market is too volatile and there is a lot of noise it is worth entering trades one or two candles from the current period (recommended for 1 candle) timeframe up to m 15 recommended money management fixed lot or fixed percentage of the depo
-   Real price is 70$   - 50% Discount ( It is 35$ now ) Contact me for instruction, any questions! Introduction A flag can be used as an entry pattern for the continuation of an established trend. The formation usually occurs after a strong trending move. The pattern usually forms at the midpoint of a full swing and shows the start of moving. Bullish flags can form after an uptrend, bearish flags can form after a downtrend. Flag Pattern Scanner Indicator It is usually difficult for a trade
hint: my basic indicators are used like that KingLevel combind with KingSequence will provides basic insights of the price action of the markets and KingSequenceSgn is just for the convienent for watching. And plus with Forex Trading mentor subsccription I will assist you to win the market at first later if it's great will be upgraded to King Forex trading mentor. Introducing the K-Level Indicator: A Powerful Tool for Unveiling Hidden Trading Opportunities In the dynamic world of trading, i
Diamond PRO
Fanur Galamov
5 (15)
Diamond PRO is enhanced powerful version of Diamond for advanced traders. Pro version includes optimized cores, new impoved entry points filters, new multistage profit closure algorithm and сontains number of external control parameter that allows build and fine tune own tradind decisions and algorithms. The system provides more accurate market entries, analyzes and filters upcoming economic news, contains spread protection and an advanced position management algorithm. Main goal of Diamond PRO
Daily Candle Predictor é um indicador que prevê o preço de fechamento de uma vela. O indicador destina-se principalmente ao uso em gráficos D1. Este indicador é adequado tanto para negociação forex tradicional quanto para negociação de opções binárias. O indicador pode ser usado como um sistema de negociação autônomo ou pode atuar como um complemento ao seu sistema de negociação existente. Este indicador analisa a vela atual, calculando certos fatores de força dentro do próprio corpo da vela, be
ABCD Harmonic Patterns
Mehmet Ozhan Hastaoglu
Thanks to this indicator, you can easily see the new ABCD harmonic patterns in the chart. If the two price action lengths are equal, the system will give you a signal when it reaches the specified level. You can set the limits as you wish. For example, You can get the signal of the price, which occurs in the Fibonaci 38.2 and 88.6 retracements, and then moves for the same length, at the level you specify. For example, it will alarm you when the price reaches 80% as a percentage. In vertic
Blahtech Market Profile
Blahtech Limited
4.61 (18)
Was: $249  Now: $99   Market Profile defines a number of day types that can help the trader to determine market behaviour. A key feature is the Value Area, representing the range of price action where 70% of trading took place. Understanding the Value Area can give traders valuable insight into market direction and establish the higher odds trade. It is an excellent addition to any system you may be using. Blahtech Limited presents their Market Profile indicator for the MetaTrader community. Ins
Prosecution
Andriy Sydoruk
Prosecution is a Forex arrow indicator that tracks the market trend, ignoring sharp market fluctuations and noise around the average price. The indicator is created on the basis of a special algorithm, and based on the developed algorithm, signals are created that allow you to track the trend and see its beginning and end, especially when several timeframes are combined to refine the signal. The arrows show the direction of the deal, and are colored accordingly, which can be seen in the screensh
Strong Retracement Points Pro demo edition! SRP (Strong Retracement/Reversal Points) is a powerful and unique support and resistance indicator. It displays the closest important levels which we expect the price retracement/reversal! If all level are broken from one side, it recalculates and draws new support and resistance levels, so the levels might be valid for several days depending on the market! If you are still hesitating to start using this wonderful tool, you can check this link to see h
Infinity Trend Pro
Yaroslav Varankin
1 (1)
This is a trend indicator without redrawing Developed instead of the binary options strategy (by the color of the Martingale candlestick) Also works well in forex trading When to open trades (binary options) A signal will appear in the place with a candle signaling the current candle It is recommended to open a deal for one candle of the current timeframe M1 and M5 When a blue dot appears, open a deal up When a red dot appears, open a trade down. How to open trades on Forex. When a signal is rec
Trade History Drawer
David Leander Tschacher
Trade History Drawer is an indicator for MetaTrader 4. It shows trades on the chart and draws them in customized colors. Furthermore, the indicator shows a trade summary and saves a CSV history file for either one selected pair or all pairs. Inputs General Settings Number Trades : Number of trades to be drawn on the chart, if -1 then all trades Magic Number : Only trades with this magic number, if -1 then ignore Line Style : Line Style Line Thickness : Line Thickness Arrow Size :
Black series MT4
Dmitriy Kashevich
1 (1)
Black series MT4 - The indicator is designed for trading on binary options with Timeframe M1-M5-M15 Multicurrency (Works on cryptocurrency and currency pairs) The signal appears when the candle opens Up to 90% correct signals There is no signal redrawing at all Can be used with other indicators. Good for scalping! In Settings there is: -Indicator working methods -I Allert Arrow color Red signal down Blue signal up Also watch the video how the indicator works and signals
Night ghost
Dmitriy Kashevich
Night Ghost - Indicador de seta para opções binárias. Este é um assistente confiável para você no futuro! - Sem redesenho no gráfico -Funciona muito bem em todos os pares de moedas! -Precisão do indicador de até 90% (especialmente à noite) -Não há necessidade de configurar por um longo tempo (Configurar perfeitamente para Opções Binárias) - Sem sinais de atraso - O aparecimento de um sinal na vela atual -Perfeito para o período M1 (não mais!) - Cor de vela amigável aos olhos
Urgently
Tatiana Savkevych
The Urgently indicator is designed to quickly determine the situation in the market, reflect the state of the market and signal profitable levels for opening trades. Market conditions change quickly enough, requiring constant calibration of trading strategies. Recommended for use in conjunction with any of the oscillators. The Urgently forex market trend indicator shows the trend direction and entry points. It smooths out price fluctuations when generating a signal by averaging the data and the
The principle of this indicator is very simple: detecting the trend with Moving Average, then monitoring the return point of graph by using the crossing of Stochastic Oscillator and finally predicting BUY and SELL signal with arrows, alerts and notifications. The parameters are fixed and automatically calculated on each time frame. Example: If you install indicator on EURUSD, timeframe M5: the indicator will detect the main trend with the Moving Average on this timeframe (for example the Moving
The  RSI Basket Currency Strenght  brings the RSI indicator to a new level.  Expanding the boundaries of TimeFrames and mono-currency analysis, the RSI Multi Time Frame Currency Strenght take the movements of each currency that composes the cross and confront them in the whole basket of 7 crosses.  The indicator works with any combination of  AUD, CAD, CHF, EUR, GBP, JPY, NZD, USD  pairs and with full automation takes in account every RSI value for the selected Time Frame.  After that, the ind
To get access to MT5 version please contact via private message. This is the exact conversion from TradingView:Nadaraya-Watson Envelope" by " LuxAlgo ". This is not a light-load processing indicator. It is a REPAINT indicator. All input options are available.  Buffers are available for processing in EAs. You can message in private chat for further changes you need. Thanks.
Introduction to Chart Pattern MT Chart Pattern MT is a chart pattern scanner to detect the triangle pattern, falling wedge pattern, rising wedge pattern, channel pattern and so on. Chart Pattern MT uses highly sophisticated chart pattern detection algorithm. However, we have designed it in the easy to use with intuitive user interface. Chart Pattern MT will show all the patterns in your chart in the most efficient format for your trading. You do not have to do tedious manual pattern detection an
Trend Line Chart Pattern Signals  Is a traders Tool for Signals based on Strong  Patterns Formed By a pair of robust trend lines. They FOR WITH DIFFERENT POPULAR PATTERNS ON CHARTS LIKE – TRIANGLES, FLAGS,RANGE , ASCENDING TRIANGLES, DESCENDING PATTERNS, PENNANTS ETC. The TREND LINES  form  dynamically  on running bars. The  sensitivity  of the trend lines can be changed by custom settings. The  Buy and Sell Signals Generate upon Break Of the Trend Line + "Close" of the same bar above the previo
Os compradores deste produto também adquirem
Gann Made Easy
Oleg Rodin
4.93 (70)
Gann Made Easy é um sistema de negociação Forex profissional e fácil de usar, baseado nos melhores princípios de negociação usando a teoria do sr. W. D. Gann. O indicador fornece sinais precisos de COMPRA e VENDA, incluindo níveis de Stop Loss e Take Profit. Você pode negociar mesmo em movimento usando notificações PUSH. Entre em contato comigo após a compra! Vou compartilhar minhas dicas de negociação com você e ótimos indicadores de bônus de graça! Provavelmente você já ouviu muitas vezes sobr
Atomic Analyst
Issam Kassas
5 (3)
Primeiramente, vale ressaltar que este Indicador de Negociação não repinta, não redesenha e não apresenta atrasos, tornando-o ideal tanto para negociação manual quanto automatizada. Manual do utilizador: configurações, entradas e estratégia. O Analista Atômico é um Indicador de Ação de Preço PA que utiliza a força e o momentum do preço para encontrar uma vantagem melhor no mercado. Equipado com filtros avançados que ajudam a remover ruídos e sinais falsos, e aumentam o potencial de negociação.
Scalper Inside PRO
Alexey Minkov
4.75 (57)
An exclusive indicator that utilizes an innovative algorithm to swiftly and accurately determine the market trend. The indicator automatically calculates opening, closing, and profit levels, providing detailed trading statistics. With these features, you can choose the most appropriate trading instrument for the current market conditions. Additionally, you can easily integrate your own arrow indicators into Scalper Inside Pro to quickly evaluate their statistics and profitability. Scalper Inside
ACTUALMENTE COM 26% DE DESCONTO A melhor solução para qualquer novato ou comerciante especializado! Este Indicador é uma ferramenta comercial única, de alta qualidade e acessível, porque incorporámos uma série de características proprietárias e uma nova fórmula. Com apenas UM gráfico, pode ler a força da moeda para 28 pares de Forex! Imagine como a sua negociação irá melhorar porque é capaz de apontar o ponto exacto do gatilho de uma nova tendência ou oportunidade de escalada? Manual do u
TPSpro RFI Levels
Roman Podpora
4.8 (15)
Reversal First Impulse levels (RFI)    INSTRUCTIONS        RUS       -       ENG              R ecommended to use with an indicator   -   TREND PRO -  Version MT5 A key element in trading is zones or levels from which decisions to buy or sell a trading instrument are made. Despite attempts by major players to conceal their presence in the market, they inevitably leave traces. Our task was to learn how to identify these traces and interpret them correctly. Main functions: Displaying active zones
Trend Punch
Mohamed Hassan
5 (6)
Manual guide:   Click here WEEKEND PROMO of  $79!  -- Next price is  $149 .  This indicator is unstoppable when combined with our other indicator called  Support & Resistance . After purchase, send us a message and you will get it   for  FREE as a BONUS! I like to use Trend Punch on XAUUSD on the M1 timeframe!  Introducing Trend Punch , the revolutionary forex trend indicator that will transform the way you trade! Trend Punch is uniquely designed to provide precise buy and sell arr
TPSproTREND PrO
Roman Podpora
4.78 (18)
TPSpro TRENDPRO  - is a trend indicator that automatically analyzes the market and provides information about the trend and each of its changes, as well as giving signals for entering trades without redrawing! The indicator uses each candle, analyzing them separately. referring to different impulses - up or down impulse. Exact entry points into transactions for currencies, crypto, metals, stocks, indices!  -  Version MT5               DETAILED DESCRIPTION                R ecommended to use with
Gold Stuff
Vasiliy Strukov
4.89 (257)
Gold Stuff-um indicador de tendência projetado especificamente para o ouro, também pode ser usado em qualquer instrumento financeiro. O indicador não é redesenhado ou atrasado. O timeframe recomendado é H1. O EA Gold Stuff Expert Advisor está escrito neste indicador, você pode encontrá-lo no meu perfil. Importante! Entre em contato comigo imediatamente após a compra para obter instruções e bônus!  Você pode obter uma cópia gratuita do nosso indicador Strong Support e Trend Scanner, envie um
TrendMaestro
Stefano Frisetti
5 (3)
note: this indicator is for METATRADER4, if you want the version for METATRADER5 this is the link:  https://www.mql5.com/it/market/product/108106 TRENDMAESTRO ver 2.4 TRENDMAESTRO recognizes a new TREND in the bud, he never makes mistakes. The certainty of identifying a new TREND is priceless. DESCRIPTION TRENDMAESTRO identifies a new TREND in the bud, this indicator examines the volatility, volumes and momentum to identify the moment in which there is an explosion of one or more of these data a
Advanced Supply Demand
Bernhard Schweigert
4.92 (311)
Atualmente com 33% de desconto! A melhor solução para qualquer Trader Novato ou especialista! Este indicador é uma ferramenta de negociação exclusiva, de alta qualidade e acessível porque incorporamos uma série de recursos proprietários e uma nova fórmula. Com esta atualização, você poderá mostrar fusos horários duplos. Você não só será capaz de mostrar um TF mais alto, mas também mostrar ambos, o TF do gráfico, MAIS o TF mais alto: MOSTRANDO ZONAS ANINHADAS. Todos os traders de Oferta e Demanda
FX Volume
Daniel Stein
4.6 (35)
Receba a sua atualização diária do mercado com detalhes e screenshots através do nosso Morning Briefing aqui no mql5 e no Telegram ! O Volume FX é o PRIMEIRO e ÚNICO indicador de volume que fornece uma visão REAL do sentimento do mercado do ponto de vista de um corretor. Ele fornece uma visão incrível de como os participantes do mercado institucional, como corretores, estão posicionados no mercado Forex, muito mais rápido do que os relatórios COT. Ver essas informações diretamente no seu gráfi
O sistema PRO Renko é um sistema de negociação altamente preciso especialmente concebido para a negociação de gráficos RENKO. Trata-se de um sistema universal que pode ser aplicado a vários instrumentos de negociação. O sistema neutraliza eficazmente o chamado ruído de mercado, dando-lhe acesso a sinais de inversão precisos. O indicador é muito fácil de usar e tem apenas um parâmetro responsável pela geração de sinal. Você pode facilmente adaptar a ferramenta a qualquer instrumento de negoc
Gann Swing Structure
Kirill Borovskii
5 (1)
This indicator is based on the mathematics of the great trader W.D. Ganna. With its help, you can easily find strong levels by analyzing swings to find the optimal entry point. The indicator works on all instruments and all timeframes. The indicator is fully manual and has control buttons. All you need to do is press the NEW button, a segment will appear, which you can place on any movement, swing or even 1 candle that you want to analyze. By placing the segment, press the OK button. A grid (th
Break and Retest
Mohamed Hassan
4.33 (12)
New update to V.4 where  Break & Retest automatically draws the take profit & stop loss levels and you also have more signals per day! ‍You can visually backtest Break & Retest to see how it behaved in the past!     Manual guide:   Click here $60 for a very limited time. Next price is $120   This Indicator only places quality trades when the market is really in your favor with a clear break and retest. Patience is key with this price action strategy! If you want more alert s
M1 Arrow
Oleg Rodin
5 (14)
Uma estratégia intradiária baseada em dois princípios fundamentais do mercado. O algoritmo é baseado na análise de volumes e ondas de preços usando filtros adicionais. O algoritmo inteligente do indicador dá um sinal apenas quando dois fatores de mercado se combinam em um. O indicador calcula ondas de um determinado intervalo no gráfico M1 usando os dados do período de tempo mais alto. E para confirmar a onda, o indicador utiliza a análise por volume. Este indicador é um sistema de negociação pr
Scalper Vault
Oleg Rodin
5 (29)
Scalper Vault é um sistema profissional de escalpelamento que fornece tudo o que você precisa para um escalpelamento bem-sucedido. Este indicador é um sistema de negociação completo que pode ser usado por comerciantes de forex e opções binárias. O período de tempo recomendado é M5. O sistema fornece sinais de seta precisos na direção da tendência. Ele também fornece sinais superiores e inferiores e níveis de mercado Gann. Os indicadores fornecem todos os tipos de alertas, incluindo notificações
FX Power MT4 NG
Daniel Stein
5 (10)
Receba a sua atualização diária do mercado com detalhes e screenshots através do nosso Morning Briefing aqui no mql5 e no Telegram ! O FX Power MT4 NG é a próxima geração do nosso medidor de força de moeda muito popular de longa data, o FX Power. E o que é que este medidor de força da próxima geração oferece? Tudo o que adorou no FX Power original MAIS Análise de força GOLD/XAU Resultados de cálculo ainda mais precisos Períodos de análise configuráveis individualmente Limite de cálculo personal
Actualmente 20% OFF ! A melhor solução para qualquer novato ou comerciante especializado! Este software de painel de instrumentos está a funcionar em 28 pares de moedas. É baseado em 2 dos nossos principais indicadores (Advanced Currency Strength 28 e Advanced Currency Impulse). Dá uma grande visão geral de todo o mercado Forex. Mostra valores avançados de força da moeda, velocidade de movimento da moeda e sinais para 28 pares de divisas em todos os (9) períodos de tempo. Imagine como a sua
Dragon Multi Indicator MT4
Mansour Babasafary
5 (4)
3 Indicators in 1 indicator Strategy based on price action Made specifically for the best forex currency pairs Can be used in the best time frame of the market at a very reasonable price This indicator is basically 3 different indicatos . But we have combined these 3 indicators in 1 indicator so that you can use 3 indicators at the lowest price. All three strategies are based on price action. But based on different trends. Long term, medium term and short term Attributes : No repaintin
TrendDecoder Premium
Christophe Pa Trouillas
5 (5)
Identifica os intervalos e os próximos movimentos prováveis   |  Obter os primeiros sinais e a força das tendências   |  Obter saídas claras antes da reversão   |  Detetar os níveis Fibo que o preço irá testar Indicador não repintável e não atrasado - ideal para trading manual e automatizado - adequado para todos os activos e todas as unidades de tempo Oferta por tiempo limitado >>   50% OFF Após a compra,   por favor contacte-me neste canal  para obter as definições recomendadas Versão   MT5 :
Descubra o segredo da negociação forex bem -sucedida com nosso indicador MT4 personalizado! Você já se perguntou como obter sucesso no mercado de Forex, obtendo lucros consistentemente e minimizando o risco? Aqui está a resposta que você está procurando! Permita -nos apresentar nosso indicador proprietário do MT4 que revolucionará sua abordagem à negociação. Versatilidade única Nosso indicador foi projetado especialmente para usuários que preferem as formações de vela Renko e Rangebar. En
Trend Screener
STE S.S.COMPANY
4.83 (88)
Indicador de tendência, solução única inovadora para negociação e filtragem de tendências com todos os recursos de tendências importantes construídos dentro de uma ferramenta! É um indicador multi-timeframe e multi-moedas 100% sem repintura que pode ser usado em todos os símbolos/instrumentos: forex, commodities, criptomoedas, índices e ações. O Trend Screener é um indicador eficiente que segue a tendência do indicador que fornece sinais de tendência de seta com pontos no gráfico. Os recursos qu
PZ Trend Trading
PZ TRADING SLU
4.75 (4)
O Trend Trading é um indicador projetado para lucrar o máximo possível com as tendências que ocorrem no mercado, cronometrando retrocessos e rupturas. Ele encontra oportunidades de negociação analisando o que o preço está fazendo durante as tendências estabelecidas. [ Guia de instalação | Guia de atualização | Solução de problemas | FAQ | Todos os produtos ] Negocie mercados financeiros com confiança e eficiência Lucre com as tendências estabelecidas sem ser chicoteado Reconhecer retrocesso
Full Forex Market View Dashboard
Opengates Success International
5 (2)
Indicador de painel de visão de mercado FOREX COMPLETO Este é um indicador personalizado criado para dar aos Traders uma visão completa do que está acontecendo no mercado. Ele usa dados em tempo real para acessar o mercado e exibir todas as informações necessárias para fazer uma negociação bem-sucedida. INSTALAÇÃO: Antes de anexar este indicador ao seu gráfico de janela, vá para o painel Market Watch do seu MT4 e OCULTE todos os pares de moedas que você não precisa ou negocie e deixe o
ECM Channel MT4
Paulo Rocha
5 (1)
ECM Elite Channel é um indicador baseado na volatilidade, desenvolvido com um algoritmo de tempo especifico, que consiste em encontrar possíveis correções no mercado. Este indicador mostra duas linhas exteriores, uma interior (linha de retração) e um sinal de seta, onde a teoria do canal consiste em ajudar a identificar condições de sobrecompra e sobrevenda no mercado. O preço do mercado cairá geralmente entre os limites do canal. Se os preços tocarem ou se moverem para fora do canal é uma
Apresentando       Quantum Trend Sniper Indicator   , o inovador Indicador MQL5 que está transformando a maneira como você identifica e negocia as reversões de tendência! Desenvolvido por uma equipe de traders experientes com experiência comercial de mais de 13 anos,       Indicador de Atirador de Tendência Quântica       foi projetado para impulsionar sua jornada de negociação a novos patamares com sua forma inovadora de identificar reversões de tendência com precisão extremamente alta. ***C
ACTUALMENTE 31% DE DESCONTO!! A melhor solução para qualquer novato ou comerciante especializado! Este indicador é uma ferramenta comercial única, de alta qualidade e acessível, porque incorporámos uma série de características proprietárias e uma fórmula secreta. Com apenas UM gráfico, dá alertas para todos os 28 pares de moedas. Imagine como a sua negociação irá melhorar porque é capaz de identificar o ponto exacto de desencadeamento de uma nova tendência ou oportunidade de escalada! Con
Currency Strength Wizard é um indicador muito poderoso que fornece uma solução completa para uma negociação bem-sucedida. O indicador calcula o poder deste ou daquele par forex usando os dados de todas as moedas em vários intervalos de tempo. Esses dados são representados em uma forma de índice de moeda fácil de usar e linhas de energia de moeda que você pode usar para ver o poder desta ou daquela moeda. Tudo o que você precisa é anexar o indicador ao gráfico que deseja negociar e o indicador mo
Italo Levels Indicator
Italo Santana Gomes
5 (8)
BUY INDICATOR AND GET EA FOR FREE AS A BONUS + SOME OTHER GIFTS! ITALO LEVELS INDICATOR  is the best levels indicator ever created, and why is that? Using high volume zones on the market and Fibonacci the Indicator works on all time-frames and assets, indicator built after 7 years of experience on forex and many other markets. You know many levels indicators around the internet are not complete, does not help, and it's difficult to trade, but the   Italo Levels Indicator is different , the Ital
ICT, SMC, SMART MONEY CONCEPTS, SMART MONEY, Smart Money Concept, Support and Resistance, Trend Analysis, Price Action, Market Structure, Order Blocks, BOS/CHoCH,   Breaker Blocks ,  Momentum Shift,   Supply&Demand Zone/Order Blocks , Strong Imbalance, HH/LL/HL/LH,    Fair Value Gap, FVG,  Premium  &   Discount   Zones, Fibonacci Retracement, OTE, Buy Side Liquidity, Sell Side Liquidity, BSL/SSL Taken, Equal Highs & Lows, MTF Dashboard, Multiple Time Frame, BigBar, HTF OB, HTF Market Structure, 
Mais do autor
Objetivo: A função deste indicador é desenhar 3 linhas de médias móveis (MA) no gráfico de preços MT4 principal. Os MAs são de 3 prazos diferentes especificados pelo usuário, independentemente do gráfico que está sendo exibido no momento. Quando você alterna a visualização do gráfico em diferentes intervalos de tempo, os 3 MAs continuarão a exibir as linhas do MA para os intervalos de tempo especificados nas propriedades. Exemplo: As configurações padrão mapeiam três MAs de 50 barras
FREE
The parabolic stop and reverse (PSAR) indicator was developed by J. Welles Wilder, Jr. as a tool to find price reversals which can be utilized as stop-loss levels as well as trade triggers. The notable difference about the PSAR indicator is the utilization of time decay. The PSAR indicator forms a parabola composed of small dots that are either above or below the trading price. When the parabola is below the stock price, it acts as a   support   and trail-stop area, while indicating bullish up t
FREE
Winshots ADX Trend
Pawel Michalowski
5 (1)
Negociar na direção de uma tendência forte reduz o risco e aumenta o potencial de lucro. Em geral, o índice direcional médio (ADX) é usado para determinar quando o preço está tendendo fortemente. Em muitos casos, é o indicador de tendência final! Afinal, a tendência pode ser sua amiga, mas com certeza ajuda saber quem são seus amigos. ADX é usado para quantificar a força da tendência. Os cálculos do ADX são baseados em uma média móvel de expansão da faixa de preço em um determinado período de
O que é um Pivot? Um pivô é um nível de preço significativo conhecido de antemão, que os traders consideram importante e podem tomar decisões de negociação em torno desse nível. Como um indicador técnico, um preço pivô é semelhante a um nível de resistência ou suporte. Se o nível do pivô for excedido, o preço deverá continuar nessa direção. Ou o preço pode reverter nesse nível ou perto dele. O que um pivô lhe diz? Existem pivôs e pontos de pivô. Esses termos podem significar coisas difere
Negociar na direção de uma tendência forte reduz o risco e aumenta o potencial de lucro. Em geral, o índice direcional médio (ADX) é usado para determinar quando o preço está tendendo fortemente. Em muitos casos, é o indicador de tendência final! Afinal, a tendência pode ser sua amiga, mas com certeza ajuda saber quem são seus amigos. ADX é usado para quantificar a força da tendência. Os cálculos do ADX são baseados em uma média móvel de expansão da faixa de preço em um determinado período de
The Qualitative Quantitative Estimation (QQE) indicator is a technical analysis tool developed for the MetaTrader 4 (MT4) trading platform. It is designed to help traders identify potential trend reversals and to determine the strength of a current trend. The QQE indicator is calculated based on the Relative Strength Index (RSI) and Moving Average (MA) indicators. The RSI is used to determine the momentum of price movements, while the MA is used to smooth out the price data and identify trends.
Winshots Trade Assistant EA decides when to take the the first trade based on the H1 time frame and the Stochastic indicator.  It is there to assist you in deciding in which direction you should trade as well as managing all the trades you open on the same chart (it's very useful in scalping on lower time frames).  The first trade will always be 1 micro lot, and decision always based on the H1 time frame.  Then your job is to open further trades in the same direction as top ups MANUALLY. However
This indicator will help you identify the key zones needed for The Silver Bullet Strategy which are:  The three time-windows the ICT mentioned in the strategy Window 1: 3 AM and 4 AM New York time Window 2: 10 AM and 11 AM New York Time Window 3: 2 PM to 3 PM New York Time Bullish and bearish supply and demand zones which will help you identify FVG inside those time windows T he previous day's high and low, draw on liquidity The indicator does not plot the FVGs to avoid cluttering the chart  Exi
Filtro:
Sem comentários
Responder ao comentário
Versão 1.6 2024.03.18
In this version:
- bug fixes
- ATR optimization
- Daily trends optimization
Versão 1.5 2023.03.23
* indicator optimization based on live trading results since the previous release
* code fixes
Versão 1.4 2021.10.20
Added a D1 candle outline on lower timeframes (<D1) to keep a trader focused on the main D1 candle direction while intraday trading on lower time frames. This is especially helpful when scalping multiple instruments on lower time frames as it always keeps the trader in check and on the correct side of the daily trend.
Versão 1.3 2021.08.07
- Added an ability to HIDE volume profile if not needed
- Added a new function that allows you to monitor an ATR range (D1 TF by default) and it draws two lines for a dynamic upper and lower ATR range accounting for an already elapsed price movement (this feature allows you to set your targets more accurately, which do not exceed the specified ATR range)
Versão 1.2 2021.08.07
- polished up the property names and descriptions
- added a new feature for TP based on ATR(14); a trader can specify an ATR TP factor they would like to use (default is 1X current time frame ATR(14)