• Visão global
  • Comentários (1)
  • Discussão (4)
  • O que há de novo

Winshots ADX Trend

5
Negociar na direção de uma tendência forte reduz o risco e aumenta o potencial de lucro. Em geral, o índice direcional médio (ADX) é usado para determinar quando o preço está tendendo fortemente. Em muitos casos, é o indicador de tendência final! Afinal, a tendência pode ser sua amiga, mas com certeza ajuda saber quem são seus amigos.

ADX é usado para quantificar a força da tendência. Os cálculos do ADX são baseados em uma média móvel de expansão da faixa de preço em um determinado período de tempo. A configuração padrão é 14 bares, embora outros períodos de tempo possam ser usados. O ADX pode ser usado em qualquer instrumento de negociação, como pares forex, ações, fundos mútuos, fundos negociados em bolsa, futuros e criptografia.

ADX é plotado como uma única linha com valores variando de um mínimo de zero a um máximo de 100. ADX não é direcional; ele registra a força da tendência se o preço está tendendo para cima ou para baixo. O indicador ADX padrão é geralmente plotado na mesma janela que as duas linhas do indicador de movimento direcional (DMI), das quais o ADX é derivado.

No entanto, quando você usa o indicador ADX padrão, pode ficar um pouco confuso com todas as linhas ziguezagueando e cruzando. Não só isso, quando você muda para intervalos de tempo diferentes, as linhas ADX podem estar se cruzando em direções opostas, confundindo você ainda mais.

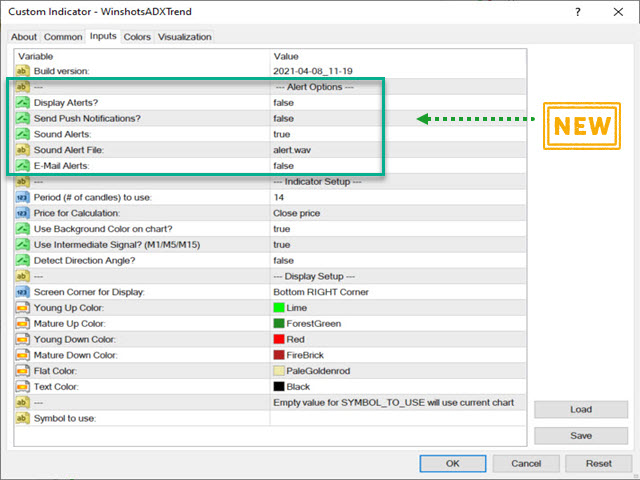
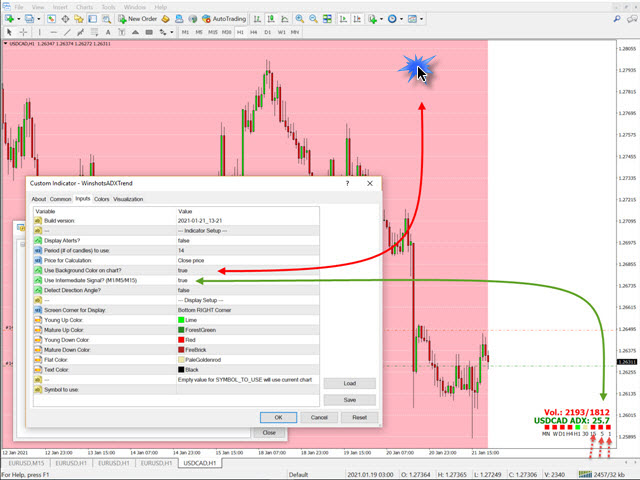
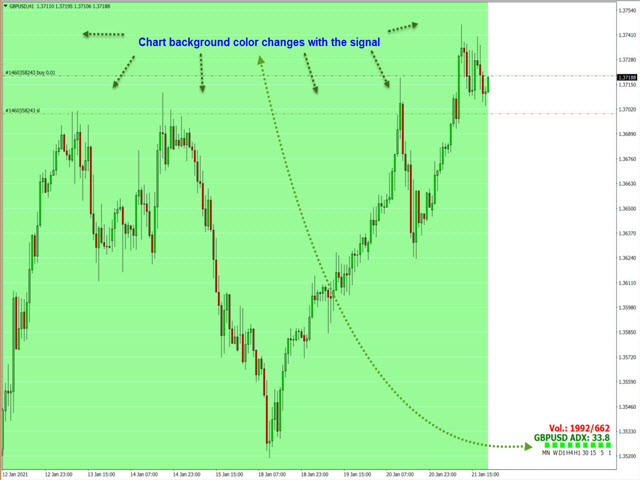
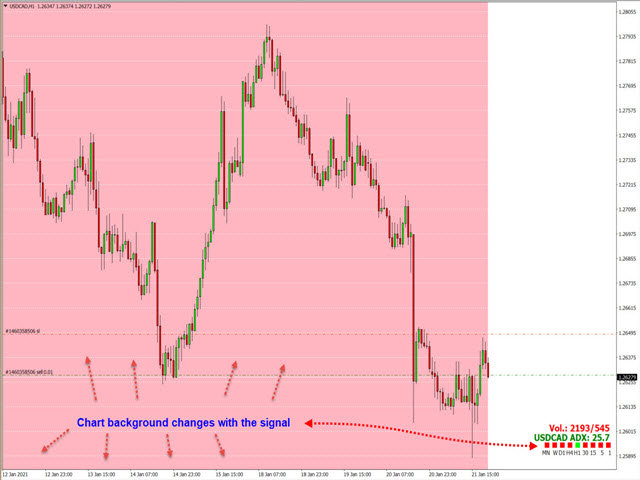
O indicador Winshots ADX Trend resolve este problema. Em uma visualização simples, você pode determinar rapidamente o estado da tendência ADX em todos os intervalos de tempo! Sim, você leu corretamente. Chega de clicar em diferentes intervalos de tempo olhando para as linhas ADX se cruzando em todas as direções como espaguete quente. Além de mostrar exatamente o que a tendência está em cada período de tempo, o indicador Winshots ADX Trend também mostra o volume dos gráficos atuais para a barra atual e anterior. Esse recurso adicional permite que você determine rapidamente se há um forte impulso no mercado e se vale a pena negociar durante o tempo escolhido.
Comentários 1
Matthew Kotecki
227
Matthew Kotecki 2021.03.30 11:41 
 

I would rate 5 stars but it has issues that need to be fixed, such as it spamming a pop alert for the same currency pair 5 or 6 times in less than 1min.it also constantly has repetitive notifications every second, as I close the pop-up notifications and then a few seconds later it appears again.it needs a time delay in minutes between sending each notification.

Can you add push notifications?

for the time being, I would not recommend this indicator for $30

4/12/20 Issues where addressed by developer so I update my rating to 5 stars

the only 1 request I have left it to be able to choose which time frames need to all align to get an alert. for example I want to get an alerts when M30 H1 H4 D1 all line up

I will update my review if he fixes these issues

Produtos recomendados
The indicator detects and displays Shark harmonic pattern (see the screenshot). The pattern is plotted by the extreme values of the ZigZag indicator (included in the resources, no need to install). After detecting the pattern, the indicator notifies of that by a pop-up window, a mobile notification and an email. The indicator highlights the process of the pattern formation and not just the complete pattern. In the former case, it is displayed in the contour triangles. After the pattern is comple
VR Cub
Vladimir Pastushak
VR Cub é um indicador para obter pontos de entrada de alta qualidade. O indicador foi desenvolvido para facilitar cálculos matemáticos e simplificar a busca por pontos de entrada em uma posição. A estratégia de negociação para a qual o indicador foi escrito tem provado a sua eficácia há muitos anos. A simplicidade da estratégia de negociação é a sua grande vantagem, o que permite que até mesmo os comerciantes novatos negociem com sucesso com ela. VR Cub calcula os pontos de abertura de posição e
The indicator displays the data of the Stochastic oscillator from a higher timeframe on the chart. The main and signal lines are displayed in a separate window. The stepped response is not smoothed. The indicator is useful for practicing "manual" forex trading strategies, which use the data from several screens with different timeframes of a single symbol. The indicator uses the settings that are identical to the standard ones, and a drop-down list for selecting the timeframe. Indicator Parame
The indicator detects and displays 3 Drives harmonic pattern (see the screenshot). The pattern is plotted by the extreme values of the ZigZag indicator (included in the resources, no need to install). After detecting the pattern, the indicator notifies of that by a pop-up window, a mobile notification and an email. The indicator highlights the process of the pattern formation and not just the complete pattern. In the former case, it is displayed in the contour triangles. After the pattern is com
This indicator is the undisputed leader among the indicators. And for this statement there is a good reason. The indicator builds a very high quality channel in which it generates signals to enter! What is the ideal strategy for the trader, since the trader always hesitates when choosing a strategy for the job. That is, this indicator will allow you to solve the dilemma of choosing a job by trend or to the channel, since it combines these two basic concepts. Working with the indicator is very
ZhiBiCCI MT4
Qiuyang Zheng
5 (1)
Os indicadores [ZhiBiCCI] são adequados para todo o ciclo de uso e também são adequados para todas as variedades do mercado. [ZhiBiCCI] Linha sólida verde é uma inversão da divergência de alta. A linha pontilhada verde é uma divergência de alta clássica. [ZhiBiCCI] A linha sólida para o vermelho é uma divergência de baixa reversa. A linha pontilhada vermelha é uma divergência clássica de baixa. [ZhiBiCCI] pode ser definido nos parâmetros (Alerta, Enviar e-mail, Enviar notificação), definid
RSX Signal 2 AM
Andriy Matviyevs'kyy
The indicator displays the signals of the RSX oscillator on the price chart. (To display these signals in a separate window, along with the oscillator, another indicator is used -  RSX Osc 4 AM ). It is optimal to use the indicator signals as signals to open a trade when the price overcomes the maximum or minimum of the bar at which the signal was given. An opposite signal cancels the previous signal. Settings: Data period for indicator calculation - data period for indicator calculation; Data
FREE
Este indicador inovador de medir a força das moedas da INFINITY é um assistente indispensável para cambistas e comerciantes que negociam em longo prazo. O sistema de análise de força / fraqueza das moedas é conhecido há muito tempo e é usado no mercado pelos principais traders do mundo. Qualquer negociação de arbitragem não está completa sem essa análise. Nosso indicador determina facilmente a força das moedas subjacentes em relação umas às outras. Ele exibe gráficos de linhas em todas ou no pa
Nice Trade Point
Muhammed Emin Ugur
This    Nice Trade Point     indicator is designed for signal trading. This indicator generates trend signals. It uses many algorithms and indicators to generate this signal. It tries to generate a signal from the points with the highest trend potential. This indicator is a complete trading product. This indicator does not need any additional indicators. The indicator certainly does not repaint. The point at which the signal is given does not change.     Features and Suggestions Time
Owl smart levels
Sergey Ermolov
4.63 (54)
Versão MT5  |  FAQ O   Indicador Owl Smart Levels   é um sistema de negociação completo dentro de um indicador que inclui ferramentas populares de análise de mercado, como   fractais avançados de Bill Williams , Valable ZigZag que constrói a   estrutura de onda correta   do mercado e   níveis de Fibonacci que marcam os níveis exatos de entrada no mercado e lugares para obter lucros. Descrição detalhada da estratégia Instruções para trabalhar com o indicador Consultor de negociação Owl Helper Ch
Lyne
Maksim Kalachev
About the Lyne indicator Lyne is a Metatrader 4 (MT4) indicator, the essence of which is to transform the accumulated historical data. The Lyne indicator makes it possible to detect various features and patterns in price dynamics that are invisible to the naked eye. Based on this information, traders can anticipate further price movement and adjust their strategy accordingly. This indicator has proven itself in the scalping strategy. The indicator works without repainting.
The CCI Divergence is a reasonably useful indicator in itself, but it is even more effective when used with divergence pattern trading. The CCI Divergence indicator signal is one of the most potent signals among the indicators that exist in the market. Here is new version for Divergence Indicator using CCI method, with more improvements. Divergences indicate a potential investment point because the directional moment does not confirm the price. A bullish divergence occurs when the underlying
Baseado em ondas indicadoras MACD com parâmetros padrão Aplica os níveis de Fibonacci às duas últimas ondas MACD, positivas e negativas, respectivamente, se no momento em que o indicador MACD fica sem onda negativa - a cor é verde, se no momento em que o indicador MACD fica sem onda positiva - a cor é vermelha. O critério de terminação Wave é dois ticks com um sinal MACD diferente. Aplica linhas de tendência nas últimas quatro ondas MACD. Funciona bem com o especialista  Figures MACD
The indicator detects and displays М. Gartley's Butterfly pattern. The pattern is plotted by the extreme values of the ZigZag indicator (included in the resources, no need to install). After detecting the pattern, the indicator notifies of that by the pop-up window, a mobile notification and an email. The pattern and wave parameters are displayed on the screenshots. The default parameters are used for demonstration purposes only in order to increase the amount of detected patterns. Parameters
COG LR Osc AM
Andriy Matviyevs'kyy
The presented indicator allows you to determine potential entry points into the market and set protective orders at reasonable levels. This product can be useful for both beginners and experienced traders. The indicator is based on calculation methods proven by time and practicing traders. The indicator is calculated in two stages: At the first stage, linear regression (LR) of the selected price type is determined for a given number of chart periods. At the second stage, the obtained data is p
Trend Master Chart MT4
Frederic Jacques Collomb
Trend Master Chart é o indicador de tendência que você precisa. Ele se sobrepõe ao gráfico e usa codificação de cores para definir diferentes tendências/movimentos do mercado. Ele usa um algoritmo que combina duas médias móveis e osciladores diferentes. Os períodos desses três elementos são modificáveis. Funciona em qualquer período de tempo e em qualquer par. Num relance você será capaz de identificar uma tendência ascendente ou descendente e os diferentes pontos de entrada nesta tendência.
FREE
Master Scalping M1 é um indicador inovador que usa um algoritmo para determinar a tendência de forma rápida e precisa. O indicador calcula o tempo de abertura e fechamento de posições, os algoritmos do indicador permitem encontrar os momentos ideais para entrar em uma negociação (comprar ou vender um ativo), o que aumenta o sucesso das transações para a maioria dos traders. Benefícios do indicador: Fácil de usar, não sobrecarrega o gráfico com informações desnecessárias. Pode ser usado como filt
Trend PA
Mikhail Nazarenko
5 (3)
The Trend PA indicator uses   Price Action   and its own filtering algorithm to determine the trend. This approach helps to accurately determine entry points and the current trend on any timeframe. The indicator uses its own algorithm for analyzing price changes and Price Action. Which gives you the advantage of recognizing, without delay, a new nascent trend with fewer false positives. Trend filtering conditions can be selected in the settings individually for your trading style. The indicator
Free automatic Fibonacci is an indicator that automatically plots a Fibonacci retracement based on the number of bars you select on the BarsToScan setting in the indicator. The Fibonacci is automatically updated in real time as new highest and lowest values appears amongst the selected bars. You can select which level values to be displayed in the indicator settings. You can also select the color of the levels thus enabling the trader to be able to attach the indicator several times with differe
FREE
Power Renko is an indicator which plots Renko bricks underneath the chart using a histogram. You can select the brick size and the timeframe of the Renko bricks as well as whether or not to use the close price or the high/low price of the candles. Renko bricks are based on price alone, not time, therefor the Renko bricks will not be aligned with the chart's time. They are extremely useful for trend trading and many different strategies can be formed from them. Buffers are provided allowing you t
Download the free version   here. Divergence Divergence refers to when the price of a currency pair moves in one direction while the trend indicator is moving in the opposite direction. With divergence, there can be positive and negative signals. Divergences in Forex trading are quite common signals of technical analysis. These are basic early Forex signals indicating the trend reversal and filter false signals. Application of this indicator It is usually not easy to detect divergences by the t
MACDivergence MTF
Pavel Zamoshnikov
4.29 (7)
Advanced ideas of the popular MACD indicator: It detects and displays classic and reverse divergences (three methods of detecting divergences). It uses different color to highlight an uptrend and a downtrend. Two methods of determining a trend: а) MACD crosses the 0 level (classic signal); б) MACD crosses its own average (early signal). This is a multi-timeframe indicator: it can display MACD data from other timeframes. Two methods of drawing: classic histogram and line. It generates sound and v
Infinity Trend Pro
Yaroslav Varankin
1 (1)
This is a trend indicator without redrawing Developed instead of the binary options strategy (by the color of the Martingale candlestick) Also works well in forex trading When to open trades (binary options) A signal will appear in the place with a candle signaling the current candle It is recommended to open a deal for one candle of the current timeframe M1 and M5 When a blue dot appears, open a deal up When a red dot appears, open a trade down. How to open trades on Forex. When a signal is rec
FXC iDeM-DivergencE MT4 Indicator This is an advanced DeMarker indicator that finds trend-turn divergences on the current symbol. The indicator detects divergence between the DeMarker and the price movements as a strong trend-turn pattern. Main features: Advanced divergence settings Price based on Close, Open or High/Low prices Give Buy/Sell open signals PUSH notifications E-mail sending Pop-up alert Customizeable Information panel Input parameters: DeM Period: The Period size of the DeMarke
Gvs Undefeated Trend   indicator is designed for trend and signal trading. This indicator generates trend signals.  It uses many algorithms and indicators to generate this signal. It tries to generate a signal from the points with the highest trend potential. This indicator is a complete trading product. This indicator does not need any additional indicators.  You can only trade with this indicator. The generated signals are displayed on the graphical screen.  Thanks to the alert features you ca
This is a combination of multiple oscillators into a single divergence system that creates the impression of a more reliable divergence indicator. It is multi-currency based and works best on 15 minutes timeframe and above. Every time a signal is generated, it shows an alert to the user. It is more ideal if combined with other price action indicators or trading systems.
KDJ Index 4   交易实用必备工具指标 波浪自动计算指标,通道趋势交易 完美的趋势-波浪自动计算通道计算 , MT4版本 完美的趋势-波浪自动计算通道计算 , MT5版本 本地跟单复制交易 Easy And Fast Copy , MT4版本 Easy And Fast Copy , MT5版本 本地跟单复制交易 模拟试用 Easy And Fast Copy , MT4 模拟账号运行 Easy And Fast Copy , MT5 模拟账号运行 "Cooperative QQ:556024  "  "Cooperation wechat:556024"  "Cooperative email:556024@qq.com" 强烈推荐趋势指标, 波浪的标准自动计算   和   波浪的标准自动计算MT5版本     KDJ指标又叫 随机指标 ,是一种相当新颖、实用的技术分析指标,它起先用于期货市场的分析,后被广泛用于股市的中短期趋势分析,是期货和股票市场上最常用的技术分析工具。 随机指标KDJ一般是用于股票分析的统计体系,根据统计学原理,通过一个特定的周期(常为9日、9周等
FreqoMaster
Stanislav Korotky
The main idea of this indicator is rates analysis and prediction by Fourier transform. The indicator decomposes exchange rates into main harmonics and calculates their product in future. The indicator shows 2 price marks in history, depicting price range in the past, and 2 price marks in future with price movement forecast. Buy or sell decision and take profit size are displayed in a text label in the indicator window. The indicator uses another indicator as an engine for calculations - FreqoMet
Trendiness Index
Libertas LLC
5 (3)
"The trend is your friend" is one of the best known sayings in investing, because capturing large trendy price movements can be extremely profitable. However, trading with the trend is often easier said than done, because many indicators are based on price reversals not trends. These aren't very effective at identifying trendy periods, or predicting whether trends will continue. We developed the Trendiness Index to help address this problem by indicating the strength and direction of price trend
Noize Absorption Index MT4
Ekaterina Saltykova
5 (1)
Noize Absorption Index - is the manual trading system that measures the difference of pressure between bears forces and bulls forces. Green line - is a noize free index that showing curent situation. Zero value of index shows totally choppy/flat market.Values above zero level shows how powerfull bullish wave is and values below zero measures bearish forces.Up arrow appears on bearish market when it's ready to reverse, dn arrow appears on weak bullish market, as a result of reverse expectation. S
Os compradores deste produto também adquirem
Gann Made Easy
Oleg Rodin
4.96 (47)
Gann Made Easy é um sistema de negociação Forex profissional e fácil de usar, baseado nos melhores princípios de negociação usando a teoria do sr. W. D. Gann. O indicador fornece sinais precisos de COMPRA e VENDA, incluindo níveis de Stop Loss e Take Profit. Você pode negociar mesmo em movimento usando notificações PUSH. Entre em contato comigo após a compra! Vou compartilhar minhas dicas de negociação com você e ótimos indicadores de bônus de graça! Provavelmente você já ouviu muitas vezes sobr
Atomic Analyst
Issam Kassas
5 (2)
Primeiramente, vale ressaltar que este Indicador de Negociação não repinta, não redesenha e não apresenta atrasos, tornando-o ideal tanto para negociação manual quanto automatizada. O Analista Atômico é um Indicador de Ação de Preço PA que utiliza a força e o momentum do preço para encontrar uma vantagem melhor no mercado. Equipado com filtros avançados que ajudam a remover ruídos e sinais falsos, e aumentam o potencial de negociação. Utilizando múltiplas camadas de indicadores complexos, o A
TPSproTREND PrO
Roman Podpora
5 (15)
TPSpro TRENDPRO  - is a trend indicator that automatically analyzes the market and provides information about the trend and each of its changes, as well as giving signals for entering trades without redrawing! The indicator uses each candle, analyzing them separately. referring to different impulses - up or down impulse. Exact entry points into transactions for currencies, crypto, metals, stocks, indices!  -  Version MT5               DETAILED DESCRIPTION        /       TRADING SETUPS           
ACTUALMENTE COM 26% DE DESCONTO A melhor solução para qualquer novato ou comerciante especializado! Este Indicador é uma ferramenta comercial única, de alta qualidade e acessível, porque incorporámos uma série de características proprietárias e uma nova fórmula. Com apenas UM gráfico, pode ler a força da moeda para 28 pares de Forex! Imagine como a sua negociação irá melhorar porque é capaz de apontar o ponto exacto do gatilho de uma nova tendência ou oportunidade de escalada? Manual do u
Scalper Vault
Oleg Rodin
5 (27)
Scalper Vault é um sistema profissional de escalpelamento que fornece tudo o que você precisa para um escalpelamento bem-sucedido. Este indicador é um sistema de negociação completo que pode ser usado por comerciantes de forex e opções binárias. O período de tempo recomendado é M5. O sistema fornece sinais de seta precisos na direção da tendência. Ele também fornece sinais superiores e inferiores e níveis de mercado Gann. Os indicadores fornecem todos os tipos de alertas, incluindo notificações
Antes de tudo, vale ressaltar que esta Ferramenta de Negociação é um Indicador Não Repintante, Não Redesenhante e Não Atrasado, o que a torna ideal para negociação profissional. O Indicador de Conceitos de Ação de Preço Inteligente é uma ferramenta muito poderosa tanto para traders novos quanto experientes. Ele combina mais de 20 indicadores úteis em um único, combinando ideias avançadas de negociação como Análise do Trader do Círculo Interno e Estratégias de Negociação de Conceitos de Dinhei
Actualmente 20% OFF ! A melhor solução para qualquer novato ou comerciante especializado! Este software de painel de instrumentos está a funcionar em 28 pares de moedas. É baseado em 2 dos nossos principais indicadores (Advanced Currency Strength 28 e Advanced Currency Impulse). Dá uma grande visão geral de todo o mercado Forex. Mostra valores avançados de força da moeda, velocidade de movimento da moeda e sinais para 28 pares de divisas em todos os (9) períodos de tempo. Imagine como a sua
Scalper Inside PRO
Alexey Minkov
4.75 (55)
SALE NOW! Limited Time Offer! An exclusive indicator that utilizes an innovative algorithm to swiftly and accurately determine the market trend. The indicator automatically calculates opening, closing, and profit levels, providing detailed trading statistics. With these features, you can choose the most appropriate trading instrument for the current market conditions. Additionally, you can easily integrate your own arrow indicators into Scalper Inside Pro to quickly evaluate their statistics and
TPSpro RFI Levels
Roman Podpora
5 (13)
A key element in trading is zones or levels from which decisions to buy or sell a trading instrument are made. Despite attempts by major players to conceal their presence in the market, they inevitably leave traces. Our task was to learn how to identify these traces and interpret them correctly. Reversal First Impulse levels (RFI)   -  Version MT5                INSTRUCTIONS                 RUS                 ENG                                       R ecommended to use with an indicator   -  
Apresentando       Quantum Trend Sniper Indicator   , o inovador Indicador MQL5 que está transformando a maneira como você identifica e negocia as reversões de tendência! Desenvolvido por uma equipe de traders experientes com experiência comercial de mais de 13 anos,       Indicador de Atirador de Tendência Quântica       foi projetado para impulsionar sua jornada de negociação a novos patamares com sua forma inovadora de identificar reversões de tendência com precisão extremamente alta. ***C
Trend Screener
STE S.S.COMPANY
4.83 (86)
Indicador de tendência, solução única inovadora para negociação e filtragem de tendências com todos os recursos de tendências importantes construídos dentro de uma ferramenta! É um indicador multi-timeframe e multi-moedas 100% sem repintura que pode ser usado em todos os símbolos/instrumentos: forex, commodities, criptomoedas, índices e ações. O Trend Screener é um indicador eficiente que segue a tendência do indicador que fornece sinais de tendência de seta com pontos no gráfico. Os recursos qu
Quantum Breakout Indicator PRO
Bogdan Ion Puscasu
4.96 (26)
Apresentando       Quantum Breakout PRO   , o inovador Indicador MQL5 que está transformando a maneira como você negocia Breakout Zones! Desenvolvido por uma equipe de traders experientes com experiência em negociação de mais de 13 anos,   o Quantum Breakout PRO   foi projetado para impulsionar sua jornada comercial a novos patamares com sua estratégia inovadora e dinâmica de zona de rompimento. O Quantum Breakout Indicator lhe dará setas de sinal em zonas de breakout com 5 zonas-alvo de luc
Advanced Supply Demand
Bernhard Schweigert
4.92 (310)
Atualmente com 33% de desconto! A melhor solução para qualquer Trader Novato ou especialista! Este indicador é uma ferramenta de negociação exclusiva, de alta qualidade e acessível porque incorporamos uma série de recursos proprietários e uma nova fórmula. Com esta atualização, você poderá mostrar fusos horários duplos. Você não só será capaz de mostrar um TF mais alto, mas também mostrar ambos, o TF do gráfico, MAIS o TF mais alto: MOSTRANDO ZONAS ANINHADAS. Todos os traders de Oferta e Demanda
Currency Strength Wizard é um indicador muito poderoso que fornece uma solução completa para uma negociação bem-sucedida. O indicador calcula o poder deste ou daquele par forex usando os dados de todas as moedas em vários intervalos de tempo. Esses dados são representados em uma forma de índice de moeda fácil de usar e linhas de energia de moeda que você pode usar para ver o poder desta ou daquela moeda. Tudo o que você precisa é anexar o indicador ao gráfico que deseja negociar e o indicador mo
Descubra o segredo da negociação forex bem -sucedida com nosso indicador MT4 personalizado! Você já se perguntou como obter sucesso no mercado de Forex, obtendo lucros consistentemente e minimizando o risco? Aqui está a resposta que você está procurando! Permita -nos apresentar nosso indicador proprietário do MT4 que revolucionará sua abordagem à negociação. Versatilidade única Nosso indicador foi projetado especialmente para usuários que preferem as formações de vela Renko e Rangebar. En
Break and Retest
Mohamed Hassan
5 (2)
Break & Retest is unstoppable when combined with our other divergence indicator. After purchase, send us a message and you could get this  2nd indicator  for  FREE  as a  BONUS! ‍You can visually backtest Break & Retest to see how it behaved in the past!    Manual guide:   Click here $59  for the first 25 copies ( 4  left)! Next price is $120 .  After many months of hard work and dedication, we are extremely proud to present you our  Break and Retest price action indicator crea
Apresentamos o Indicador Milagroso de Forex: Desencadeie o Poder da Negociação Precisa Você está cansado de procurar o melhor indicador de Forex que realmente ofereça resultados excepcionais em todos os períodos de tempo? Não procure mais! O Indicador Milagroso de Forex chegou para revolucionar sua experiência de negociação e impulsionar seus lucros a novas alturas. Construído com base em tecnologia de ponta e anos de desenvolvimento meticuloso, o Indicador Milagroso de Forex se destaca como o á
Entry Points Pro
Yury Orlov
4.7 (225)
Este é um indicador para MT4 que fornece sinais precisos para entrar em uma negociação sem redesenhar. Ele pode ser aplicado a qualquer ativo financeiro: forex, criptomoedas, metais, ações, índices. Ele fornecerá estimativas bastante precisas e informará quando é melhor abrir e fechar um negócio. Assista o vídeo (6:22) com um exemplo de processamento de apenas um sinal que compensou o indicador! A maioria dos traders melhora seus resultados de negociação durante a primeira semana de negociação c
TrendDecoder Premium
Christophe, Pa Trouillas
5 (3)
Identifica os intervalos e os próximos movimentos prováveis   |  Obter os primeiros sinais e a força das tendências   |  Obter saídas claras antes da reversão   |  Detetar os níveis Fibo que o preço irá testar Indicador não repintável e não atrasado - ideal para trading manual e automatizado - adequado para todos os activos e todas as unidades de tempo Oferta por tiempo limitado >>   50% OFF Após a compra,   por favor contacte-me neste canal  para obter as definições recomendadas Versão   MT5 :
ALERTA DE COMPRA E VENDA MULTICURRENCY e MULTITIMEFRAME. PARADA DE TRAILING AUTOMÁTICO E RECOMPENSA DE RISCO TAKEPROFIT! O INDICADOR VARREDURA E ANALIZA O MERCADO PARA VOCÊ NÃO TER NADA PARA FAZER! NEGOCIE TODAS AS SUAS MOEDAS EM 1 TABELA!   Após a compra deixe um comentário entre em contato comigo e eu lhe enviarei o assistente comercial EA. O indicador usa vários osciladores e filtros anexados para encontrar os melhores pontos de entrada CONFIRMADOS, então você não precisa se preocupar
TrendMaestro
Stefano Frisetti
5 (2)
note: this indicator is for METATRADER4, if you want the version for METATRADER5 this is the link: TRENDMAESTRO recognizes a new TREND in the bud, he never makes mistakes. The certainty of identifying a new TREND is priceless. DESCRIPTION TRENDMAESTRO identifies a new TREND in the bud, this indicator examines the volatility, volumes and momentum to identify the moment in which there is an explosion of one or more of these data and therefore the moment in which prices have strong probability of f
FX Volume
Daniel Stein
4.6 (35)
Receba a sua atualização diária do mercado com detalhes e screenshots através do nosso Morning Briefing aqui no mql5 e no Telegram ! O Volume FX é o PRIMEIRO e ÚNICO indicador de volume que fornece uma visão REAL do sentimento do mercado do ponto de vista de um corretor. Ele fornece uma visão incrível de como os participantes do mercado institucional, como corretores, estão posicionados no mercado Forex, muito mais rápido do que os relatórios COT. Ver essas informações diretamente no seu gráfi
Price Action Entry Alerts
Stephen Sanjeeve Sahayam
5 (3)
Este indicador analisa cada barra de pressão de compra ou venda e identifica 4 tipos de padrões de velas com o maior volume. Essas velas são filtradas usando vários filtros lineares para mostrar sinais de compra ou venda. Os sinais funcionam melhor, em conjunto com a direção do período de tempo mais alto e quando negociados durante as horas de alto volume. Todos os filtros são personalizáveis ​​e funcionam de forma independente. Pode visualizar sinais de uma única direção com o clique de um bot
ACTUALMENTE 31% DE DESCONTO!! A melhor solução para qualquer novato ou comerciante especializado! Este indicador é uma ferramenta comercial única, de alta qualidade e acessível, porque incorporámos uma série de características proprietárias e uma fórmula secreta. Com apenas UM gráfico, dá alertas para todos os 28 pares de moedas. Imagine como a sua negociação irá melhorar porque é capaz de identificar o ponto exacto de desencadeamento de uma nova tendência ou oportunidade de escalada! Con
How to use Pair Trading Station Pair Trading Station is recommended for H1 time frame and you can use it for any currency pairs. To generate buy and sell signal, follow few steps below to apply Pair Trading Station to your MetaTrader terminal. When you load Pair Trading Station on your chart, Pair Trading station will assess available historical data in your MetaTrader platforms for each currency pair. On your chart, the amount of historical data available will be displayed for each currency pai
FX Power MT4 NG
Daniel Stein
5 (8)
Receba a sua atualização diária do mercado com detalhes e screenshots através do nosso Morning Briefing aqui no mql5 e no Telegram ! O FX Power MT4 NG é a próxima geração do nosso medidor de força de moeda muito popular de longa data, o FX Power. E o que é que este medidor de força da próxima geração oferece? Tudo o que adorou no FX Power original MAIS Análise de força GOLD/XAU Resultados de cálculo ainda mais precisos Períodos de análise configuráveis individualmente Limite de cálculo personal
O sistema PRO Renko é um sistema de negociação altamente preciso especialmente concebido para a negociação de gráficos RENKO. Trata-se de um sistema universal que pode ser aplicado a vários instrumentos de negociação. O sistema neutraliza eficazmente o chamado ruído de mercado, dando-lhe acesso a sinais de inversão precisos. O indicador é muito fácil de usar e tem apenas um parâmetro responsável pela geração de sinal. Você pode facilmente adaptar a ferramenta a qualquer instrumento de negoc
Antes de mais nada, vale ressaltar que este Sistema de Negociação é um Indicador Não Repintado, Não Redesenhado e sem Atrasos, o que o torna ideal para negociações profissionais. O "Sistema de Negociação de Suporte e Resistência Inteligente" é um indicador avançado projetado para traders novos e experientes. Empodera os traders com precisão e confiança no mercado forex. Este sistema abrangente combina mais de 7 estratégias, 10 indicadores e vários métodos de negociação, incluindo estratégias
Cycle Sniper
Elmira Memish
4.4 (35)
NEW YEAR SALE PRICE FOR LIMITED TIME!!! Please contact us after your purchase and we will send you the complimentary indicators to complete the system Cycle Sniper is not a holy grail but when you use it in a system which is explained in the videos, you will feel the difference. If you are not willing to focus on the charts designed with Cycle Sniper and other free tools we provide, we recommend not buying this indicator. We recommend watching the videos about the indiactor and system before pu
PTS Precision Index Oscillator V2
PrecisionTradingSystems
5 (1)
O Oscilador de Índice de Precisão (Pi-Osc) de Roger Medcalf da Precision Trading Systems A Versão 2 foi cuidadosamente reconfigurada para carregar rapidamente em seu gráfico, e algumas outras melhorias técnicas foram incorporadas para aprimorar a experiência. O Pi-Osc foi criado para fornecer sinais precisos de temporização de negociações projetados para encontrar pontos de exaustão extremos, os pontos para os quais os mercados são forçados a ir apenas para tirar as ordens de todos. Este
Mais do autor
Pare de procurar e tentar novos indicadores! Obtenha o indicador Winshots Massive FX Profits e destaque-se na multidão. Anos de experiência em negociações nos levaram à construção de tudo isso em um indicador! Negocie como um profissional com Winshots Massive FX Profits! Este indicador usa as seguintes metodologias para ajudá-lo a se tornar um trader lucrativo mais consistente: - PERFIL DE VOLUME DE MERCADO - NÍVEIS DIÁRIOS DE PIVOTOS - ANÁLISE DE CICLOS DE PREÇOS O que é VOLUME P
This indicator will help you identify the key zones needed for The Silver Bullet Strategy which are:  The three time-windows the ICT mentioned in the strategy Window 1: 3 AM and 4 AM New York time Window 2: 10 AM and 11 AM New York Time Window 3: 2 PM to 3 PM New York Time Bullish and bearish supply and demand zones which will help you identify FVG inside those time windows T he previous day's high and low, draw on liquidity The indicator does not plot the FVGs to avoid cluttering the chart  Exi
Objetivo: A função deste indicador é desenhar 3 linhas de médias móveis (MA) no gráfico de preços MT4 principal. Os MAs são de 3 prazos diferentes especificados pelo usuário, independentemente do gráfico que está sendo exibido no momento. Quando você alterna a visualização do gráfico em diferentes intervalos de tempo, os 3 MAs continuarão a exibir as linhas do MA para os intervalos de tempo especificados nas propriedades. Exemplo: As configurações padrão mapeiam três MAs de 50 barras
FREE
The parabolic stop and reverse (PSAR) indicator was developed by J. Welles Wilder, Jr. as a tool to find price reversals which can be utilized as stop-loss levels as well as trade triggers. The notable difference about the PSAR indicator is the utilization of time decay. The PSAR indicator forms a parabola composed of small dots that are either above or below the trading price. When the parabola is below the stock price, it acts as a   support   and trail-stop area, while indicating bullish up t
FREE
O que é um Pivot? Um pivô é um nível de preço significativo conhecido de antemão, que os traders consideram importante e podem tomar decisões de negociação em torno desse nível. Como um indicador técnico, um preço pivô é semelhante a um nível de resistência ou suporte. Se o nível do pivô for excedido, o preço deverá continuar nessa direção. Ou o preço pode reverter nesse nível ou perto dele. O que um pivô lhe diz? Existem pivôs e pontos de pivô. Esses termos podem significar coisas difere
Negociar na direção de uma tendência forte reduz o risco e aumenta o potencial de lucro. Em geral, o índice direcional médio (ADX) é usado para determinar quando o preço está tendendo fortemente. Em muitos casos, é o indicador de tendência final! Afinal, a tendência pode ser sua amiga, mas com certeza ajuda saber quem são seus amigos. ADX é usado para quantificar a força da tendência. Os cálculos do ADX são baseados em uma média móvel de expansão da faixa de preço em um determinado período de
The Qualitative Quantitative Estimation (QQE) indicator is a technical analysis tool developed for the MetaTrader 4 (MT4) trading platform. It is designed to help traders identify potential trend reversals and to determine the strength of a current trend. The QQE indicator is calculated based on the Relative Strength Index (RSI) and Moving Average (MA) indicators. The RSI is used to determine the momentum of price movements, while the MA is used to smooth out the price data and identify trends.
Winshots Trade Assistant EA decides when to take the the first trade based on the H1 time frame and the Stochastic indicator.  It is there to assist you in deciding in which direction you should trade as well as managing all the trades you open on the same chart (it's very useful in scalping on lower time frames).  The first trade will always be 1 micro lot, and decision always based on the H1 time frame.  Then your job is to open further trades in the same direction as top ups MANUALLY. However
Filtro:
Matthew Kotecki
227
Matthew Kotecki 2021.03.30 11:41 
 

I would rate 5 stars but it has issues that need to be fixed, such as it spamming a pop alert for the same currency pair 5 or 6 times in less than 1min.it also constantly has repetitive notifications every second, as I close the pop-up notifications and then a few seconds later it appears again.it needs a time delay in minutes between sending each notification.

Can you add push notifications?

for the time being, I would not recommend this indicator for $30

4/12/20 Issues where addressed by developer so I update my rating to 5 stars

the only 1 request I have left it to be able to choose which time frames need to all align to get an alert. for example I want to get an alerts when M30 H1 H4 D1 all line up

I will update my review if he fixes these issues

Pawel Michalowski
1564
Resposta do desenvolvedor Pawel Michalowski 2021.03.31 18:44
Thank you Matthew for your feedback. I will try to get this fixed ASAP.
Responder ao comentário
Versão 2.3 2024.03.18
In this version:
- bug fixes
- faster refresh rate
- ADX optimization
Versão 2.2 2023.06.28
- Added some code to allow for a better internal-object clean up when a new instrument is loaded onto a chart and new values are being loaded for that new instrument
Versão 2.1 2023.04.28
Added X-Y offset for a more accurate placement on the chart. Fixed few minor bugs esp. to improve the speed of loading data.
Versão 1.9 2022.09.28
The main study used is still ADX but I used the same concept to also add RSI, Bulls vs Bears, and MACD indicators to the scan. In addition, there is a new timer function that allows you to automatically cycle the studies used, which automatically enhances the trader's knowledge about the current instrument on the chart.
Versão 1.8 2022.08.04
Added multi-time frame support for Bulls vs. Bears indicator
Versão 1.7 2021.04.08
Adicionado novo recurso solicitado por um usuário para enviar notificações push para os terminais móveis, cujos IDs MetaQuotes são especificados na guia "Notificações".
Versão 1.6 2021.03.31
Aprimorou o recurso ALERTAS e adicionou uma opção para alertas de e-mail.