The Entry Point
- Indicadores
- Mohamed Mahmoud Sayed Kabesh Kabesh
- Versão: 5.0
- Atualizado: 2 outubro 2020
- Ativações: 5
[DESCRIÇÃO]
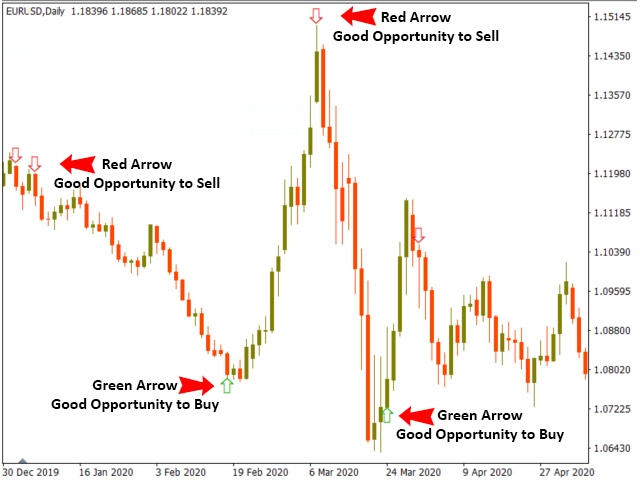
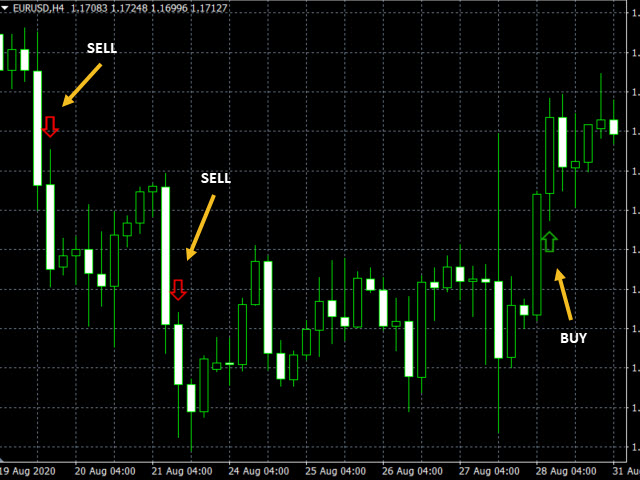
O indicador de Ponto de entrada mostra setas para cima / para baixo como um ponto de entrada para compra / venda. O sinal é baseado em EMA, MACD e Price Action.
[PRINCIPAIS CARACTERÍSTICAS]
Todas as sugestões / comentários são apreciados
O indicador de Ponto de entrada mostra setas para cima / para baixo como um ponto de entrada para compra / venda. O sinal é baseado em EMA, MACD e Price Action.
- Uma seta vermelha significa que é uma boa oportunidade para vender.
- Uma seta verde significa que é uma boa oportunidade para comprar.
- Negociar Forex e instrumentos financeiros alavancados envolve risco significativo e pode resultar na perda de seu capital investido. Você não deve investir mais do que pode perder e deve certificar-se de que compreende totalmente os riscos envolvidos. A comercialização de produtos alavancados pode não ser adequada para todos os investidores.
- O desempenho passado não é garantia de resultados futuros.
- Ninguém pode prever o futuro, mas só podemos analisar dados históricos para construir um sistema de previsão de sucesso.
- O gerenciamento de riscos é muito importante.
- Recomendado para testar o indicador em uma conta demo antes de usar o indicador com conta Live.
- Recomendado para usar Stop Loss, Trailing Stop e Trailing Stop com Break-Even.
- No caso de eventos incomuns como crises financeiras, Eleições, Guerras Mundiais, Pandemias; não é recomendado fazer negociações, tome cuidado para gerenciar o risco de maneira adequada.
[PRINCIPAIS CARACTERÍSTICAS]
- Uma seta vermelha significa que é uma boa oportunidade para vender.
- Uma seta verde significa que é uma boa oportunidade para comprar.
- Fácil de usar e gerenciar.
- O indicador é muito simples e intuitivo, mesmo para iniciantes.
- Funciona com qualquer símbolo de negociação: pares de Forex, índices, commodities, CFDs ou criptografia.
- Filtragem de ruído.
- Sem repintura.
- O indicador é exibido na janela do gráfico.
- Alertas sonoros são ativados por padrão para que você possa ouvir um som e ver uma mensagem pop-up sempre que uma nova seta aparecer.
- Você pode ligar e desligar os Alertas sonoros.
- Melhor para usar com H4, D1 e W1.
Todas as sugestões / comentários são apreciados
- MQL5 IM
- Email: mohamedkabesh@yahoo.com
- Telegrama: @MohamedKabesh
O usuário não deixou nenhum comentário para sua avaliação