Versão 11.3
2021.02.01
In version 11.3, Harmonic Pattern Plus will show you which pattern is formed completely and which pattern is not formed completely. This information is available from both single indicator mode and multiple timeframe pattern detection mode.
Versão 11.1
2019.10.10
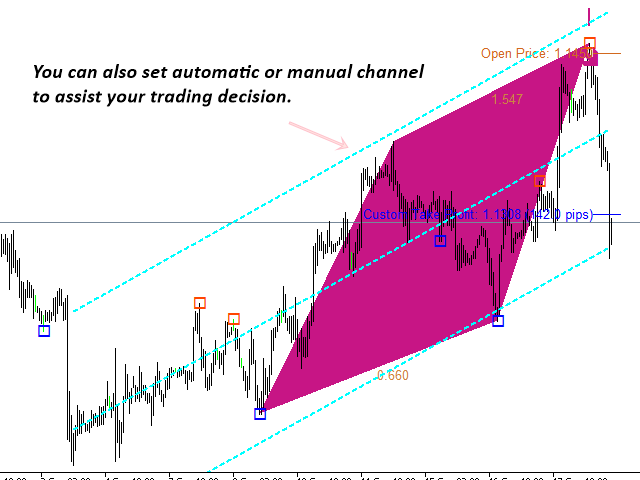
In version 11.1, we have polished up Regression Channel functions. Now you can set the style, color and width of Regression Channel. To use Regression Channel as part of your trading strategy, just set Use Channel = true.
Versão 11.0
2019.01.30
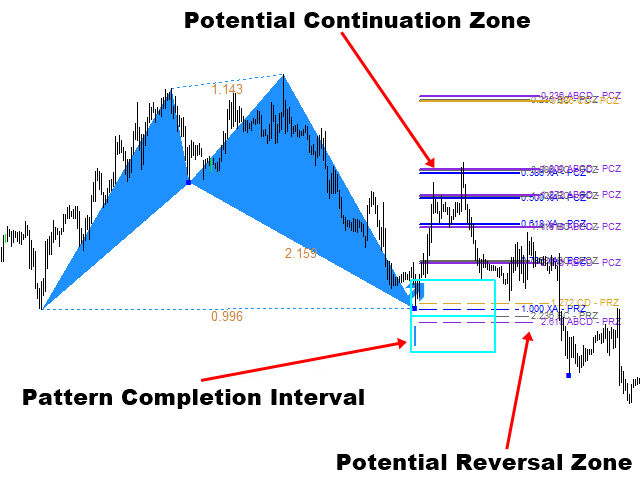
In Version 11.0, we have made some improvement over Potential Continuation Zone.
Versão 10.9
2018.12.22
Version 10.8, minor work on indicator. All functionality are kept the same.
Versão 10.7
2018.11.30
In version 10.7, we have changed line width and lenth for better visibility.
Versão 10.6
2018.10.10
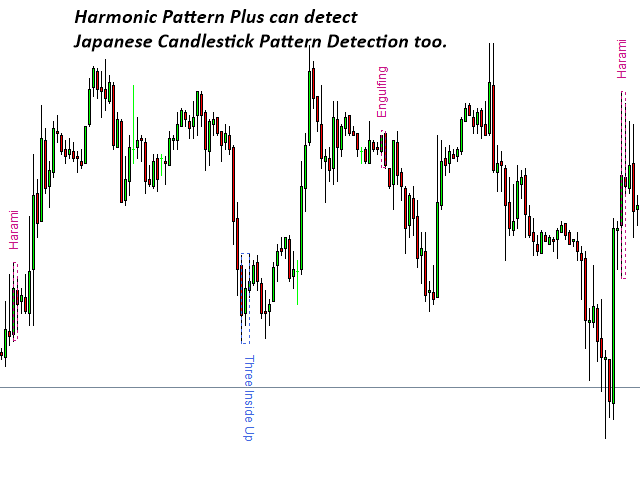
In version 10.6, we have added sound alert, email and push notification for 52 Japanese candlestick patterns.
Versão 10.5
2018.07.27
In version 10.5, user can control the width of trianlge when the triangle is not filled.
Versão 10.3
2018.05.17
In this version, Harmonic Pattern will be shown at ideal point D.
Versão 9.9
2017.07.27
In Version 9.9, User can set the pattern matching accuracy for individual point as well as over the averaged MAPE.
Versão 9.8
2017.06.22
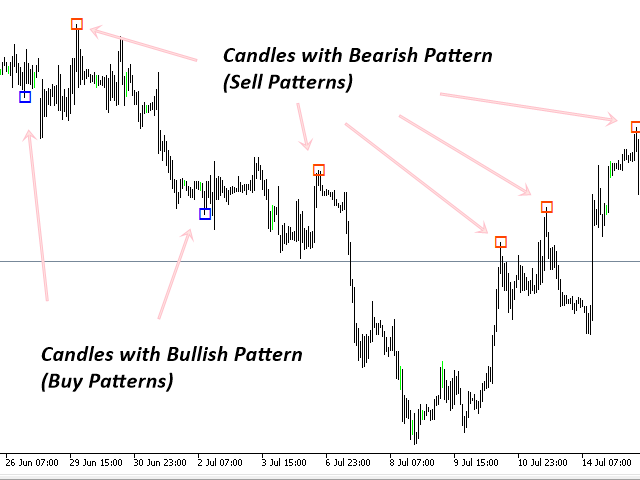
In Version 9.8, Now multiple pattern locking is allowed. This means that trader can lock as many pattern as he want in the chart. This feature not only protects traders from the repainting and redrawing issues of the classic Pattern trading but also trader can enhance his trading performance by incorporating multiple timeframe patterns analysis at ease.
Versão 9.5
2017.04.28
In Version 9.5, Trader have access to Potential Reversal Zone Type A and Potential Reversal Zone Type B.
Potential Reversal Zone Type A: use to predict the reversal point at Point D.
Potential Reversal Zone Type B: use to preduct the future price movement after the pattern is formed.
Versão 9.3
2017.03.09
In version 9.3, you can automatically set up your stop loss and take profit by just moving stop loss or take profit level in your chart. This new feature will allow you to have intuitive and more efficient approach of setting your stop loss and profit target from geometric analysis.
Versão 9.2
2016.11.14
Updated Feature for Harmonic Pattern Plus and Harmonic Pattern Scenario Planner for version 9.2
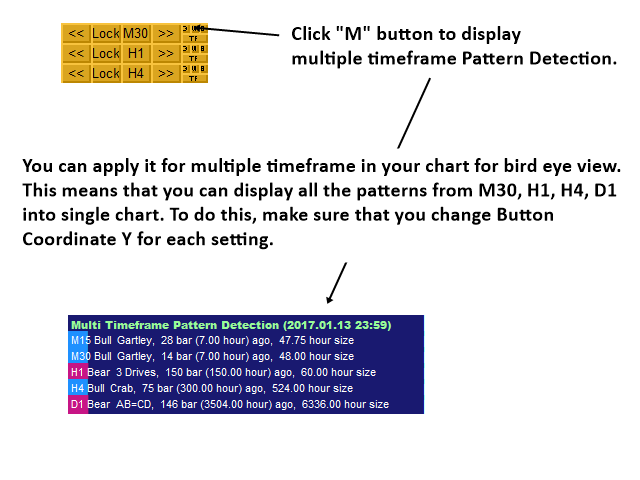
Multiple Timeframe Control Feature in Single Chart
This description applies to both Harmonic Pattern Plus and Harmonic Pattern Scenario Planner since both of them are identical 95% of their functionality. Most important feature in this new version is that you can add multiple of Harmonic Pattern Plus controlling different timeframes in one chart. If you wish, you can add 4 Harmonic Pattern Plus in one chart controlling M15, H1, H4, D1 timeframe or even more. One limitation when you add multiple Harmonic Pattern Plus is that you can only use the Calculation Timeframe (timeframe to detect patterns) greater than current chart timeframe. For example, if your chart timeframe is H1, then you can only use Calculation timeframe H1, H4, D1, etc. You can not use M15 calculation timeframe for H1 chart timeframe since you can not draw the M15 pattern to H1 timeframe chart.
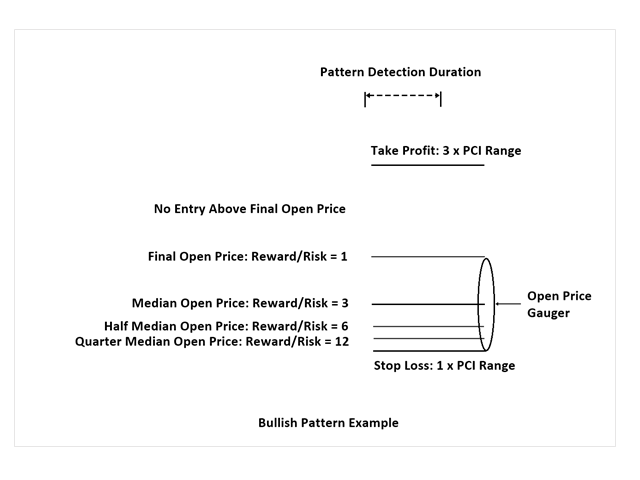
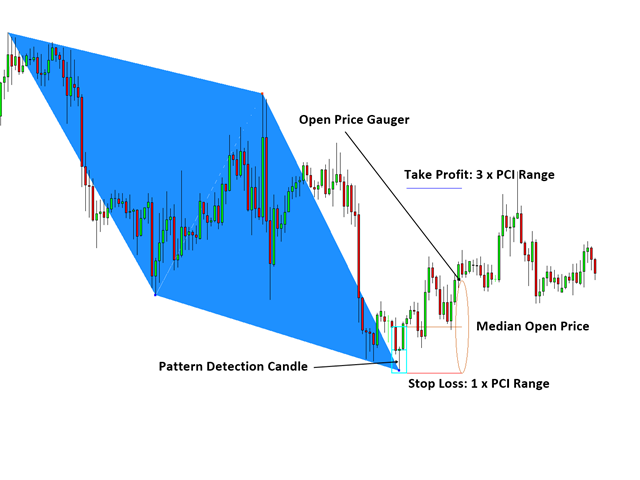
Custom Take Profit and Stop Loss
In version 9.2, Custom Take Profit and Stop Loss are defined using Pattern Completion Interval (PCI) for more clever setup. 3 Take Profit is equivalent to the 3 x the PCI box range. 1 Stop Loss is equivalent to the 1 x the PCI box range. The ellipses (stretched circle) shows you the potential entry. When your order is placed inside this circle, your Reward/Risk can range from 1 to 10 or even more in strictly mechanical trading. Why this happen? Do some basic math maybe looking at your chart. Note that this is the potential entry level shown only for your convenience but not limited to creating your own clever trading setup. The ellipses is like the ruler to gauge your potential entry in your preferred Rewards/Risk ratio and it is not an indicator showing direction or etc.
In addition, this PCI based Custom Take Profit and Stop Loss will influence your Guided Trading Instruction. Guided Trading Instruction will only calculate your profit assuming you are using median open price, which is the top of the PCI box (for bullish pattern, the other way around for bearish pattern). So this new feature on our Custom Take Profit and Stop Loss are rather optional for your trading.
For more details about version 9.2, you can check this link below.
Harmonic Pattern Plus MT4: https://www.mql5.com/en/market/product/4488#!tab=comments&page=12
Versão 8.8
2016.10.31
In version 8.8, Harmonic Pattern Plus can detect Harmonic Pattern at every tick level as an option. This is only small minor change from previous 8.6. There is no version 8.7 since we decided to name the latest version to 8.8 from 8.6. When you are detecting patterns at tick level, make sure that you understand it uses a lot more computation which can make your MetaTrader slow. However, this might be useful for traders using Pattern Completion Interval as entry. To detect pattern at every tick level, just set Detect Pattern at Every Tick to True.
Versão 8.6
2016.07.26
We have implemted 2 new features succesffully for our tools.
Feature 1: Options to switch on and off each pattern type. With this option, you can switch off or switch on any pattern type as you wish. For example, if you want to turn off Bat pattern from Harmonic Pattern Plus. Yes. You can. You can do the same for the price Breakout Pattern Scanner. For example, if you don’t want to see head and shoulder pattern, then you can just switch off them. How to use this feature is very intuitive. You just need to set the swton on and off in your Indicator Input settings.
Feature 2: Options to filter out small patterns. We will add “Pattern Size Filter” input. With this input, you can filter out small patterns and you can only trade with big patterns. You can use this feature in our Price Breakout Pattern Scanner too as well as with Harmonic Pattern Scenario Planner. Pattern Size Filter is simply done by counting number of candles inside patterns. So Make Pattern Size Filter large, then you will only see large patterns. If you want to see any patterns, then just set Pattern Size Filter = 0.
Versão 8.0
2016.06.09
Smart Renko version 6.0, Smart Renko can draw the brick the same level on your chart regardless of amount of historical bars and Meta Trader platforms. To do this, you need to choose the brick height which is the factor of 100 pip or factor of 1000 pips with Brick Height Mode = 0.
For example, you can use Brick Height (in pips) = 10, 20, 25, 50, 100, 200, 500, etc, as they are the fact of 100 or 1000 pips. As long as you are using these brick height, the brick will be drawn in the same level regardless of the amount of historical bars and your brokers. This is really good property as traders can develop strategy universally working across different platform.
This improved version of Smart Renko 6.0 is included in the new update for Harmonic Pattern Plus.
Number of detected patterns can be different according to your brick height and now you can even find that pattern specially formed around psychological number (round number) if this is one of your preferred strategy.
Versão 7.8
2016.05.27
In version 7.8, we have fixed the small bug related to Multiple Timeframe Pattern Detection. The bug was found after our update on Renko Filter Implementation in version 7.7.
Versão 7.7
2016.05.23
In version 7.7, Harmonic Pattern Plus can detect pattern using Renko Brick calulation. This is equivalent to detect pattern over the dedicated Renko Chart (Imagine that you have opened Renko Chart and then put this indicator over the Renko Chart). So it is very powerful due to less noise in the Renko Chart. The good news is that you don't need a dedicated Renko Chart as this indicators does renko brick calculation at the background using Smart Renko Indicator. So you are hassle free but this indicators will does a lot of work for you.
At the same time, user can choose to detect pattern over normal candle stick too as before. To choose the detection mode, user can use the following variable.
Use Renko Filter for Pattern detection : true or false only
We have currently set the default as Renko Filter Mode.
(Important note, Renko can be calculated using sub time frame. For example, Renko brick can be calculated using M5 or M15 time frame when you actually use this indicator for H1 chart. If the data is loaded, then there is not a problem. But sometime, data loading may be issue. But this is the issue present inside Meta Trader terminal. It might be fixed in the future when new Meta Trader version is released or maybe not. To avoid this issue, your default calculation time for Renko brick calculation is set to current time frame. But you can always change it with your own experiment. In our experience, there can be small difference when you change the calculation time frame. Smaller time frame is generally more accurate. But still higher time frame will do the job too.)
Versão 7.3
2016.04.14
In version 7.3, users have a choice over update frequency on pattern detection.
This means that you can choose pattern update frequency at different timeframe from a default one.
For example, if you are using Harmonic Pattern Plus on H1, normally pattern detection will be updated at every 1 hour but now you can even detect pattern at every 1 or 5 minutes instead of every 1 hour.
To do so, simply set Pattern Update Frequency = Period you want (PERIODM1 or PERIODM5, etc.).
This helps you to enter with much better risk/reward ratio.
Versão 7.1
2016.04.08
In the version 7.1, If you set the ButtonTextSize = 0, then you can hide buttons from your chart. Really minor update.
Versão 7.0
2016.03.23
In version 7.0, user can show clustered PRZ lines nicely. But it is possible not to filter PRZ lines and showing raw PRZ lines.
Versão 6.6
2016.02.22
In version 6.6, you can switch on or off MTD( multiple time frame detection feature) for each time frame. For example, if you don't use M1 or M5 time frame for your MTD, then just set Use M1 timeframe = false and use M5 timeframe = false in your MTD setting.
Versão 6.5
2016.01.22
In version 6.5, Multi Time Frame Pattern Detection (MDT) feature is added. If user want to check what pattern is formed in other time frame. It is now possible to check pattern formed across all time frame without changing your chart or time frame.
Button "MTD" is used to perform multi Time Frame Pattern Detection. So press this button to see or hide the multi time frame pattern panels.
We have also added five input setting in regards to this MTD feature.
If you want to permanently run this MTD feature at every candle,
then just set Use Multi Timeframe Pattern Detection = true.
However, this MTD feature require much heavier computation. Therefore, to run this at every candle, we will leave this to your own choice.
//Use Multi Timeframe Pattern Detection
//Use Sound Alert from MTD
//MTD Panel X coordinate
//MTD Panel Y coordinate
//MTD Panel Update Frequency
Overall this MTD feature will help traders to make a lot better and more accurate trading decision.
Versão 6.2
2015.11.18
In version 6.2, minor update only. Graphical objects were drawn in background rather than foreground.
Versão 6.0
2015.10.26
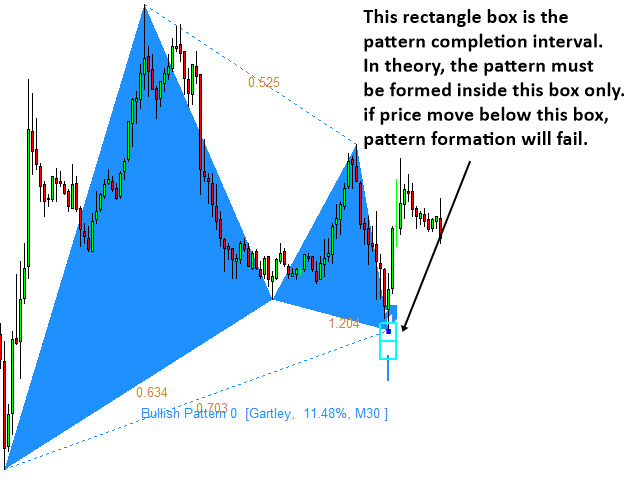
In version 6.0, Pattern Completion Interval was added. Added the new input variables.
//Show Pattern Completion Interval ('true' or 'false' only)
//Pattern Completion Interval Box Size (default = 4)
//Pattern Completion Interval Box Width (default = 2)
//Pattern Completion Interval Bullish Color
//Pattern Completion Interval Bearish Color
//Pattern Completion Interval Text Color
//Pattern Completion Interval Text Size
Versão 5.6
2015.10.15
In version 5.6, Now user can hide buttons on their charts by clicking "BT" button on chart. Minor update only.
Versão 5.5
2015.09.23
Linear regression channel alert bug was fixed.
Versão 5.3
2015.09.22
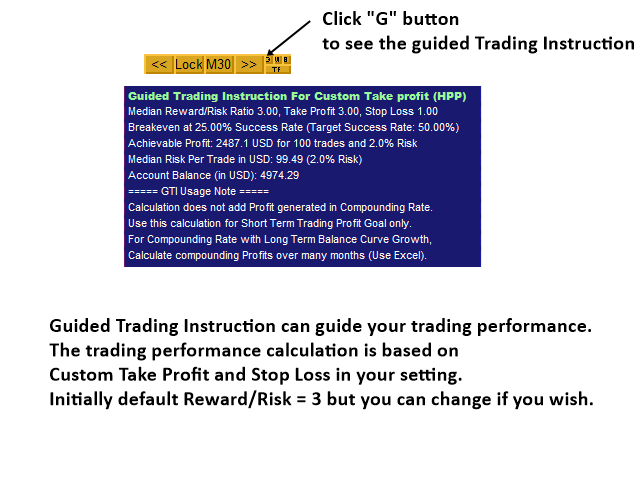
In this version 5.3, Custom Risk Control module was added. And the following variables were added.
//Use Custom Stop Loss and Take Profit
//Custom Take Profit: Enter fibo number 0.386, 0.5, 0.618, 0.786, 1.0
//Risk Reward Ratio (Reward/Risk): user more than 1.0
//Custom Take Profit and Stop Loss Line Length
//Custom Take Profit and Stop Loss Line Width
//Custom Take Profit and Stop Loss Text Size
//Custom Take Profit Color
//Custom Stop Loss Color
//Custom Open Price Color
//Show Guided Trading Instruction
//Guided Trading Instruciton X Coordination
//Guided Trading Instruction Y Coordination
//Your Target Success Rate: 55%(0.55) = default
//Your Risk per Trade: 2% (0.02) = default
//Your Target Trade Number: 100 = default
Versão 5.1
2015.08.20
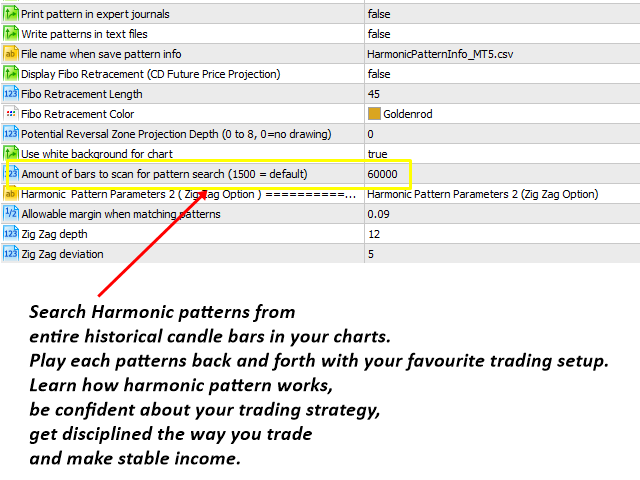
In version 5.1, now user can select how many historical bars to scan.
Note that this feature is great so you can study How harmonic pattern evolved through historcal data. This is very powerful feature. For example, you can learn how harmonic pattern worked in 2005 and compare its appearance on 2015. You can apply this knowledge for your trading. Something like this can't be achieved by manual traders.
However, scanning more bars requires a lot more computation time. So please be careful in using this feature. Also maxium number of patterns indicators can search is 1000. So Know this limitation too.
For average traders, 1500 bars (default setting) is more than fine.
Kind regards.
Versão 5.0
2015.05.26
In version 5.0, trader can disable direction arrow. Just set Direction Arrow Width =0 to disable the arrow from your chart.
Versão 3.9
2015.05.13
In this version, small bug of getting array out of range when you set PRZ depth = 0 is fixed.
Versão 3.8
2015.05.05
In version 3.8 New feature 1:
We added Fibonacci projection of followings:
1. Internal Price Retracement (XA)
2. External Price Retracement (BC)
3. Correction of Price Projection (ABCD)
4. Future Price projection (CD, this is existing Fibo retracement from earlier version)
Trader can control depth of these Fibonacci Projection using following variable:
Potential Reversal Zone Projection Depth (0 to 8, 0=no drawing)
value 1: fewer Fibonacci lines (for less sophisticated trading setup)
value 8: more Fibonacci lines (for more sophisticated trading setup)
Also individual Fibonacci projection can be switch on/off by setting these values to zero or other values:
Potential Reversal Zone Line Length for XA (0=no projection)
Potential Reversal Zone Line Length for BC (0=no projection)
Potential Reversal Zone Line Length for ABCD (0=no projection)
Future Price projection (CD, this is existing Fibonacci retracement from earlier version) is identical to and this can be controlled by previous Fibo Display option.
In version 3.8 New feature 2:
Now by just simply clicking over "Symbol" button on your chart, trader can detect new patterns at any tick arrival without waiting for new bar arrival. This is useful if you want to detect patterns before new bar arrivals. (Fast discovery of the patterns)
Versão 3.5
2015.04.28
In version 3.5, user can select any pattern to lock on his chart. Of course, user can unlock and delete the locked pattern. This locking and unlocking pattern is done by pressing "Pattern" button on the chart.
Versão 3.3
2015.04.13
Version 3.3
1. Added ability to change button text size (Text Size button).
2. Added push notifications for sending messages to mobile terminals.
Versão 3.2
2015.03.31
In version 3.2, just changed description of this indicator. (Very minor)
Versão 3.1
2015.03.19
In this version, Button has been redesigned for simpler looking.
Versão 3.0
2015.02.11
In version 3.0, Candlestick Pattern Detection algorithm was hugely improved by adding intensive statistical pattern matching process.
Versão 2.9
2015.01.21
Fixed small issue with Sound Alert.
Versão 2.8
2015.01.19
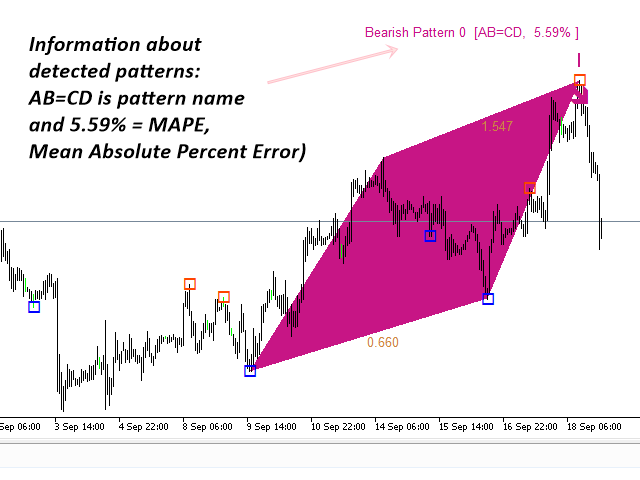
In version 2.8, pattern matching error (%) is added to account for how close the detected patterns are to reference patterns in text book.
Versão 2.7
2015.01.05
In version 2.7, now you can select different symbols using buttons on charts. Users now need to open fewer charts and their trading operation become quicker.
Versão 2.5
2014.09.24
In version 2.5, Harmonic Pattern Plus can detect 3 drives pattern and deep crab pattern. In addition, with version 2.5, user can build Expert Advisor using iCustom function.
Versão 2.3
2014.08.04
In Version 2.2, there was small bug printing Button creation failed occasionally. In Version 2.3, the bug was fixed.
Versão 2.2
2014.06.19
In Version 2.2, I added two buttons to replay historical harmonic patterns back and forth. This will help users to develop their trading strategy. Core search engines are remained intact. White background colour is used for chart instead of default chart. White background colour is better when user want to combine harmonic pattern with Price Breakout Pattern Scanner.
Versão 2.0
2014.06.02
In Version 2.0, Candlestick pattern recognition function was added.
Therefore, Harmonic Pattern Plus MetaTrader 4 Version is identical to Harmonic Pattern Plus MetaTrader 5 Version.
Versão 1.9
2014.05.28
I found Name for harmonic pattern was not displayed correctly in 4 digit broker platform. So I corrected this error.


I like everything about this indicator and all of its components.