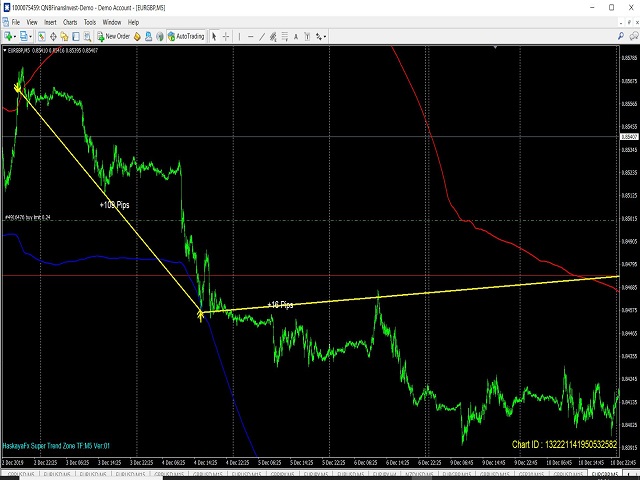
Haskayafx Super Trend Zone TFM5 V01


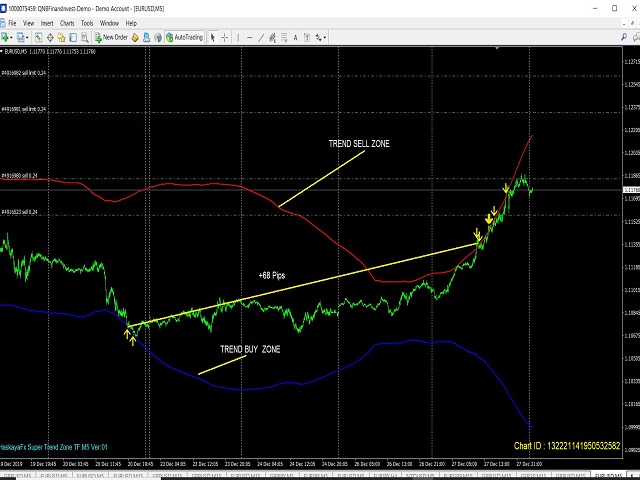
   This indicator prepared by using 311,1298 days Haskaya Trend Bandse and Calculates the strand ADX.
   This system can be used for 5M time frame. 
   This system is for Long term and profitable.
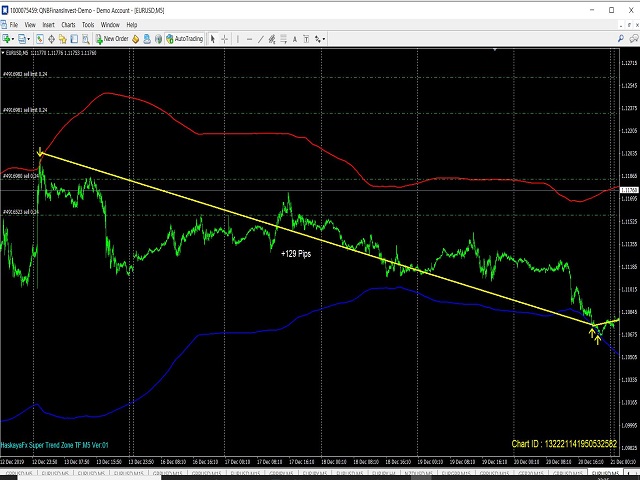
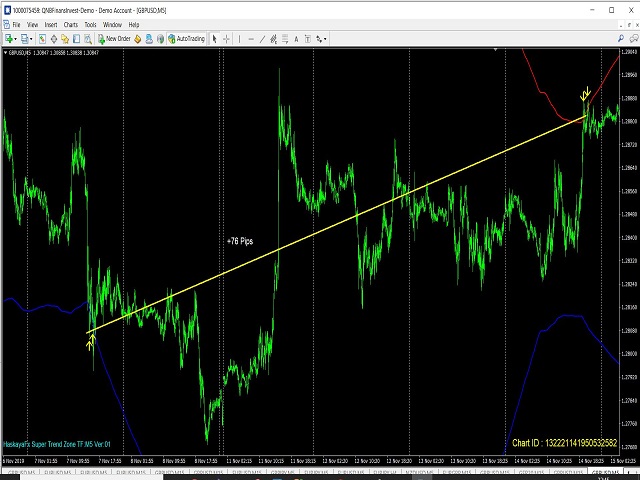
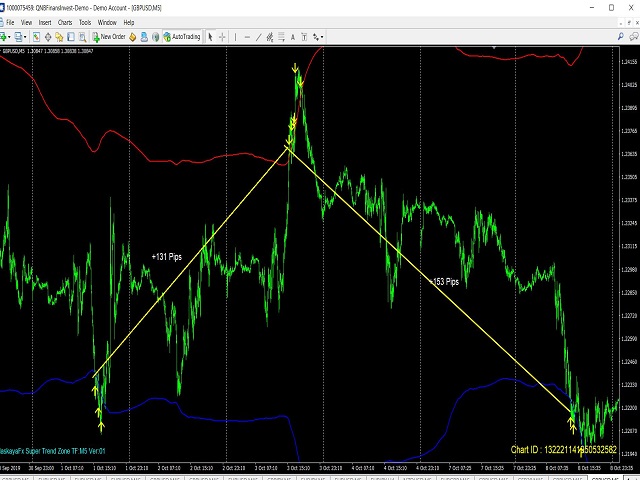
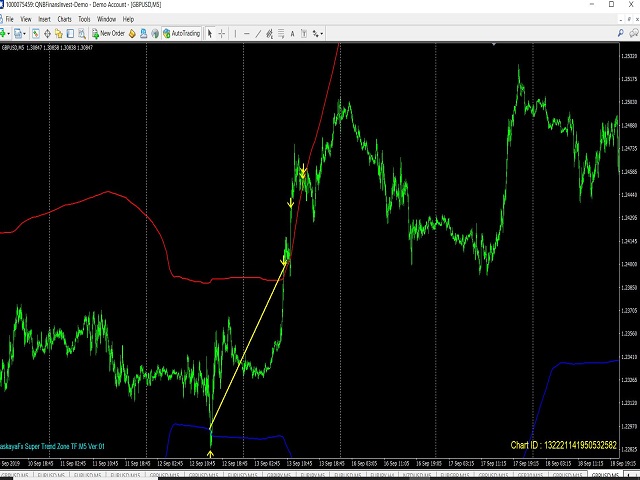
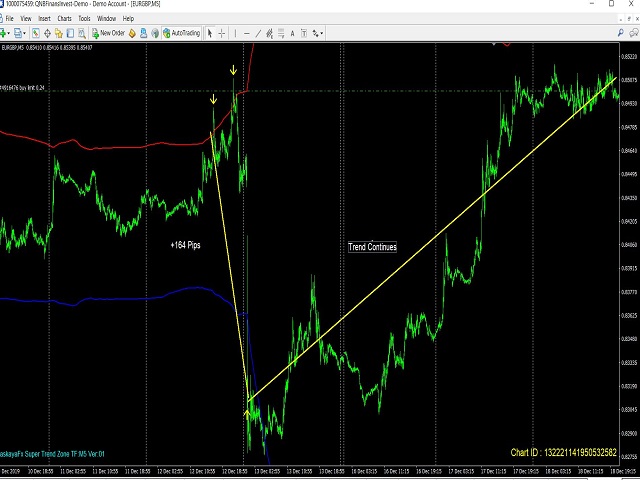
   Signals are shown as arrows. as an optional,
   you can set a voice alarm or email notification
   You can fins our other products from link : https://www.mql5.com/en/users/drbastem/seller
   Also, you can ask all your questins from email : haskayafx@gmail.com or mobile : +90 530 867 5076 or @MehmetBastem 
   on telegram application
   https://www.mql5.com/en/charts/11121737/eurusd-m5-qnb-finans-yatirim
   https://www.mql5.com/en/charts/11121740/eurusd-m5-qnb-finans-yatirim
   https://www.mql5.com/en/charts/11121745/eurusd-m5-qnb-finans-yatirim
   https://www.mql5.com/en/charts/11121749/eurusd-m5-qnb-finans-yatirim
   https://www.mql5.com/en/charts/11121759/eurusd-m5-qnb-finans-yatirim
   https://www.mql5.com/en/charts/11121763/eurusd-m5-qnb-finans-yatirim
   https://www.mql5.com/en/charts/11121766/gbpusd-m5-qnb-finans-yatirim
   https://www.mql5.com/en/charts/11121775/gbpusd-m5-qnb-finans-yatirim
   https://www.mql5.com/en/charts/11121783/gbpusd-m5-qnb-finans-yatirim
   https://www.mql5.com/en/charts/11121786/gbpusd-m5-qnb-finans-yatirim
   https://www.mql5.com/en/charts/11121793/eurgbp-m5-qnb-finans-yatirim

   https://www.mql5.com/en/charts/11121813/eurgbp-m5-qnb-finans-yatirim

 You can also use this signal with expert advisor with below code

double v1=0;
    v1=GlobalVariableGet(Symbol()+string(Period())+"HSKSUPERTRENDZONE");
    if(v1==0 )  return(0); // No Signals 
    if(v1==1) 
       {
       //Send BUY Order...
       GlobalVariableSet(Symbol()+string(Period())+"HSKSUPERTRENDZONE",0); 
       }
      if(v1==2) 
       {
       //Send SELL Order...
       GlobalVariableSet(Symbol()+string(Period())+"HSKSUPERTRENDZONE",0); 
       }


Below you can find indicator inputs.

   MAGrisi=2840; // Moving Average

   MA1Level=632; // Moving Averaga Upper Level

   MA2Level=1538;//  Moving Averga Lower Level

   AdxGiris=71;// ADX Period


   SendAnEmail=false; // Send E-Mail

   CepUyariGonder=false; // Send Cell Phone Notificatiom

   SesliAlarm=true; // Sound Alert

   AktifGrafikGoster=true; // Change Chart. Actively loads the graphic at the time of signal generation


Produtos recomendados
Insight Investor: Advanced Multi-Currency Forex Trading Bot Introduction In the fast-paced world of Forex trading, having the right tools can significantly enhance your trading experience. Insight Investor is an advanced multi-currency trading bot designed to automate and optimize your trading operations. This expert advisor employs modern algorithms to analyze market conditions and execute trades, aiming to deliver consistent results while maintaining controlled risk levels. Key Features of Ins
Candle EA MT4
Mansour Babasafary
3.68 (19)
This expert is based on patterns The main patterns of this specialist are candlestick patterns Detects trends with candlestick patterns It has a profit limit and a loss limit, so it has a low risk The best time frame to use this expert is M30 time frame The best currency pairs to use with this expert is the EURUSD, GBPUSD, AUDUSD, USDCAD currency pairs Attributes: Can be used in the EURUSD, GBPUSD, AUDUSD, USDCAD  currency pairs Can be used in M30, H1, H4 time frames Has profit limit and loss
This Indicator is use the ZigZag to calculate the Upper and  Lower Bound and the uptrend and the downtrned. Red for downtrend, Green for uptrend and Yellow is for the horizontal trend this horizontal trend also bookmarked the upper limited and the lower limited the the price swings.  Or in simple the Support and the Resistance level. However, You may use the Heikin Ashi to confirm the trend of the buy sell signal above. I cannot guarantee the win rate, Nevertheless, you must study well the timef
Dear Trader It is my pleasure to introduce to you my tool called the " Forex Sniper Indicator" . The major aim of this tool is to help serious traders and investors in all type of Financial Markets to catch price next movement right at the moment the price direction is about to change. This tool can be used to snipe the price direction in both down trend, uptrend and ranging markets. This tool can be used as the stand alone tool though it may be combined with other tools as well. My goal is to h
Precautions for subscribing to indicator This indicator only supports the computer version of MT4 Does not support MT5, mobile phones, tablets The indicator only shows the day's entry arrow The previous history arrow will not be displayed (Live broadcast is for demonstration) The indicator is a trading aid Is not a EA automatic trading No copy trading function The indicator only indicates the entry position No exit (target profit)  The entry stop loss point is set at 30-50 PIPS Or the front hi
ManualTradingTrend
Mukhriddin Ibragimov
Трендовый индикатор МТ4, дающий точные сигналы для входа в сделки. Работает без перерисовки и запаздываний! Только покупателем данного индикатора прилагается основной фильтр,обращайтесь в личку.   Идеальные точки входа в сделки для     валют, крипты, металлов, акций, индексов . Наилучшие результаты на таймфрейме M30 и выше! Наш канал в Telegram  |   Версия индикатора для MT5 Скоро   видео  for indicator Большинство трейдеров улучшают торговые результаты в первую неделю торговли с инд
FiboPlusWaveRunner
Sergey Malysh
3.29 (7)
Negociação automática e manual Um sistema comercial pronto baseado nas  ondas de Elliott e níveis de Fibonacci . Simples e de fácil acesso Exibição de marcação das ondas de Elliott (opção geral ou alternativa) em um gráfico Construção dos níveis horizontais, linhas de apoio e resistência, canal Sobreposição dos níveis de Fibonacci para as ondas 1, 3, 5, A Sistema de alerta (no ecrã, E-Mail, Push notificações) painel visual para abertura de ordens para negociação manual painel visual para configu
Historical Pattern MT5: Os 8 Pilares da Vantagem Estatística   PARE DE ADIVINHAR. OPERE COM DADOS. Matemática Pura. Zero Indicadores. Vantagem Institucional. Vamos ser honestos. A maioria dos traders falha porque está lutando a batalha errada. Eles olham para gráficos de 5 minutos, desenham linhas aleatórias e confiam na esperança. Enquanto isso, as Instituições — Bancos, Fundos de Hedge e Algoritmos — operam com base em   Fatos Estruturais . Se você está operando com base em um "sentimento", vo
The EA’s unique algorithm calculates the average price (reflected in the form of a trend line on the chart), which is the center of price attraction in the framework of the traded timeframe. At times of increasing volatility, the adviser begins work with the goal of fixing profit in the region of the center of attraction of the price. Advisor does not use dangerous trading methods. It is recommended to install a trading expert on a remote server (VPS). Recommended Trading Instruments (TF 5M)
Deep Analyst Expert Advisor    (mt5  https://www.mql5.com/en/market/product/163998 ) Deep Analyst   is a professional analytical tool powered by a specialized algorithm designed for deep analysis of market cycles and price amplitude fluctuations. By analyzing market conditions over a specific timeframe, the Expert Advisor determines price strength and amplitude using a unique indicator system based exclusively on real-time data. When the global trend and its vector shift, the algorithm automati
Este indicador é um indicador para análise automática de ondas que é perfeito para negociações práticas! Caso... Nota:   Não estou acostumado a usar nomes ocidentais para classificação de ondas. Devido à influência da convenção de nomenclatura de Tang Lun (Tang Zhong Shuo Zen), nomeei a onda básica como   uma caneta   e a banda de onda secundária como   um segmento   . ao mesmo tempo, o segmento tem a direção da tendência.   O segmento de tendência principal   é nomeado (esse método de nomencl
Work Stations
Maryna Shulzhenko
Forex Workstation   is a powerful and efficient Forex trading bot designed to use patterns, price hold levels, volatility analysis and market scaling. This bot offers unique capabilities for automated trading and optimization of strategies on various currency pairs. Let's look at the main functions and settings of Forex Workstation: Main functions: • Multicurrency: Forex Workstation supports a wide range of currency pairs, which allows you to diversify your portfolio and distribute risks. • Usin
Al in one level
Kundan Kumar Srivastava
5 (1)
This indicator is collection of important dynamic support and resistance giving a trader crystal clear idea , where to sell and where to buy. it completely complements trend lines, support, resistance, and sideways market and allow a trader to make sustainable profits. The thickness of lines suggests its strengths, the thicker the dynamic line, the stronger is rejection or pullback allowing a trader to make multi-fold profit, as they can clearly see them. Introducing Your Ultimate Trading Edge:
Sweet Waffle
Christophe Godart
The arrows are calculated with: -     2 Parabolic  parameters -     2 ADX parameters -     4 Stochastic parameters We recommend to combine it with Parabolic, ZigZag or Elliot waves indicator. Always trade the trend! If you make sure to draw your trend lines and support/resistance zones you will just have to wait for the signal to appear. Take the trade. For Binary Options it is advisable to set the expiry time to 5-15 min in M1 chart. THIS INDICATOR IS ZERO REPAINT Best assets to trade: - EUR
Moving Pivot Average    The pivot indicator compares the selected period with its counterpart from the previous period. The indicator uses very flexible algorithm for pivot value calculating. It allows you to allocate in days a certain time intervals (custom bars) and calculate the average pivot value based on High, Low and Close prices of these bars. How many custom bars will be taken into account is determined by the "Days" setting. The pivot line can be considered an average trend line and us
Waka Waka EA
Valeriia Mishchenko
4.25 (48)
EA has a live track record with 4.5 years of stable trading with low drawdown: Live performance MT5 version can be found here Waka Waka is the advanced grid system which already works on real accounts for years. Instead of fitting the system to reflect historical data (like most people do) it was designed to exploit existing market inefficiencies. Therefore it is not a simple "hit and miss" system which only survives by using grid. Instead it uses real market mechanics to its advantage to make p
A arca v1
Wellington Macedo Da Paixao
A arca Funcionalidades Principais Identificação Automática de Zonas Críticas O A arca identifica e destaca automaticamente as regiões de suporte e resistência no gráfico, facilitando a visualização de pontos potenciais de entrada e saída. Sinalização de Entradas e Saídas Apresenta marcadores de compra e venda, ajudando o trader a definir momentos ótimos para abrir ou fechar posições. Análise Multitimeframe Integra dados de diferentes períodos (M5, M15, H1 etc.), permitindo a confluência de si
ORB Williams FPO
Jaime Ynzenga Gimeno
O robô de negociação ORB-Williams FPO é o resultado da combinação de diferentes estratégias Opening Range Breakout (ORB), incluindo Toby Crabel, juntamente com indicadores de tendência adicionais para um melhor sinal de entrada, com a estratégia de saída do primeiro. Abertura lucrativa (FPO) de Larry Williams. Você pode ver o resultado da minha negociação automatizada real em sinais: https://www.mql5.com/en/signals/1481106?source=Site +Signals+Favorites O Opening Range Breakout (ORB) é um int
EARLY REMINDER: The Starting price is 65 price will rise soon up to 365$ and then 750$ after first 10 copies of sales. Grab this offer now! Introduction Hello, traders! Welcome to the demonstration of the Forex Beast Indicator , a comprehensive tool designed to assist aspiring traders in navigating the complexities of the forex market. This indicator incorporates seven essential components to provide a well-rounded trading experience: Moving Averages Colored Zones Support and Resistance Levels
Revolutionize Your Trading with This Powerful Indicator-Based System Are you struggling to find accurate entry and exit points in trading? Do you want a proven, indicator-driven system that helps you maximize profits and minimize risks ? Introducing our Advanced Trading System —a powerful, easy-to-use technical analysis tool designed for forex, stocks, and crypto traders . Key Features & Benefits: Precision Buy & Sell Signals – Our system generates crystal-clear buy (green) and sell (red
Sure Hedging AIEA
Osamudiamen Lambert Osawaru
EnhancedGridAI - Advanced Automated Trading System Comprehensive User Guide & Technical Reference Disclaimer:T rading foreign exchange on margin carries a high level of risk and may not be suitable for all investors. The high degree of leverage can work against you as well as for you. Before deciding to trade foreign exchange, you should carefully consider your investment objectives, level of experience, and risk appetite. The possibility exists that you could sustain a loss of some or all of_
DracoAI
Hua Manh Hung
DracoAI is a revolutionary automated forex trading robot based on neural network.  Loss coverage is our premium exclusive feature. DracoAI IS: THE BEST MONEY MAKING SERVICE & STABLE PASSIVE INCOME PROFIT, EVEN IF YOU DO NOT PARTICIPATE IN BIDDING FINANCIAL INDEPENDENCE AND STABILITY DracoAI IS SAFE, BECAUSE: WE GUARANTEE THE SAFETY OF YOUR FUNDS NEGATIVE RESULTS OF TRADING ARE COVERED BY OUR RESERVE FUND 100% CONFIDENTIALITY Monitoring  - most popular signal at MQL5 :  https://www.mql5.com/en/s
PTW NON REPAINT TRADING SYSTEM + HISTOGRAM Non-Repainting ,   Non-Redrawing   and   Non-Lagging  Trading System. Does the following: - Gives Accurate Entry and Exit Points - Scalping, Day and Swing Trading  - 95% Accuracy  - Targets, where to take profits. - Shows Trends, Support and resistance levels - Works on All Brokers - Works on All Currencies, CFDs and Stocks - It does not place trades for you, it only shows you what trades to place. - It works on All Timeframes - It is for Trend or ran
EA Sky7 Golden
Maulana Bin Ibrahim
For Pair Gold Only Martingle or Single Entry Type. Setting : Layer Entry Style : 1. Pip Step Entry (Recommended for Martingle type) =  Recommended  250 points 2. Instant Entry (Recommended for Single Entry type but no SL) Take Profit option : 1. By Golden Ratio Fibonacci Retracement 2. By Smart Averanging PIPS Lot Size Style : 1. Lot Size Auto 2. Lot Size Manual (Recommended) 3. Lot Size Percentage (Still Working on it) TimeFrame Signal Switch (Auto Scanning) : 1. M5 2. M15 3. M30 4. H1 I'm usi
Goldens Waves
Vladimir Sobolev
Торговая система «Goldens Waves»             «Goldens Waves» —  это мощный торговый робот для MT4, созданный специально для среднесрочной и внутридневной   автоторговли на XAUUSD. Он объединяет передовые алгоритмы автоматической торговли с расширенными возможностями для ручного управления и интеллектуальной защитой депозита. Прямо на графике, встроенные инструменты мониторинга в реальном времени позволяют отслеживать прибыль, убытки и текущий статус. Основа стратегии робота — использование
Bomb Bank Signal
Igor Pereira Calil
5 (1)
Bomb Bank Signal: O Seu Indicador de Confiança no MetaTrader 4 O Bomb Bank Signal é um poderoso indicador para MetaTrader 4, projetado para identificar as tendências mais relevantes no mercado financeiro. Se você está buscando uma ferramenta que antecipe movimentos com precisão, o Bomb Bank é o aliado que você precisa. Como Funciona: Este indicador combina três métodos distintos – análise de volumes, fechamentos de vela e tendência simétrica – para detectar e sinalizar oportunidades de compra e
Gyroscopes
Nadiya Mirosh
Gyroscope        professional forex expert   (for EURUSD, GBPUSD, USDJPY, AUDUSD, USDCHF, EURGBP, EURJPY, NZDUSD, USDCAD, EURCHF, AUDJPY, CADJPY pairs)   alyzing the market using the Elliot Wave Index. Elliott wave theory is the interpretation of processes in financial markets through a system of visual models (waves) on price charts. The author of the theory, Ralph Elliott, identified eight variants of alternating waves (of which five are in the trend and three are against the trend). The mov
The Liquidation Zones Heatmap is a custom technical indicator designed for the MetaTrader 4 (MT4) platform. It calculates and visualizes estimated liquidation zones based on price action and internal algorithms, displaying them as a dynamic heatmap on the chart. These zones represent potential areas of liquidity concentration , where stop-loss clusters or liquidation events may occur. Please note: The levels shown are model-based estimations and do not represent actual or guaranteed liquidation
Clearwater
Tetiana Vieriutina
Unlock the power of precision and reliability with Clearwater, your ultimate trading companion. Clearwater Expert Advisor is an advanced automated trading system meticulously designed to navigate the complex waters of financial markets with finesse and accuracy. Live Signal Key Features: State-of-the-Art Algorithms: Clearwater harnesses cutting-edge algorithms to analyze market trends, identify opportunities, and execute trades with speed and precision. Our robust system is built on a founda
MagicIshimoku
Evgeniy Zhdan
The trading robot works on the basis of determining price consolidation zones due to three overlapping Ishimoku indicator readings with different settings according to the Golden Ratio number. This analysis method allows you to predict price movement with high accuracy. Each position has Stop Loss and Take Profit. Each position is controlled by a short trailing stop. Recommended trading tools, 5m: EURUSD, GBPUSD, USDJPY, USDCAD. Settings: MaxRisk - Percentage risk for the calculation of the tr
Os compradores deste produto também adquirem
FFx Engulfing Setup Alerter gives trade suggestions with Entry, Target 1, Target 2 and StopLoss. Below are the different options available: Entry suggestion - pips to be added over the break for the entry 3 different options to calculate the SL - by pips, by ATR multiplier or at the pattern High/Low 3 different options to calculate the 2 TPs - by pips, by ATR multiplier or at Risk/Reward Offset the dashboard - any place on the chart Remove the suggestion once the price reached the SL line Lines
FFx InsideBar Setup Alerter gives trade suggestions with Entry, Target 1, Target 2 and StopLoss. Below are the different options available: Entry suggestion - pips to be added over the break for the entry Minimum candle size - to avoid too close buy/sell entry suggestions 3 different options to calculate the SL - by pips, by ATR multiplier or at the pattern High/Low 3 different options to calculate the 2 TPs - by pips, by ATR multiplier or at Risk/Reward Offset the dashboard - any place on the c
FFx OutsideBar Setup Alerter gives trade suggestions with Entry, Target 1, Target 2 and StopLoss. Below are the different options available: Entry suggestion - pips to be added over the break for the entry. 3 different options to calculate the SL - by pips, by ATR multiplier or at the pattern High/Low. 3 different options to calculate the 2 TPs - by pips, by ATR multiplier or at Risk/Reward. Offset the dashboard - any place on the chart. Remove the suggestion once the price reached the SL line.
FFx PinBar Setup Alerter gives trade suggestions with Entry, Target 1, Target 2 and StopLoss. Below are the different options available: Entry suggestion - pips to be added over the break for the entry Minimum candle size - to avoid too small candles 3 different options to calculate the SL - by pips, by ATR multiplier or at the pattern High/Low 3 different options to calculate the 2 TPs - by pips, by ATR multiplier or at Risk/Reward Offset the dashboard - any place on the chart Remove the sugges
The purpose of this new version of the MT4 standard indicator provided in your platform is to display in a sub-window multiple timeframes of the same indicator with its divergences. See the example shown in the picture below. But the display isn't like a simple MTF indicator. This is the real display of the indicator on its timeframe. Here's the options available in the FFx divergences indicator: Select the timeframes to be displayed (M1 to Monthly) Define the width (number of bars) for each tim
The purpose of this new version of the MT4 standard indicator provided in your platform is to display in a sub-window multiple timeframes of the same indicator with its divergences. See the example shown in the picture below. But the display isn't like a simple MTF indicator. This is the real display of the indicator on its timeframe. Here's the options available in the FFx divergences indicator: Select the timeframes to be displayed (M1 to Monthly). Define the width (number of bars) for each ti
The FFx Dashboard MTF alerter will show you on a single chart all the timeframes (M1 to Monthly) with their own status for the indicator. 2 Alert Options: Single timeframe: each selected timeframe alert separately when a signal occurs Multi timeframes: all selected timeframes must agree for an alert to be triggered Both options have an input to select the timeframes to be used for the alert(s). How to Understand the Status: Green/Red square: histogram above/below 0 line Green square + Red bord
The FFx Dashboard MTF alerter will show you on a single chart all the timeframes (M1 to Monthly) with their own status for the indicator. 2 Alert Options: Single timeframe: each selected timeframe alert separately when a signal occurs Multi timeframes: all selected timeframes must agree for an alert to be triggered Both options have an input to select the timeframes to be used for the alert(s). How to understand the status: Green/Red square: RSI above/below 50 line Green square + Red border: R
The FFx Dashboard MTF alerter will show you on a single chart all the timeframes (M1 to Monthly) with their own status for the indicator. 2 Alert Options: Single timeframe: each selected timeframe alert separately when a signal occurs Multi timeframes: all selected timeframes must agree for an alert to be triggered Both options have an input to select the timeframes to be used for the alert(s). How to understand the status: Green/Red square: Stoch above/below 50 line Green square + Red border:
The FFx Dashboard MTF alerter will show you on a single chart all the timeframes (M1 to Monthly) with their own status for the indicator. 2 Alert Options: Single timeframe: each selected timeframe alert separately when a signal occurs Multi timeframes: all selected timeframes must agree for an alert to be triggered Both options have an input to select the timeframes to be used for the alert(s). How to understand the status: Green/Red square: Price above/below Cloud (Kumo) Green square + Red bo
The FFx Dashboard MTF alerter will show you on a single chart all the timeframes (M1 to Monthly) with their own status for the indicator. 2 Alert Options: Single timeframe: each selected timeframe alert separately when a signal occurs Multi timeframes: all selected timeframes must agree for an alert to be triggered Both options have an input to select the timeframes to be used for the alert(s). How to understand the status: Green/Red square: MA pointing Up/Down Green square + Red border: MA po
The FFx Dashboard MTF alerter will show you on a single chart all the timeframes (M1 to Monthly) with their own status for the indicator. 2 Alert Options: Single timeframe: each selected timeframe alert separately when a signal occurs. Multi timeframes: all selected timeframes must agree for an alert to be triggered. Both options have an input to select the timeframes to be used for the alert(s). How to understand the status: Green square: Price above PSAR Red square: Price below PSAR Options
The FFx Dashboard MTF alerter will show you on a single chart all the timeframes (M1 to Monthly) with their own status for the indicator. 2 Alert Options: Single timeframe: each selected timeframe alert separately when a signal occurs Multi timeframes: all selected timeframes must agree for an alert to be triggered Both options have an input to select the timeframes to be used for the alert(s). How to understand the status: Green/Red square: CCI above/below levels (ie. 100/-100) Grey square: C
The FFx Dashboard MTF alerter will show you on a single chart all the timeframes (M1 to Monthly) with their own status for the indicator. 2 Alert Options: Single timeframe: each selected timeframe alert separately when a signal occurs Multi timeframes: all selected timeframes must agree for an alert to be triggered Both options have an input to select the timeframes to be used for the alert(s). How to understand the status: Green/Red square: ADX above level Grey square: ADX below level Red bor
The FFx Dashboard MTF alerter will show you on a single chart all the timeframes (M1 to Monthly) with their own status. 2 Alert Options: Single timeframe: each selected timeframe alert separately when a signal occurs Multi timeframes: all selected timeframes must agree for an alert to be triggered Both options have an input to select the timeframes to be used for the alert(s). How to understand the status: Green/Red square: bullish/bearish candle Options available in the FFx Dashboard Alerter
The [GRAFF] III manual trading system is based on multiple MetaTrader (MT4) indicators. Together, the entire PACK of GRAFF III indicators makes an advanced trading tool. The system consists of over 20 different custom-built indicators which have been carefully selected and tested in the long term to produce strong and efficient trading signals. The particular indicators are based on different mathematical formulas, so the entire system is calibrated to remove false signals from its own indicator
FFx Universal Strength Meter PRO is more than a basic strength meter. Instead of limiting the calculation to price, it can be based on any of the 19 integrated strength modes + 9 timeframes. With the FFx USM, you are able to define any period for any combination of timeframes. For example, you can set the dashboard for the last 10 candles for M15-H1-H4… Full flexibility! Very easy to interpret... It gives a great idea about which currency is weak and which is strong, so you can find the best pai
MetaTrader 5 version available here : https://www.mql5.com/en/market/product/24882 FFx Basket Scanner is a global tool scanning all pairs and all timeframes over up to five indicators among the 16 available. You will clearly see which currencies to avoid trading and which ones to focus on. Once a currency goes into an extreme zone (e.g. 20/80%), you can trade the whole basket with great confidence. Another way to use it is to look at two currencies (weak vs strong) to find the best single pairs
MetaTrader 5 version available here: https://www.mql5.com/en/market/product/25794 FFx Pivot SR Suite PRO is a complete suite for support and resistance levels. Support and Resistance are the most used levels in all kinds of trading. Can be used to find reversal trend, to set targets and stop, etc. The indicator is fully flexible directly from the chart 4 periods to choose for the calculation: 4Hours, Daily, Weekly and Monthly 4 formulas to choose for the calculation: Classic, Camarilla, Fibonac
Let´s try to make some real money! Call me profit addicted. I thought why not try to make THE dream come reality. With discipline, a clear strategy and this indicator I focus on entering the perfect trades. This indicator is very easy to use as you will get perfect entry points for Put or Call trades. The arrows are calculated with: -     Momentum  parameters -     Candle stick patterns -     Fundamental Price action We recommend to combine it with Parabolic, ZigZag or Elliot waves indicator
Golden Chip
Daishon Cotman
Golden Chip provides Basic Market Structure, Fibonacci, supply and Demand Zones. Letting you identify when a sell off point is approaching or whne a buy opportunity is arriving. The awesome thing about Golden Chip is that, you will see rejection levels or continuation before ANYBODY ! This indicator moves directly with price and lines up perfectly with the Chart. Some indicators would lag but NOT this one ! Golden Chip is amazing for Clean chart (Naked Chart). GOLDEN CHIP IS ONLY ON METATRADER (
***** The REAL , ORIGINAL, Non-Repainting, Non-Delaying, Arrow Trade Entry indicator for Very Low-Risk market execution ***** ***This is the Golden standard in arrow indicators for MT4.*** BING Setup Arrows Indicator(BSA) will show easy-to-read High Probability trading situations with Non-Repainting , Non-Delaying , Up or Down arrows on the graph.  So simple, it's brilliant. Always shows very good trading setups, no flashy colors, confusing configurations, hard-to-read dashboards, etc.  Perfec
****** Easy to understand, correct Trade direction indicator, quick and easy to visualize******* BING Proper Path Indicator(BPP) will show BUY/SELL signals on-screen in an easy-to-understand 'Traffic Light' format. Provides a final 'reassurance' and 'peace of mind' for taking an educated, high probability, low-risk, trade decision. In the same way, you use a rearview mirror for instantaneous information while taking a driving decision, the same way BING Proper Path Indicator(BPP) will help you
Risk Reward ratio indicator for MT4  BING Risk Reward indicator is a powerful, basic, very needed tool for every trader. Clearly visualize Open Price , Stop Loss , and Top Profit levels on your graphs with easy-to-see colors and trendlines. Does BING Risk Reward show alerts? Of course! BING Risk Reward Indicator offers all Alerts available for the MT4 platform(Email, Popups, Sound, and Push). It shows alerts on Open Price , Stop Loss , and Top Profit. That way, besides easily seeing what is go
The channels
Mansour Rahkhofteh
Counter trade type indicator. Jcounter can capture the timing of the trend collapse phase. There are signs of a trend collapse. It is the world standard to confirm the sign with LSMA adopted by Jcounter. The numerical setting of LSMA is very important, but after many years of verification, the numerical value was identified and completed. When the trend starts, the rising market moves like a support, and the falling market moves like a resistance. Gradually overtake the candlestick and
Axebagsh
Batsukh Sumchin Khuyagbaatar
Only work on Crude Oil H1  time frame  Swing follow trend.  do not trade against trends Specifies the first destination and entry and exit points For 16 years, I only traded on CrudeOil. Crude oil is one of the most extreme combinations in the world and it is safe to say that such a good indicator has never been made before.   This indicator will save you a lot of money because it introduces a new type of approach, Good luck
Forex Signal Generator is a cutting edge technology for Trend Trading, and filtering all inbuilt in one tool. The Signal Generator  analysis the market like a Pro  by using its smart algorithms to detect  the trend, filter out market noise  and display on  your chart with the : ENTRY, STOPLOSS AND TARGET PROFIT Advantages You Get     Access to the proven reliable trend indicator based     Easy and  effective trend detection.     Gives you the ability to filter  out  'NOISE' from the market  
Filtro:
Sem comentários
Responder ao comentário