• Visão global
  • Comentários
  • Discussão

Super Cross Strong Signal

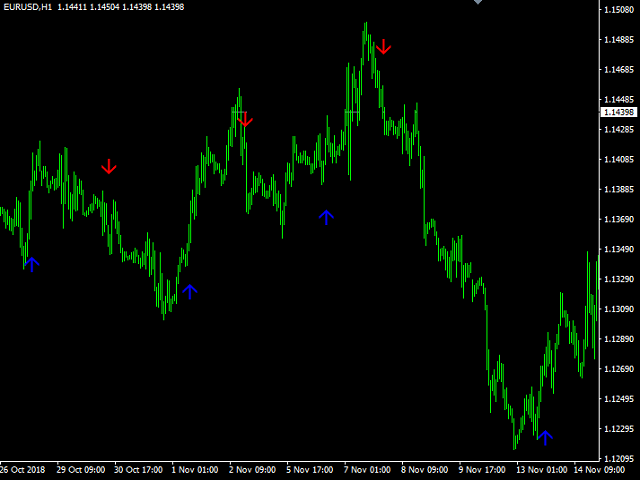
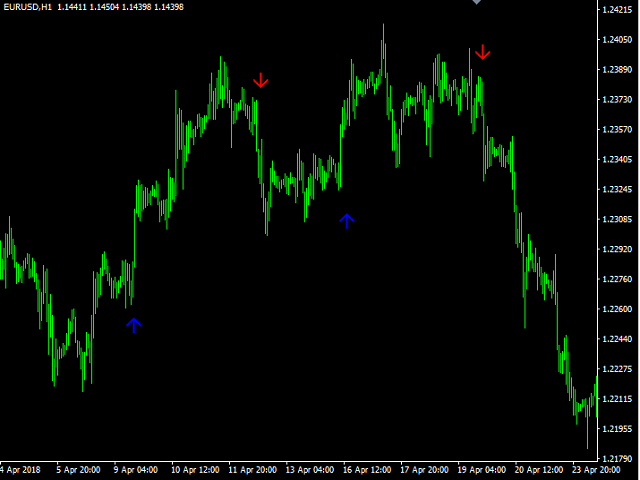
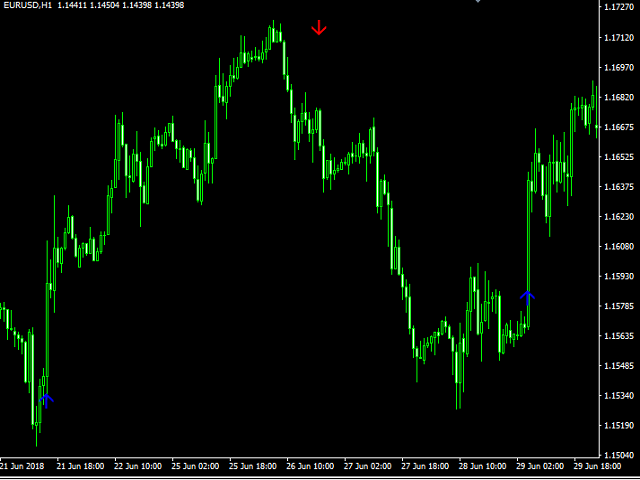
Super Cross Strong Signal is an indicator that generates trade arrows. It generates trade arrows with its own algorithm.

These arrows give buying and selling signals. The indicator certainly does not repaint. Can be used in all pairs. Sends a signal to the user with the alert feature.


Trade rules

  • Enter the signal when the buy signal arrives.
  • In order to exit from the transaction, an opposite signal must be received.
  • It is absolutely necessary to close the operation when an opposite signal is received.
  • These rules must be followed in the sell process.
  • Or the user has to stop the damage and put the profit taking levels.
  • Currency pairs: Any
  • Time interval: M30, H1, H4


Parameters

  • AlertsOn - send alerts. If this feature is activated, it will be activated in other warning properties.
  • AlertsMessage - send a message
  • AlertsSound - sound alert setting
  • AlertsEmail - email alert setting. Send alerts to mail address.


Produtos recomendados
HeikenashiSmoothing
Rodolfo Leonardo De Morais
Heiken ashi  Suavizado em janela separada MTF A cor das velas de Heiken-Ashi dependem de suas sombras.  A vantagem do gráfico de Heiken-Ashi é que a tendência é determinada de uma forma muito simples, as velas com tendência altista são azuis e as com tendência baixista são vermelhas. Para uma negociação lucrativa é necessário usá-lo com as velas padrão (fazer análises) e com os outros indicadores. Parametros do Indicador TimeFrame  - Tempo gráfico sendo 0 = Tempo do gráfico atual, 1 = M1, 5
The indicator determines a special pattern of Joe Dinapoli. It gives very high probability buy and sell signals. Indicator does not repaint. Indicator Usage Buy Signal ''B'' Entry : Market buy order at signal bar close Stop : Low of signal bar Take Profit : First swing high Sell Signal ''S'' Entry : Market sell order at signal bar close Stop : High of signal bar Take Profit : First swing low Indicator Parameters Fast EMA : External Parameter (should be kept as default) Slow EMA: External Param
Using the Arrow Effect forex indicator algorithm, you can quickly understand what kind of trend is currently developing in the market. The Elephant indicator accompanies long trends, can be used without restrictions on instruments or timeframes. With this indicator, you can try to predict future values. But the main use of the indicator is to generate buy and sell signals. The indicator tracks the market trend, ignoring sharp market fluctuations and noises around the average price. The indicator
Introduction to Fractal Pattern Scanner Fractal Indicator refers to the technical indicator that makes use of the fractal geometry found in the financial market. Fractal Pattern Scanner is the advanced Fractal Indicator that brings the latest trading technology after the extensive research and development work in the fractal geometry in the financial market. The most important feature in Fractal Pattern Scanner is the ability to measure the turning point probability as well as the trend probabi
KT Psar Arrows
KEENBASE SOFTWARE SOLUTIONS
KT Psar Arrows plots the arrows on chart using the standard Parabolic SAR indicator. A bullish arrow is plotted when the candle's high touch the SAR. A bearish arrow is plotted when the candle's low touch the SAR. The signals are generated in the real-time without waiting for the bar close.  Features A beneficial tool for traders who want to experiment with the trading strategies that include the use of Parabolic Sar indicator.  Can be used to find turning points in the market. Use custom PSA
Signal Arrows is an indicator that generates trade arrows. It generates trade arrows with its own algorithm. These arrows give buying and selling signals.  Can be used in all pairs. Sends a signal to the user with the alert feature. The indicator certainly does not repaint. Trade rules Enter the signal when the buy signal arrives. In order to exit from the transaction, an opposite signal must be received. It is absolutely necessary to close the operation when an opposite signal is received. Th
ABCD Harmonic Patterns
Mehmet Ozhan Hastaoglu
Thanks to this indicator, you can easily see the new ABCD harmonic patterns in the chart. If the two price action lengths are equal, the system will give you a signal when it reaches the specified level. You can set the limits as you wish. For example, You can get the signal of the price, which occurs in the Fibonaci 38.2 and 88.6 retracements, and then moves for the same length, at the level you specify. For example, it will alarm you when the price reaches 80% as a percentage. In vertic
It's a multi-symbol and multi-timeframe scanner for our indicator - ACB Breakout Arrows . With default settings, it scans for the buy/sell signals on 28 currency pairs and 9 time-frames concurrently .  Features It can scan 252* combinations of symbols and time-frames from a single chart. Open the signal's chart loaded with a predefined template with a single click.  Easy drag n drop anywhere on the chart. Real-time alerts with popup, sound, push-notifications and email alerts.  Input Para
Emergency
Ivan Simonika
Emergency trend technical indicator is used to analyze price movements in the Forex market. It is included in the so-called arrow indicators. And it is very practical in that it forms arrows in places where buy signals appear, or, conversely, sell signals. Naturally, do not forget that any indicator is just an assistant, not a magical tool, by the will of which you will become fabulously rich. Unfortunately, many novice traders forget about this, they see a potential grail in each indicator
Boba Binary
Anthonius Soruh
5 (1)
Result look on  https://t.me/BonosuProBinary Pair : All Forex Pairs Time Frame : M1 Expaired : 1-2 Minutes Trade Time Once Time a Day Backtester, Alert Avaliable Average Signals Generate 5 - 20 Signals All Pair A Day Broker Time Zone GMT+3 Default Setting [Example Broker GMT+3 : Alpari, FBS, XM] Support Broker : Deriv, IQOption, Alpari, Binomo, Olymtrade, Qoutex, GCoption, etc Support Auto Trading : MT2 Trading, Binary Bot, Intrade Bot, Binomo Bot, Olymptrad Bot, MX2 trading, Price Pro, etc Ind
Cota Binary
Anthonius Soruh
5 (2)
Result look on  https://t.me/BonosuProBinary Pair : All Forex Pairs Time Frame : M1 Expaired : 1-2 Minutes Trade Time Once Time a Day Backtester, Alert Avaliable Average Signals Generate 5 - 20 Signals All Pair A Day Broker Time Zone GMT+3 Default Setting [Example Broker GMT+3 : Alpari, FBS, XM] Support Broker : Deriv, IQOption, Alpari, Binomo, Olymtrade, Qoutex, GCoption, etc Support Auto Trading : MT2 Trading, Binary Bot, Intrade Bot, Binomo Bot, Olymptrad Bot, MX2 trading, Price Pro, etc Ind
Trend Tracking System is an indicator that generates trade arrows. It generates trade arrows with its own algorithm. These arrows give buying and selling signals. The indicator certainly does not repaint. The point at which the signal is given does not change. You can use it in all graphics. You can use it in all pairs. This indicator shows the input and output signals as arrows and alert. When sl_tp is set to true, the indicator will send you the close long and close short warnings. It tells yo
Algorithmic Signals indicator   is not an indicator but a strategy that generates entry/exit signals. The entry arrows are formed after multiple conditions are met. The indicator is using an   Adaptive Algorithm   which automatically adjust to the symbol and time frame (see the screenshots below) . Signals can be used for scalping or even trend trading. Main features:- Non repainting signals Entry signals Exit signals Alert for price reaching 1 x ATR(14) (could be utilized for initial take prof
Trading with the Transition to quality indicator is as simple as possible, if a blue arrow appears on the chart pointing up, a buy deal is opened. In the same case, if you see a red arrow pointing down, open a sell order. That is, everything is as simple as possible, positions are closed according to the reverse scheme, that is, as soon as a signal is received to open an order in the opposite direction from your position. For example, you opened a long position (sell), close it when a red arr
RoyalPrince Fibo
Richard Louis Pastor
4.93 (29)
Royal Prince Fibonacci , has the most advance Trend detection algorithm built into its Alert system combined with the RoyalPrince Non-repaint Arrows with it's own alert system you will never miss the opportunity of the trade.  works on all Charts and all Timeframe on mt4. ︎Best Timeframe M15 for scalping  H1 for Day Trading Options: • Fibonacci days High and Lows  • Fibonacci Targets • Fibonacci Alert System • Trend Percentage updated consistently • Trend Long Entry & Exit Alerts • Trend Shor
My indicator is 1000%, it never repaints, it works in every time period, there is only 1 variable, it sends notifications to your phone even if you are on vacation instead of at work, in a meeting, and there is also a robot version of this indicator With a single indicator you can get rid of indicator garbage It is especially suitable for scalping in the m1 and m5 time frames on the gold chart, and you can see long trends in the h1 time frame.
JapaneseBreakout
Ahmet Metin Yilmaz
Instructions Attach the indicator to any chart (advised H4) Use input tabs (defaults are 5 and false ) Press ok and continue trading. Description The indicator uses a kind of pattern breakout strategy to help your trading strategy. I am using this strategy on H4 charts for many of pairs with a trailing stop and default indicator settings. Better results are shown on USDJPY, EURJPY, CADJPY, EURGBP, EURUSD, USDCAD, USDCHF, NZDUSD and GBPUSD. Trailing stops should be different for each pair. The
MoveWave
Andriy Sydoruk
MoveWave - Moving waves are very handy indicators for determining pivot levels. Most Forex traders make decisions based on technical analysis. This type of analysis determines patterns and trends in the market. With the help of complex mathematical equations that are combined and made out in the form of this indicator, the trader will be able to more accurately determine the price reversal levels. Wave theory mathematically represents various behavioral models of the market. It is used as the ba
A useful scanner/dashboard that shows the RSI values for multiple symbols and time-frames. It can be easily hidden/displayed with a simple click on the scanner man top left of the dashboard. You can input upper and lower RSI values and the colours can be set to show when above/below these values. The default values are 70 and 30. There are also input colours for when the RSI is above or below 50 (but not exceeding the upper/lower levels Symbols and time-frames are input separated by comma
First of all, it is worth highlighting here that this Trading Indicator is Non Repainting, Non Redrawing and Non Lagging, which makes it ideal for manual trading. Never repaint and recalculate Once an arrow appears it never disappears, the signal comes at the opening of the new candle You will now be more profitable with this indicator The indicator will alert you when an arrow appears You can do swing trading or scalping trading The indicator helps you identify the trend Can be optimized acros
Scalping arrows not redraw - an indicator that shows price reversal points on the chart and does not redraw its signals. Also, the indicator sends signals to the trader via Email and Push. The accuracy of the signals of this indicator is approximately 92-94% on the M5 timeframe and more than 95% on the H1 timeframe. Thus, this indicator allows the trader to accurately open trades and predict further price movement. Price reversal points on the chart are indicated using simple and understandable
Mystic Arrow
Svyatoslav Kucher
5 (3)
Mystic Arrow - уникальный авторский индикатор, отображающий сигналы в направлении основной тенденции, и против нее. Благодаря разнообразию настроек и фильтров индикатор можно настроить под свой стиль торговли. Mystic Arrow  подходит для любого таймфрейма, валютной пары. Сигналы индикатора не пропадают ни при каких условиях. Отличительной особенностью является возможность настроить сигналы индикатора отдельно для тенденции и против нее. Имеет в качестве отключаемого фильтра показания ценового кан
BinaryMartini
Abdulkarim Karazon
um indicador para negociação binária baseado no cruzamento 3ma com macd, fornece sinais de compra e venda na barra aberta e não repinta ou retrocede o indicador não está focado na alta taxa de ganhos, pois é feito para negociação de martingale, o indicador se concentra na menor contagem de sinais de perda consecutiva. Estratégia : O depósito mínimo é 1.000 unidades, iniciamos a negociação com 1 unidade (o tamanho da negociação é 1 unidade para cada 1.000 capitais) dobramos o tamanho da negoc
Ezy Option Signal
Nirundorn Promphao
The principle of this indicator is very simple: detecting the trend with Moving Average, then monitoring the return point of graph by using the crossing of Stochastic Oscillator and finally predicting BUY and SELL signal with arrows, alerts and notifications. The parameters are fixed and automatically calculated on each time frame. Example: If you install indicator on EURUSD, timeframe M5: the indicator will detect the main trend with the Moving Average on this timeframe (for example the Moving
Impulse fractals indicator - is counter-trend oriented complex market fractal pattern.  Market creates bull/bear impulse, trend starts, fractals on impulsed wave are an agressive pullback signals. Buy arrow is plotted when market is bearish and it's impulse showed up-side fractal, and sell arrow is plotted when market is bullish and it's impulse showed dn-side fractal. Main indicator's adjustable inputs : impulsePeriod - main period of impulse histogram  filterPeriod  - smoothes impulse accordi
Some informations on the chart with the single attachment. RangeBorder Buy Sell (RBBS) Non Repaint Indicator will provide trend line, buy sell arrows,reversal arrows, range channel, order exit area,high average price line and low average price line.All arrows and lines don't repaint and not lagging. Once candle closed it won't  repaint. Reading Indicator: 1. Small Stars , Indicates oversold and overbought with certain logic and price may reverse when this small star triggers. Useful to identif
Contact me for instruction, any questions! Introduction Triangle chart patterns are used in   technical analysis , which is a trading strategy that involves charts and patterns that help traders identify trends in the market to make predictions about future performance.   Triangle Pattern Scanner Indicator It is usually difficult for a trader to recognize classic patterns on a chart, as well as searching for dozens of charts and time frames will take time, and there is also a possibility of a
buy sell star indicator has a different algoritms then up down v6 and buy sell histogram indicators. so that i put this a another indicator on market. it is no repaint and all pairs and all time frame indicator. it need minimum 500 bars on charts. when  the white  x sign on the red histogram that is sell signals. when the white x sign on the blue  histogram that is sell signals. this indicator does not guarantie the win.price can make mowement on direction opposite the signals. this is multi tim
BarInOut
Sergey Shevchenko
The indicator shows the possible direction of the price movement up or down, depending on the appearance of the arrow on the chart. It does not redraw and does not disappear when the direction of movement changes. It works absolutely on all timeframes and currency pairs. The indicator is based on candlestick analysis for a certain period of time. An arrow indicating the possible direction of movement appears as soon as a signal has appeared. The larger the arrow on the chart, the stronger the s
TrendSys
Maryna Shulzhenko
Trend Sys, an indicator designed to detect trends in price movement and allows you to quickly determine the direction of the trend. The best way to trade Trend Sys is to enter the market when Trend Sys peaks and goes the other way. This is a sign of a trend reversal. I hope you enjoy this indicator and leave your comments to make it even better. Good luck and happy trading.
Os compradores deste produto também adquirem
Gann Made Easy
Oleg Rodin
4.92 (53)
Gann Made Easy é um sistema de negociação Forex profissional e fácil de usar, baseado nos melhores princípios de negociação usando a teoria do sr. W. D. Gann. O indicador fornece sinais precisos de COMPRA e VENDA, incluindo níveis de Stop Loss e Take Profit. Você pode negociar mesmo em movimento usando notificações PUSH. Entre em contato comigo após a compra! Vou compartilhar minhas dicas de negociação com você e ótimos indicadores de bônus de graça! Provavelmente você já ouviu muitas vezes sobr
ACTUALMENTE COM 26% DE DESCONTO A melhor solução para qualquer novato ou comerciante especializado! Este Indicador é uma ferramenta comercial única, de alta qualidade e acessível, porque incorporámos uma série de características proprietárias e uma nova fórmula. Com apenas UM gráfico, pode ler a força da moeda para 28 pares de Forex! Imagine como a sua negociação irá melhorar porque é capaz de apontar o ponto exacto do gatilho de uma nova tendência ou oportunidade de escalada? Manual do u
Atomic Analyst
Issam Kassas
5 (3)
Primeiramente, vale ressaltar que este Indicador de Negociação não repinta, não redesenha e não apresenta atrasos, tornando-o ideal tanto para negociação manual quanto automatizada. O Analista Atômico é um Indicador de Ação de Preço PA que utiliza a força e o momentum do preço para encontrar uma vantagem melhor no mercado. Equipado com filtros avançados que ajudam a remover ruídos e sinais falsos, e aumentam o potencial de negociação. Utilizando múltiplas camadas de indicadores complexos, o A
TPSproTREND PrO
Roman Podpora
5 (15)
TPSpro TRENDPRO  - is a trend indicator that automatically analyzes the market and provides information about the trend and each of its changes, as well as giving signals for entering trades without redrawing! The indicator uses each candle, analyzing them separately. referring to different impulses - up or down impulse. Exact entry points into transactions for currencies, crypto, metals, stocks, indices!  -  Version MT5               DETAILED DESCRIPTION        /       TRADING SETUPS           
TPSpro RFI Levels
Roman Podpora
5 (13)
A key element in trading is zones or levels from which decisions to buy or sell a trading instrument are made. Despite attempts by major players to conceal their presence in the market, they inevitably leave traces. Our task was to learn how to identify these traces and interpret them correctly. Reversal First Impulse levels (RFI)   -  Version MT5                INSTRUCTIONS                 RUS                 ENG                                       R ecommended to use with an indicator   -  
Scalper Vault
Oleg Rodin
5 (27)
Scalper Vault é um sistema profissional de escalpelamento que fornece tudo o que você precisa para um escalpelamento bem-sucedido. Este indicador é um sistema de negociação completo que pode ser usado por comerciantes de forex e opções binárias. O período de tempo recomendado é M5. O sistema fornece sinais de seta precisos na direção da tendência. Ele também fornece sinais superiores e inferiores e níveis de mercado Gann. Os indicadores fornecem todos os tipos de alertas, incluindo notificações
Antes de tudo, vale ressaltar que esta Ferramenta de Negociação é um Indicador Não Repintante, Não Redesenhante e Não Atrasado, o que a torna ideal para negociação profissional. O Indicador de Conceitos de Ação de Preço Inteligente é uma ferramenta muito poderosa tanto para traders novos quanto experientes. Ele combina mais de 20 indicadores úteis em um único, combinando ideias avançadas de negociação como Análise do Trader do Círculo Interno e Estratégias de Negociação de Conceitos de Dinhei
Descubra o segredo da negociação forex bem -sucedida com nosso indicador MT4 personalizado! Você já se perguntou como obter sucesso no mercado de Forex, obtendo lucros consistentemente e minimizando o risco? Aqui está a resposta que você está procurando! Permita -nos apresentar nosso indicador proprietário do MT4 que revolucionará sua abordagem à negociação. Versatilidade única Nosso indicador foi projetado especialmente para usuários que preferem as formações de vela Renko e Rangebar. En
FX Power MT4 NG
Daniel Stein
5 (9)
Receba a sua atualização diária do mercado com detalhes e screenshots através do nosso Morning Briefing aqui no mql5 e no Telegram ! O FX Power MT4 NG é a próxima geração do nosso medidor de força de moeda muito popular de longa data, o FX Power. E o que é que este medidor de força da próxima geração oferece? Tudo o que adorou no FX Power original MAIS Análise de força GOLD/XAU Resultados de cálculo ainda mais precisos Períodos de análise configuráveis individualmente Limite de cálculo personal
Scalper Inside PRO
Alexey Minkov
4.75 (55)
SALE NOW! Limited Time Offer! An exclusive indicator that utilizes an innovative algorithm to swiftly and accurately determine the market trend. The indicator automatically calculates opening, closing, and profit levels, providing detailed trading statistics. With these features, you can choose the most appropriate trading instrument for the current market conditions. Additionally, you can easily integrate your own arrow indicators into Scalper Inside Pro to quickly evaluate their statistics and
Apresentando       Quantum Trend Sniper Indicator   , o inovador Indicador MQL5 que está transformando a maneira como você identifica e negocia as reversões de tendência! Desenvolvido por uma equipe de traders experientes com experiência comercial de mais de 13 anos,       Indicador de Atirador de Tendência Quântica       foi projetado para impulsionar sua jornada de negociação a novos patamares com sua forma inovadora de identificar reversões de tendência com precisão extremamente alta. ***C
Actualmente 20% OFF ! A melhor solução para qualquer novato ou comerciante especializado! Este software de painel de instrumentos está a funcionar em 28 pares de moedas. É baseado em 2 dos nossos principais indicadores (Advanced Currency Strength 28 e Advanced Currency Impulse). Dá uma grande visão geral de todo o mercado Forex. Mostra valores avançados de força da moeda, velocidade de movimento da moeda e sinais para 28 pares de divisas em todos os (9) períodos de tempo. Imagine como a sua
Break and Retest
Mohamed Hassan
5 (7)
‍You can visually backtest Break & Retest to see how it behaved in the past!     Manual guide:   Click here $65  for only 2  copies left! Next price is $120 .  This Indicator only places quality trades when the market is really in your favor with a clear break and retest. Patience is key with this price action strategy! After many months of hard work and dedication, we are extremely proud to present you our  Break and Retest price action indicator created from scratch. One o
Advanced Supply Demand
Bernhard Schweigert
4.92 (310)
Atualmente com 33% de desconto! A melhor solução para qualquer Trader Novato ou especialista! Este indicador é uma ferramenta de negociação exclusiva, de alta qualidade e acessível porque incorporamos uma série de recursos proprietários e uma nova fórmula. Com esta atualização, você poderá mostrar fusos horários duplos. Você não só será capaz de mostrar um TF mais alto, mas também mostrar ambos, o TF do gráfico, MAIS o TF mais alto: MOSTRANDO ZONAS ANINHADAS. Todos os traders de Oferta e Demanda
Currency Strength Wizard é um indicador muito poderoso que fornece uma solução completa para uma negociação bem-sucedida. O indicador calcula o poder deste ou daquele par forex usando os dados de todas as moedas em vários intervalos de tempo. Esses dados são representados em uma forma de índice de moeda fácil de usar e linhas de energia de moeda que você pode usar para ver o poder desta ou daquela moeda. Tudo o que você precisa é anexar o indicador ao gráfico que deseja negociar e o indicador mo
Quantum Breakout Indicator PRO
Bogdan Ion Puscasu
4.96 (26)
Apresentando       Quantum Breakout PRO   , o inovador Indicador MQL5 que está transformando a maneira como você negocia Breakout Zones! Desenvolvido por uma equipe de traders experientes com experiência em negociação de mais de 13 anos,   o Quantum Breakout PRO   foi projetado para impulsionar sua jornada comercial a novos patamares com sua estratégia inovadora e dinâmica de zona de rompimento. O Quantum Breakout Indicator lhe dará setas de sinal em zonas de breakout com 5 zonas-alvo de luc
Apresentamos o Indicador Milagroso de Forex: Desencadeie o Poder da Negociação Precisa Você está cansado de procurar o melhor indicador de Forex que realmente ofereça resultados excepcionais em todos os períodos de tempo? Não procure mais! O Indicador Milagroso de Forex chegou para revolucionar sua experiência de negociação e impulsionar seus lucros a novas alturas. Construído com base em tecnologia de ponta e anos de desenvolvimento meticuloso, o Indicador Milagroso de Forex se destaca como o á
FX Volume
Daniel Stein
4.6 (35)
Receba a sua atualização diária do mercado com detalhes e screenshots através do nosso Morning Briefing aqui no mql5 e no Telegram ! O Volume FX é o PRIMEIRO e ÚNICO indicador de volume que fornece uma visão REAL do sentimento do mercado do ponto de vista de um corretor. Ele fornece uma visão incrível de como os participantes do mercado institucional, como corretores, estão posicionados no mercado Forex, muito mais rápido do que os relatórios COT. Ver essas informações diretamente no seu gráfi
GOLD Impulse with Alert
Bernhard Schweigert
4.56 (9)
Este indicador é uma super combinação dos nossos 2 produtos Advanced Currency IMPULSE with ALERT  +   Currency Strength Exotics . Funciona para todos os períodos de tempo e mostra graficamente impulso de força ou fraqueza para as 8 principais moedas mais um Símbolo! Este Indicador é especializado para mostrar a aceleração da força da moeda para quaisquer símbolos como Ouro, Pares Exóticos, Commodities, Índices ou Futuros. É o primeiro do seu género, qualquer símbolo pode ser adicionado à
PZ Harmonacci Patterns
PZ TRADING SLU
3.43 (7)
Este é sem dúvida o indicador de reconhecimento automático de formação de preço harmônico mais completo que você pode encontrar para a MetaTrader Platform. Ele detecta 19 padrões diferentes, leva as projeções de Fibonacci tão a sério quanto você, exibe a Zona de Reversão Potencial (PRZ) e encontra níveis adequados de stop loss e take-profit. [ Guia de instalação | Guia de atualização | Solução de problemas | FAQ | Todos os produtos ] Detecta 19 formações harmônicas de preços diferentes Tr
Price Action Entry Alerts
Stephen Sanjeeve Sahayam
5 (3)
Este indicador analisa cada barra de pressão de compra ou venda e identifica 4 tipos de padrões de velas com o maior volume. Essas velas são filtradas usando vários filtros lineares para mostrar sinais de compra ou venda. Os sinais funcionam melhor, em conjunto com a direção do período de tempo mais alto e quando negociados durante as horas de alto volume. Todos os filtros são personalizáveis ​​e funcionam de forma independente. Pode visualizar sinais de uma única direção com o clique de um bot
TrendMaestro
Stefano Frisetti
5 (2)
note: this indicator is for METATRADER4, if you want the version for METATRADER5 this is the link: TRENDMAESTRO recognizes a new TREND in the bud, he never makes mistakes. The certainty of identifying a new TREND is priceless. DESCRIPTION TRENDMAESTRO identifies a new TREND in the bud, this indicator examines the volatility, volumes and momentum to identify the moment in which there is an explosion of one or more of these data and therefore the moment in which prices have strong probability of f
Indicator : RealValueIndicator Description : RealValueIndicator is a powerful tool designed specifically for trading on the EURUSD pair. This indicator analyzes all EUR and USD pairs, calculates their real currency strength values, and displays them as a single realistic value to give you a head start on price. This indicator will tell you moves before they happen if you use it right. RealValueIndicator allows you to get a quick and accurate overview of the EURUSD currency pair tops and bottoms,
TrendDecoder Premium
Christophe, Pa Trouillas
5 (3)
Identifica os intervalos e os próximos movimentos prováveis   |  Obter os primeiros sinais e a força das tendências   |  Obter saídas claras antes da reversão   |  Detetar os níveis Fibo que o preço irá testar Indicador não repintável e não atrasado - ideal para trading manual e automatizado - adequado para todos os activos e todas as unidades de tempo Oferta por tiempo limitado >>   50% OFF Após a compra,   por favor contacte-me neste canal  para obter as definições recomendadas Versão   MT5 :
AW Trend Predictor
AW Trading Software Limited
4.74 (39)
A combinação de níveis de tendência e quebra em um sistema. Um algoritmo de indicador avançado filtra o ruído do mercado, determina a tendência, os pontos de entrada e os possíveis níveis de saída. Os sinais indicadores são registrados em um módulo estatístico, que permite selecionar as ferramentas mais adequadas, mostrando a eficácia do histórico do sinal. O indicador calcula as marcas Take Profit e Stop Loss. Manual e instrução ->   Aqui   / versão MT5 ->   Aqui Como negociar com o indicador:
ICT, SMC, SMART MONEY CONCEPTS, SMART MONEY, Smart Money Concept, Support and Resistance, Trend Analysis, Price Action, Market Structure, Order Blocks, BOS/CHoCH,   Breaker Blocks ,  Momentum Shift,   Supply&Demand Zone/Order Blocks , Strong Imbalance, HH/LL/HL/LH,    Fair Value Gap, FVG,  Premium  &   Discount   Zones, Fibonacci Retracement, OTE, Buy Side Liquidity, Sell Side Liquidity, BSL/SSL Taken, Equal Highs & Lows, MTF Dashboard, Multiple Time Frame, BigBar, HTF OB, HTF Market Structure, 
PipFinite Exit Scope
Karlo Wilson Vendiola
4.95 (21)
Did You Have A Profitable Trade But Suddenly Reversed? Exiting a trade is equally important as entering! Exit Scope helps maximize your current trade profit and avoid turning winning trades to losers. Attention Exit Signals are NOT to be used in entering a trade! Exit means closing your trades to avoid correction/reversal which can wipe out existing profit or haunt break-even orders. Please watch presentation (Click Here) Features Generates instant exit signals based on price action, volat
TPA True Price Action indicator reveals the true price action of the market makers through 100% non-repainting signals (except early signals mode) strictly at the close of a candle! TPA shows entries and re-entries, every time the bulls are definitely stronger than the bears and vice versa. Not to confuse with red/green candles. The shift of power gets confirmed at the earliest stage and is ONE exit strategy of several. There are available now two free parts of the TPA User Guide for our custo
Master Pullback
TDINVEST LLP
5 (3)
- 50% OFF - Telegram group : https://t.me/+5RIceImV_OJmNDA0 MT5 version : https://www.mql5.com/en/market/product/85917?source=Site+Market+Product+Page Master Pullback is a complete system that gives unique trading opportunities and a clear indication of the market: trend, signals as well as stop loss and take profit levels. This system has been designed to be as simple as possible and detects extreme overbought and oversold zones, support and resistance levels, as well as the major trend. You
ACTUALMENTE 31% DE DESCONTO!! A melhor solução para qualquer novato ou comerciante especializado! Este indicador é uma ferramenta comercial única, de alta qualidade e acessível, porque incorporámos uma série de características proprietárias e uma fórmula secreta. Com apenas UM gráfico, dá alertas para todos os 28 pares de moedas. Imagine como a sua negociação irá melhorar porque é capaz de identificar o ponto exacto de desencadeamento de uma nova tendência ou oportunidade de escalada! Con
Mais do autor
Multiple RSI
Harun Celik
4.5 (2)
Multiple RSI indicator works based on the standard RSI indicator. This indicator will display the RSI indicator from different timeframes on one screen. You will see the RSI indicator for all timeframes on one screen. This indicator saves you from constantly changing charts. At the same time you can analyze the operations of other graphs relative to each other. Features This indicator shows the RSI graph of the timeframe you are working on and the upper timeframe graphs. For example, if you ru
FREE
Super Trend Bars is a trend finding indicator. It tries to find the trends that are most likely to trend. A set of indicators and a set of algorithms. Trend probability changes color when it finds a high trend. The red color represents the declining trend. The lime color represents the upward trend. Super Trend Bar changes color when it finds a trend. Features This indicator is a trend indicator by itself. It can operate without the need for additional indicators. When you see the first lime c
The High and Low Points indicator is designed to calculate potential order points. The main feature of this indicator is to specify the points that the price can not exceed for a long time. The market always wants to pass points that can not pass. It is necessary to place an order waiting for this point indicated by this indicator. Is an indicator that constitutes many EA strategies. Designed for manual trading. Transaction Strategies High point buy stop order Low point sell stop order For exa
HC Cross Signal
Harun Celik
5 (2)
This indicator uses Donchian channel and ATR indicators. This trend tracking system uses historical data to buy and sell. This indicator does not repaint. The point at which the signal is given does not change. You can use it in all graphics. You can use it in all pairs. This indicator shows the input and output signals as arrows and alert. Open long deals on blue arrows Open short deals on red arrows When sl_tp is set to true, the indicator will send you the close long and close short warnings.
Are you tired of channeling? This indicator is designed to draw channels. Triple graphics channels, automatically installs 3 different graphics channels. These channels are shown on a single graphic. These channels are calculated by a number of different algorithms. Automatically draws on the screen. You can select three time zones. Parameters Period1 - from here you can select the first period. It can be selected from 1 minute time period to monthly time period. Period1_Channel_Color - period
‌This indicator indicates potential entry points. Rsi indicator and console wax combination. In addition to the signals in the graphic arrows, text comments are also used. Features Works on any currency pairs. It works in all periods. Sensitivity setting. You can set the signal frequency. Use recommended standard settings. ‌The greatest feature of this display is the possibility of manual martingale. The signal intensity region tends to go in the direction of the signal. Works on all charts.
Pivot Trend
Harun Celik
5 (2)
Pivot trend indicator is a trend indicator that uses standard pivot calculation and some indicators. The purpose of the indicator is to calculate the possible trends using the pivot point. And to give the user an idea about trend direction. You can use this display as a trend indicator. Or with other indicators suitable for your strategy. Features The green bar represents the upward trend. The red bar represents the downward trend. The blue pivot point represents the upward trend. The yellow p
Strong trend indicator is a special indicator designed to capture healthy signals. There are lines showing the signal of the indicator and the power of buying and selling. The signal line is yellow. The green lines are Buy lines. The ones that are brown are Sell lines. The green line must close above the yellow line to perform the operation. The brown line must close above the yellow line to sell. The important line is the first one that closes above the yellow line. If the first line is green,
Trend Guess
Harun Celik
3 (2)
The ”Trend Guess” is a complex software that does not involve the MACD, RSI or moving averages. It adapts itself to current market conditions using complicated algorithms based on price action and out custom indicators. The indicator will gives you trading signals Buy or Sell stop loss levels indicated in the popup alert window and graphically. You have to do is to press buy or sell button whenever you get a signal Important Rules Identify a current long term trend. Example – if you trade on a
Box martingale system is an indicator designed to trade martingale. This indicator sends a signal from the highest point where the trend is likely to return. With these signals the user starts the trades. These signals appear in the form of a box. The user can see from which point the signal is given. The important thing in trading martingale is to find a good starting point. This indicator provides this starting point. Trade rules Start processing when the first trade signal arrives. The impo
HC candlestick pattern is a simple and convenient indicator able to define candle patterns.‌ Candlestick charts are a type of financial chart for tracking the movement of securities. They have their origins in the centuries-old Japanese rice trade and have made their way into modern day price charting. Some investors find them more visually appealing than the standard bar charts and the price action is easier to interpret. Hc candlestick pattern is a special indicator designed to find divergence
Face smiling trend indicator is an oscillator designed to search for turning points. Face smiling trend indicator represents an oscillator that uses in his work an average price for a certain period and is designed to determine the price reversal points. Face smiling trend indicator oscillates between 0.00 (oversold) and 105 (overbought) values depending upon market conditions. Red bars suggest bearish pressure and blue bars bullish pressure. Typically, a reversal of the trend occurs when achiev
The Stubborn Scalper indicator can run in any currency pair and at any time interval. The larger the time interval, the less false signals are obtained. Always choose a larger time interval for healthy signals. Trade rules Turn on the Buy action when the Stubborn Scalper indicator turns blue and the trend up warning is displayed. The Stop Loss is set to the level at the end of the green circle. Turn off the operation when the Stubborn Scalper indicator is green or red. Turn on the Sell action
Big Trend Signal   indicator is designed for trend and signal trading. This indicator generates trend signals.  It uses many algorithms and indicators to generate this signal. It tries to generate a signal from the points with the highest trend potential. This indicator is a complete trading product. This indicator does not need any additional indicators.  You can only trade with this indicator. The generated signals are displayed on the graphical screen.  Thanks to the alert features you can ge
This indicator is designed to find the difference in price and indicator. This indicator uses various indicators. These indicators RSI, Macd, Momentum, RVI, Stochastic, Standard deviation, Derivative, Williams, and custom. You can use these indicators by selecting the indicator type section. This indicator shows the price and indicator difference on the screen. Indicators are individually selectable. You can use the custom type to enter the desired parameters. The user is alerted with the alert
Undefeated trend indicator, an indicator that uses MacD and Bollinger bands. It is a coded indicator to find trends. It finds these trends by its own algorithm. This indicator requires visual monitoring. It does not give any warning because it needs visual follow-up. The main trendline should turn down to find the down trend. The main trend line should go under the white line and then go under the yellow line. The main trendline should turn upward to find the upward trend. The main trend line sh
Super signal series magic arrows is an indicator that generates trade arrows. It generates trade arrows with its own algorithm. These arrows give buying and selling signals. The indicator certainly does not repaint. Can be used in all pairs. Sends a signal to the user with the alert feature. Trade rules Enter the signal when the buy signal arrives. In order to exit from the transaction, an opposite signal must be received. It is absolutely necessary to close the operation when an opposite sign
This indicator is designed to filter trends. Using the RSI indicator we know. It is aimed to confirm trends with this indicator. Can be used alone. It can be used as an indicator to help other indicators. He is already a trend indicator. You can confirm the signals given by other indicators according to your strategy with this indicator. The RSI Trend Filtering indicator confirms trends using a number of complex algorithms. Red below trend zero represents the downward trend. If trend is blue abo
Colored trend indicator is a trend indicator that uses Average True Range and Standard Deviation indications. It is aimed to find more healthy trends with this indicator. This indicator can be used alone as a trend indicator. Detailed review 4 different trend colors appear on this indicator. The blue color represents the upward trend. The dark blue color has a tendency to decline after rising from the rising trend. The red color represents the declining trend. The dark red color has a tendency
Super signal series trend arrows is an indicator designed to generate trading signals. This indicator uses a number of different indicators and generates a signal using a number of historical data. It generally tries to calculate the trend return points. These trend returns may be sometimes very large, sometimes small. The investor should act with the belief that the signal may be small. Monthly median produces 5 to 10 signals. These signals vary according to market conditions. The signals do no
The EMA Trend indicator is a trend indicator using two moving averages. These two moving average is the main trend indicator with 89 EMA. 89 EMA is generally regarded as a trend in the Forex market. The second moving average is 49 EMA. A trend was created using two moving averages. You can use this display alone as a trend indicator. Or with other indicators suitable for your strategy. This indicator sends a warning every new trend starts. Features You can select and edit the periods. Time fra
Every successful trader knows what support and resistance spots are working. And always know that these points need to be kept in mind. They always trade according to this point. The support and resistance point indicator operates in two different modes. The first is the standard support and resistance points we know. The second is Fibonacci levels. This indicator automatically calculates and displays the support and resistance points on the screen. Features You can select the time frame you w
Real Trend Lines is an indicator that calculates trends using a set of channels and using a set of algorithms. This indicator helps to find trend return points. It generally represents an oscillator. This trend tracking system helps the investor to understand small or large trends and determines the direction according to it. Trending features Up trend Rule 1 - yellow trend line should be below zero level. Rule 2 - the yellow trend line should be in the green and orange channel. Rule 3 - the t
Super signal series mystery arrows is an indicator designed to generate trading signals. This indicator uses a number of different indicators and generates a signal using a number of historical data. Currency pairs:  Any Time interval:  M5, M15, M30. Suggested M5 Work with at least 20 pairs Parameters AlertsOn -  send alerts. If this feature is activated, it will be activated in other warning properties. AlertsMessage -  send a message AlertsSound -  sound alert setting AlertsEmail -  email al
Super oscillator indicator is an oscillator designed to calculate trend reversal points. A set of bar calculations and a set of algorithms to calculate trend reversals. Level probing system with high probability trends. All of these features combine to make it easier for investors to find trends. Suggestions and Features There are two levels on the super oscillator indicator. They are at levels of 0.5 and -0.5. The oscillator bar should be below -0.5 to find the upward trend. And a blue color
The super oscillator trading system is a trend finding tool. This system consists of a few indicators and a few algorithms. The aim of this indicator is to direct the investor to find healthy trends. Trade Rules This indicator has two channel lines. These channels are red lines below zero and above zero. There is a line in two places to process. These are blue lines. There is one trend line, the yellow line. Up trend rules Rule 1 - the yellow trend line should close below the red line below th
The trend beads indicator is software that does not include trend indicators such as moving average, Bollinger bands. This indicator works entirely with price and bar movements. The purpose of the indicator is to calculate the most likely trends. To assist the user in determining trend trends. The user determines the trend direction with the colors on the screen. You can use this indicator alone as a trend indicator. Or with other indicators suitable for your strategy. Trade Rules Rising trend
The I Return Signal indicator is a product designed for signal trading. This indicator works by using a number of factors such as a set of indicators, recent history data, bar combinations, price movements, custom filtering system and various algorithms. It uses all of these factors at the same time and generates turn signals. The signals are generated by calculating from the highest possible points of the signal. This indicator is easy to use and understandable. Thanks to the warning features,
The Super Cross Trend indicator is designed for trend and signal trading. This indicator generates trend signals. It uses many algorithms and indicators to generate this signal. It tries to generate a signal from the points with the highest trend potential. This indicator is a complete trading product. This indicator does not need any additional indicators. You can only trade with this indicator. The generated signals are displayed on the graphical screen. Thanks to the alert features you can ge
The Signal MACD product is an indicator that works with the standard MACD indicator. This indicator is designed to do signal trading using the objective MACD indicator and a set of algorithms. This indicator can be used both as an oscillator and as a signal producing product. So you can use this indicator in two goal. When the indicator finds a signal, it shows arrow marks on the oscillator. These arrows allow investors to trade. Trade Rules "Buy" action when you see a green arrow and receive
Filtro:
Sem comentários
Responder ao comentário