Signal Zero Risk
- Indicadores
- Harun Celik
- Versão: 1.0
- Ativações: 5
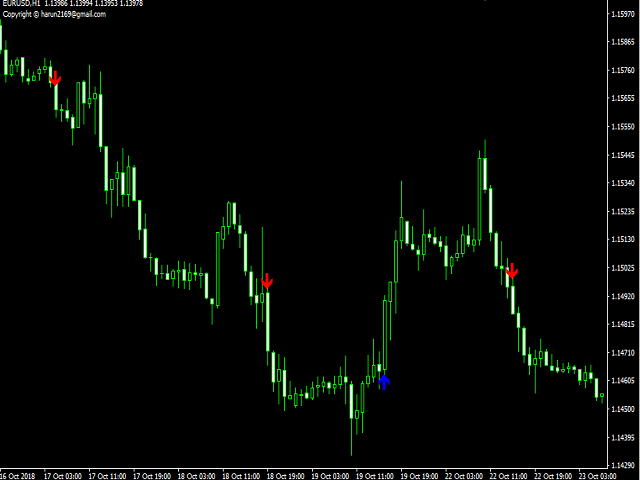
This Signal Zero Risk indicator uses Donchian channel and ATR indicators. This trend tracking system uses historical data to buy and sell.
This indicator does not repaint. The point at which the signal is given does not change. You can use it in all graphics. You can use it in all pairs.
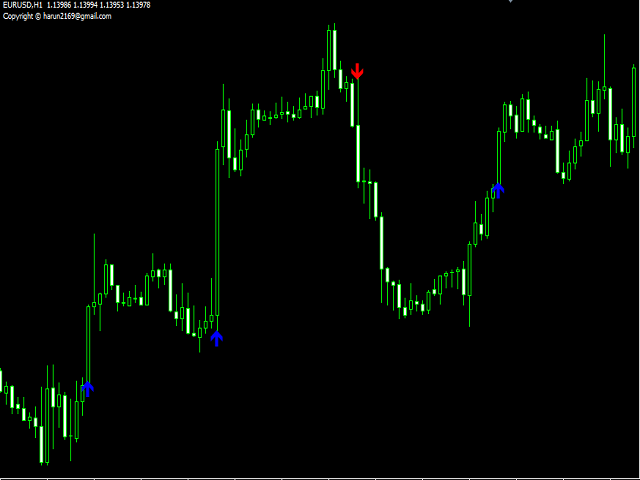
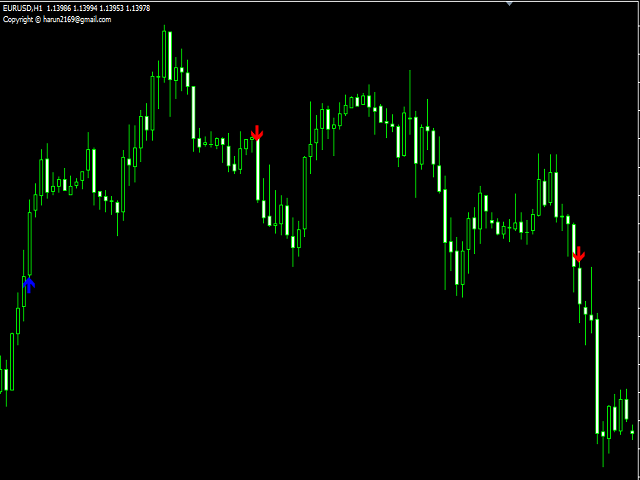
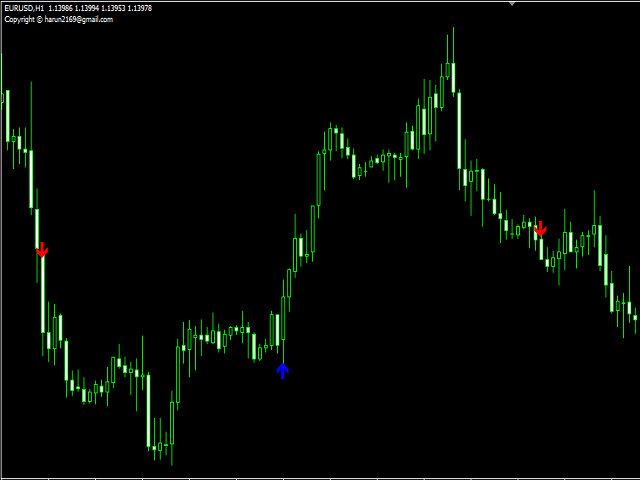
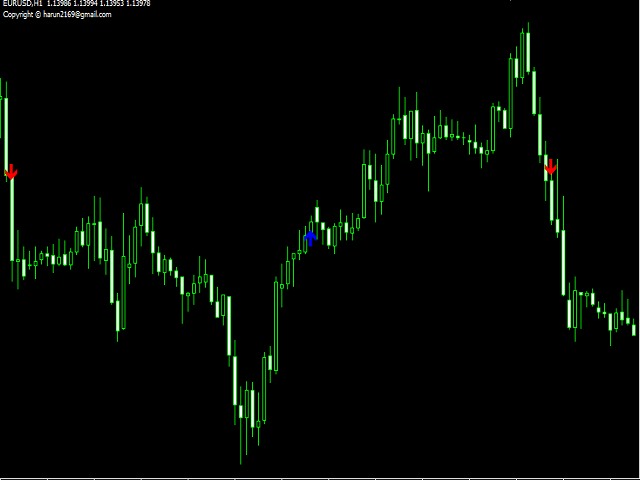
This indicator shows the input and output signals as arrows and alert.
- Open long deals on blue arrows
- Open short deals on red arrows
- It tells you that you should quit the transaction.
Parameters
- Alerts - notification feature