KT Support and Resistance Levels
Use of support and resistance in systematic trading is very subjective. Every trader has their own idea and way to plotting the support and
resistance levels on the chart. KT Support and Resistance indicator take out this ambiguity out of the situation and automatically
draws support and resistance levels following an algorithmic approach using a unique multi-timeframe analysis.
When launched on the chart, It immediately scan the most significant extreme points across all the available timeframes and saves
them for further analysis. A special algorithm then populates and iterates the stored extreme points for final selection.
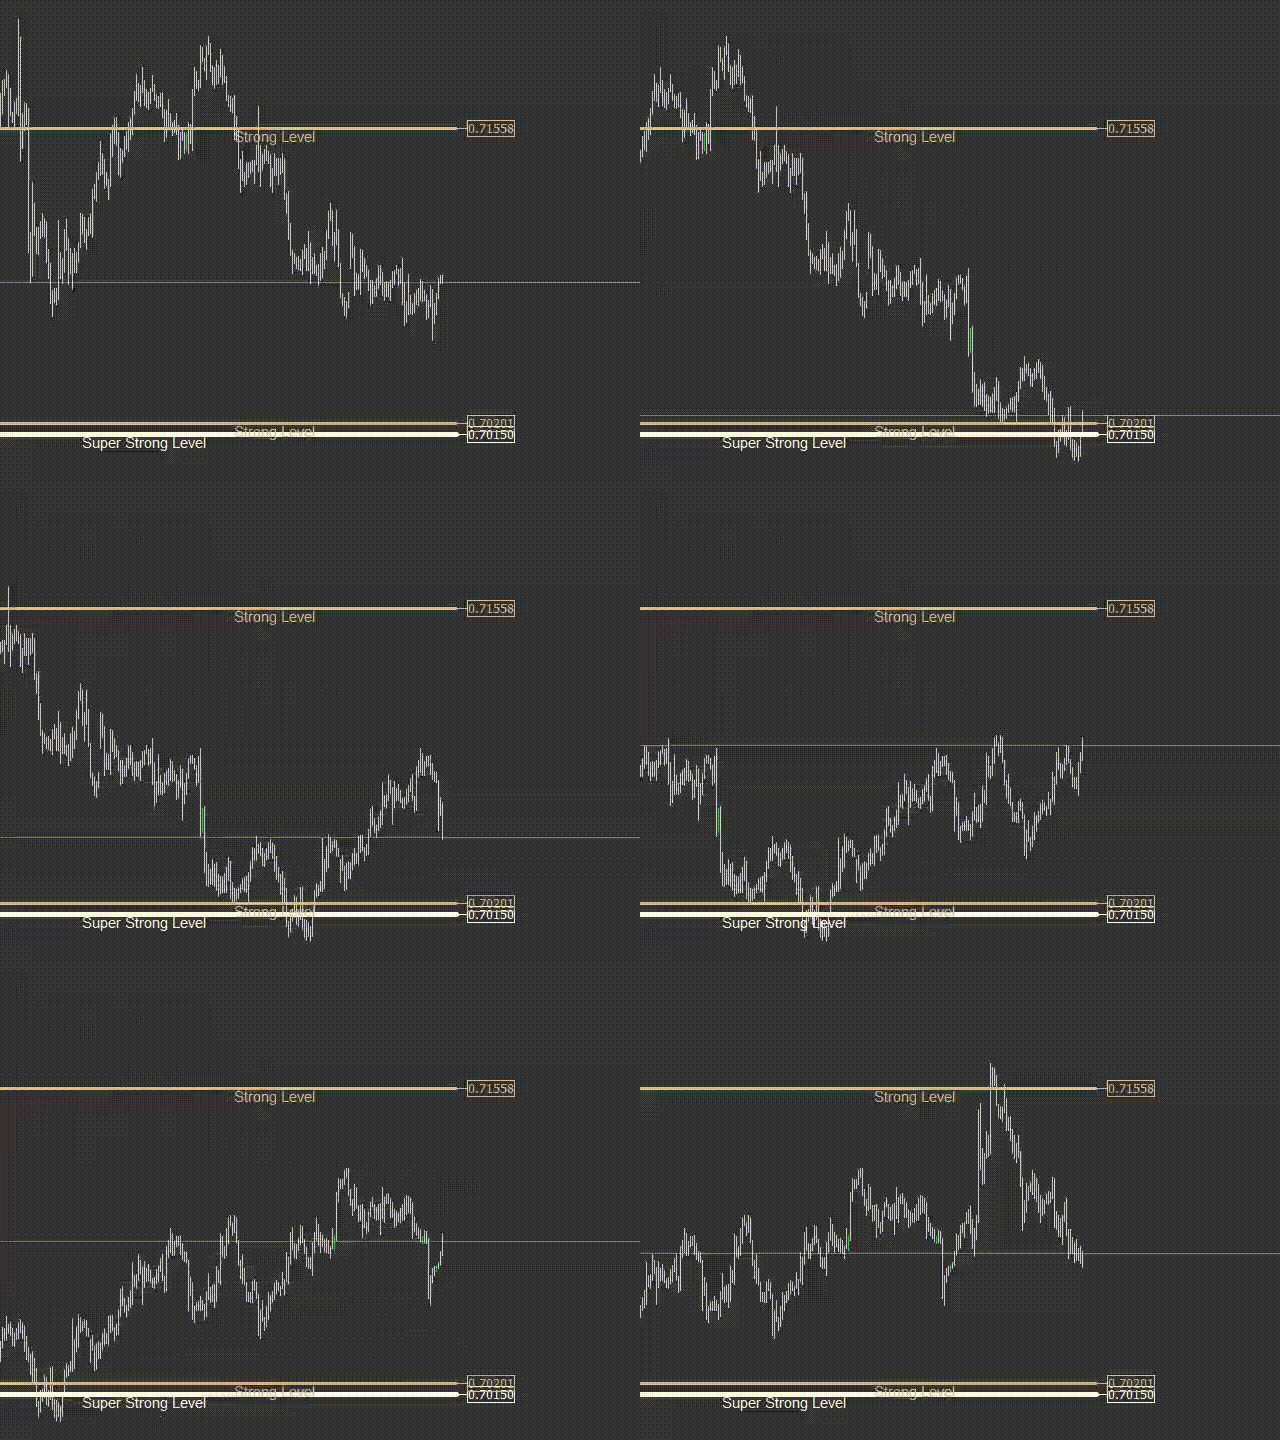
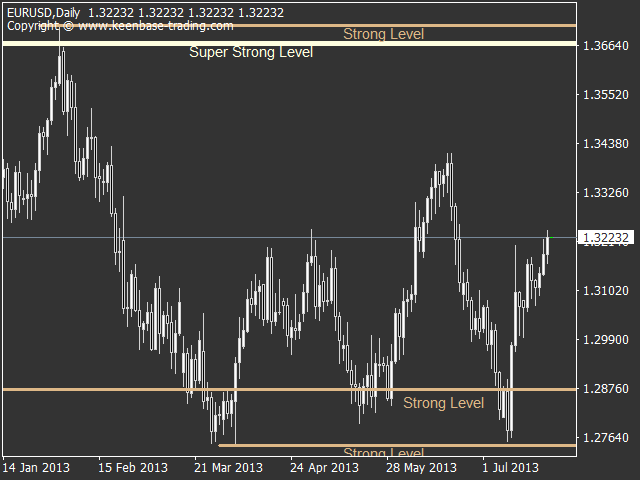
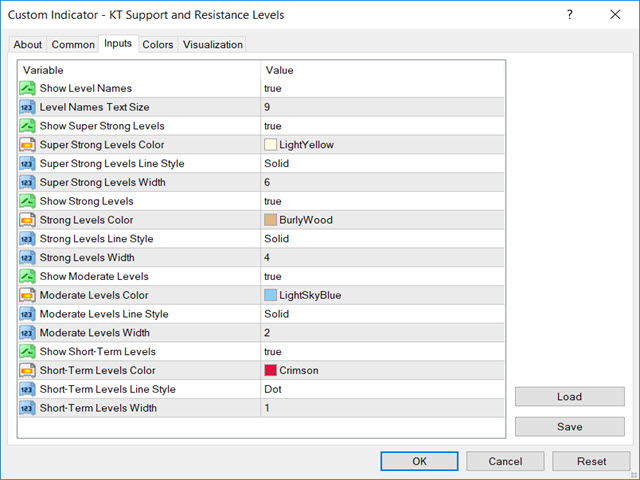
This indicator plot four types of support/resistance levels:
- Super Strong Levels: These levels are the most substantial levels among all. Price is very likely to respect "Super
Strong Levels" and often bounce back after testing them.
- Strong Levels: These are also substantial levels and price often respect them but not as much as their predecessor. If
price breaks them with a significant margin, you can expect a continuation in the same direction.
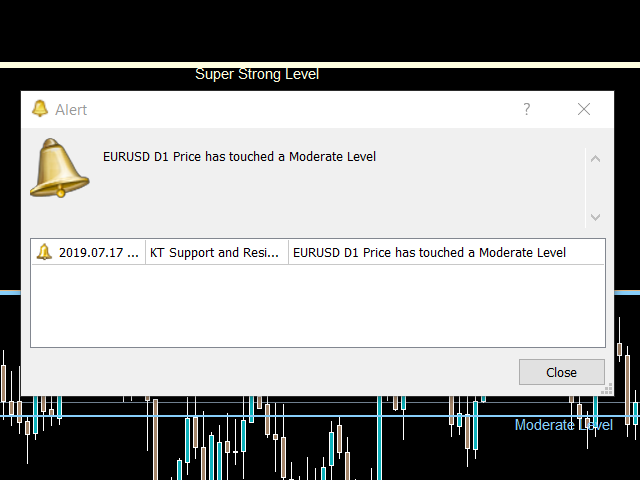
- Moderate Levels: If you are a day trader, you should keep an eye on these levels. Immediate trade entries around these
levels should be avoided to prevent unnecessary losses.
- Short-Term Levels: These are comparatively weaker levels plotted using a singular time frame analysis. If you are a day trader or scalper, you may use these levels to decide a stop loss and profit target.
Applications
- Filter out bad trades by avoiding trade entries around a significant support/resistance level.
- Automatically draw significant support and resistance levels using an advanced methodology and saves a ton of time every day.
- Prevent stop hunting by institutional traders by placing the stop loss before or after a support/resistance level.
- Include a multi-timeframe approach in your technical analysis without ever switching to a different time frame.
EA Developers
// This code will help you to import the support/resistance levels in your expert advisor. string super_strong_levels_name ="KT_SUP_RES_Super_Strong_Levels"; string strong_levels_name = "KT_SUP_RES_Strong_Levels"; string moderate_levels_name = "KT_SUP_RES_Moderate_Levels"; string shortterm_levels_name = "KT_SUP_RES_Short-Term_Levels" for(int i=ObjectsTotal(); i>=0; i--) { string object_name = ObjectName(0,i); if(ObjectType(object_name)!=OBJ_TREND)continue; if(StringFind(object_name,super_strong_levels_name)>=0) // fill super strong level array with ObjectGetDouble(0,object_name,OBJPROP_PRICE) if(StringFind(object_name,strong_levels_name)>=0) // fill strong level array with ObjectGetDouble(0,object_name,OBJPROP_PRICE) if(StringFind(object_name,moderate_levels_name)>=0) // fill moderate level array with ObjectGetDouble(0,object_name,OBJPROP_PRICE) if(StringFind(object_name,shortterm_levels_name)>=0) // fill shorterm level array with ObjectGetDouble(0,object_name,OBJPROP_PRICE) } // The above code is almost similar for both MQL4 and MQL5 with some minor adjustments.
Produtos recomendados
KT Renko Patterns scans the Renko chart brick by brick to find some famous chart patterns that are frequently used by traders across the various financial markets. Compared to the time-based charts, patterns based trading is easier and more evident on Renko charts due to their uncluttered appearance.
KT Renko Patterns features multiple Renko patterns, and many of these patterns are extensively explained in the book titled Profitable Trading with Renko Charts by Prashant Shah. A 100% automate
180 USD
We have made the New Pin Bar Pointer faster, slimmer, and even more accurate. This is the brand new Pin Bar Pointer. A new indicator designed to work together with our other indicators to create an innovative and extremely accurate tool for investors. At heart, The Pin Bar Pointer 2, like its predecessor, is an indicator designed to find and show the most profitable pin bars, but that is not all...
Pin Bar Pointer 2 Settings Proportion - equivalent of the tail as compared to the overall size.
59 USD
This indicator will draw Support Resistance based on previous high/low on higher timeframe based ZigZag. You will need to have ZigZag indicator.
Parameter Explanation Resistance Name : Resistance level line name prefix, can be useful for Fxpod Smart Tools, the tools will automatically recognize the line and take action based on the analysis. Resistance Upper : Upper level above Resistance in ATR. The indicator will draw a line above calculated Resistance Level. If the value is 5, the line will
FREE
Swing Trading é o primeiro indicador projetado para detectar oscilações na direção da tendência e possíveis oscilações de reversão. Ele usa a abordagem de negociação de linha de base, amplamente descrita na literatura de negociação. O indicador estuda vários vetores de preço e tempo para rastrear a direção da tendência agregada e detecta situações nas quais o mercado está sobrevendido ou sobrecomprado em excesso e pronto para corrigir. [ Guia de instalação | Guia de atualização | Solução de prob
249 USD
Term "shark" in the business world denotes a high volume investor who just made a good investment in a highly Potential business deal.So, sharks are the ones who make the market move. In our case, if an American shark bought a Japanese company, he/she has to convert American dollars into Japanese yen to make the deal. So, the demand for the Japanese yen will increase sharply. Thus USD/JPY will go short rapidly if the deal was from the shark. Another example, In the case of forex, if fed increa
59 USD
Price Breakout pattern Scanner is the automatic scanner for traders and investors. It can detect following patterns automatically from your chart. Head and Shoulder - Common tradable pattern. Reverse Head and Shoulder - This pattern is the reverse formation of the Head and Shoulder. Double Top - When the price hits resistance level twice and decline toward the support level, the trader can anticipate sudden bearish breakout through the support level. Double Bottom - The double bottom pattern is
100 USD
This indicator draws Horizontal Support and Resistance automatically. It works with any symbol and any timeframe. Stronger Support Lines are displayed in thicker green horizontal lines. In the same way, Stronger Resistance lines are displayed with thicker red lines. Change the timeframe to display the Support and Resistance Lines of various timeframes.
50 USD
The London trading session is the biggest Forex market mover...
How it works Simply, it is working only in the London session, after the break out happened with a predefined pips distance. So, if the Asian session candles higher high or lower low has breaked out then an entry should be placed. Then, before the New York opens all the opened trades by this EA will be closed if it is not touched the SL/TP. If you are searching for a London Break Out trading robot then it is your best choice. No n
FREE
This is a all-in-one indicator with great proprietary forecast feature. Indicator calculates trading direction and forecast levels for the current chart and for the higher and lower charts. Best opportunity for trading is when all trade signals are in line in the direction of the forecast based on the lower chart (see screenshot). The indicator also includes all traditional stuff: Trend indicator (current chart and higher & lower charts) Reversal signal (based on Williams Percent Range - WPR) Di
150 USD
The indicator plots 5 Fibonacci retracements according to recommendations about trend lifetime given by V.V. Pershikov. All lifetime parameters can be customized. Retracements are plotted at the moment of attaching the indicator to the chart and at the moment of scaling. It is made for increase in productivity. If the indicator re-plots on every tick, its operation will be slowed down due to abundance of calculations which come from check of 61.8 level breakthrough. Plotting can be changed manua
29.99 USD
Free automatic fibonacci is an indicator that automatically plots a fibonacci retracement based on the number of bars you select on the BarsToScan setting in the indicator. The fibonacci is automatically updated in real time as new highest and lowest values appears amongst the selected bars. You can select which level values to be displayed in the indicator settings. You can also select the color of the levels thus enabling the trader to be able to attach the indicator several times with differe
FREE
Non-repainting Forecast Indicator is a great tool for trading, which accurately produces great signals and helps traders to predict the direction of trend. This indicator is made from its own mathematical algorithm and some common technical indicators. Forecast Indicator does not repaint. It produces signals at the beginning of the candle. Signals never disappear at the current candle after it comes out.
Inputs and Settings X = 2; Y = 2; Z = 2; X, Y and Z are optional settings to create signal
136 USD
Japanese candlestick analysis is one of the most used methods for determining a reversal or continuation of a trend. The Colored candles and patterns indicator can display the names of many famous candlestick patterns on the chart and signal when they appear. In addition, some candles, not being a specific model, have a strong tendency to continue the movement, or its turn. Using this indicator, you can see such candles - they are displayed in different colors. This indicator calculates the par
30 USD
The indicator compares pattern found on chart history with the current price movement. Since history repeats itself, then, by comparing the two patterns, indicator can predict the further movement of the price. The indicator allows you to overlay highlighted history pattern with current movement and you will visually see this movement and will be able to compare the past and the present. To compare two patterns, you need: It is necessary to find and highlight a pattern on the history chart of a
70 USD
The Daily Fibonacci Levels is an indicator designed for displaying the Fibonacci levels by days using horizontal lines. Displayed levels: +100% (high) +61,8% +38,2% +23,6% average = (high+low)/2 -23.6% -38.2% -61.8% -100% (low) The indicator provides the ability to specify the hour to consider the start of the day. This may be necessary if the dates on the server are changed during the trading session.
Parameters StartHour — the hour for this indicator to consider as the start of a new day.
FREE
This is a Harmonics Bat pattern EA. It can identify different variants of Harmonics Bat patterns (Bullish and Bearish) and accurately place trades. It has the following features: It provides the option of automatically determining the best take profit and stop loss point. Determines a good point for entering trades based on a projected D point of the Bat patterns. Trade management by using flexible stop loss, trailing stop loss and partial of full take profit. There is also a possibility to togg
FREE
Chart Patterns Detect 15 patterns (Ascending Triangle, Descending Triangle, Rising Wedge, Falling Wedge, Bullish Flag, Bearish Flag, Bullish Rectangle, Bearish Rectangle Symmetrical triangle, Head and Shoulders, Inverted Head and Shoulders, Triple top, Triple Bottom, Double Top, Double Bottom) Use historical data to calculate the probability of each pattern to succeed (possibility to filter notification according to the chance of success) gives graphic indication about the invalidation level and
69 USD
The indicator automatically builds Support/Resistance levels (Zones) from different timeframes on one chart.
Support-resistance levels are horizontal lines. As a rule, the market does not respond to a specific price level, but to a price range around the level, because demand and supply of market participants are not formed clearly on the line, but are “spread out” at a certain distance from the level.
This indicator determines and draws precisely such a price range within which strong pos
40 USD
This indicator displays support and resistance at fixed levels. The level won't change regardless how many days or minutes has gone by. There are 7 levels start from green ends at gray color. Imagine it like do (green),re,mi,fa,sol,la,si,DO (green)
Market often goes one octave from do to DO or fa to FA. You will see this occurring at all markets This indicator can be used to spot your take profit or stop loss target. It can be also used to find support and resistance or supply and demand.
50 USD
Multicolor Trend is a trend Forex indicator painting bars in certain colors. The indicator settings have one non-customizable parameter - period. Six user-defined colors for better visualization show a trend, its weakening, points of consolidation and possible trend formation. The indicator works on all timeframes. The product is best suited for working with highly volatile pairs.
200 USD
Este indicador detecta Gartley padrão harmônico e Pattern Anti Gartley que traçada no gráfico Ele pode prever a área de zona de inversão de potencial e o elogio de ab = área de padrão cd como retângulos que esperam o contrário. Quando a AB = Zona de CD está contratada com a prz é uma boa área para comprar ou vender Este indicador vai esperar os pontos alvos que esperar e esperar que o ponto de Stop Loss é o ponto de qual padrão falhar se o preço chegou a ele. Nota : Ponto D irá redesenhar até re
50 USD
The Beast Super Signal is a simple, and easy to use trend based indicator. It will continuously monitor current price action looking for new trends developing or strong reversals building at extreme price levels, and trends that have reached strong exhaustion level The Beast Super Signal indicator will monitor the current price, and only when all of the internal strategies align, and are in 100% agreement with each other, the indicator will paint a new buy or sell signal arrow on the chart. All
149 USD
Cansado de traçar linhas de suporte e resistência? A Resistência de suporte é um indicador de período múltiplo que detecta e plota automaticamente linhas de suporte e resistência no gráfico com um toque muito interessante: conforme os níveis de preços são testados ao longo do tempo e sua importância aumenta, as linhas se tornam mais espessas e mais escuras. [ Guia de instalação | Guia de atualização | Solução de problemas | FAQ | Todos os produtos ] Melhore sua análise técnica da noite para o d
99 USD
Indicator for binary options arrow is easy to use and does not require configuration works on all currency pairs, cryptocurrencies buy signal blue up arrow sell signal red down arrow tips do not trade during news and 15-30 minutes before their release, as the market is too volatile and there is a lot of noise it is worth entering trades one or two candles from the current period (recommended for 1 candle) timeframe up to m 15 recommended money management fixed lot or fixed percentage of the depo
100 USD
Introduction Advanced Price Pattern Scanner is the pattern scanner built upon our accumulative knowledge and insight from our financial market research many years. Advanced Price Pattern Scanner uses highly sophisticated pattern detection algorithm. However, we have designed it in the easy to use and intuitive manner. Advanced Price Pattern Scanner will show all the patterns in your chart in the most efficient format for your trading.
Detectable Patterns Following pattern can be detected. Tri
180 USD
Pin Bar Trader This is a simple and free version of Pin Bar Trader. This version is limited. You can set the pin bar pips from high to low, so the EA only trades this pin bar and greater. Example: You set the pin bar pips to 30 pips. Less than 30 pips pin bars will be ignored. 30 pips and greater pin bars will be traded. Trade Settings Lot Size Stop Loss Take Profit All listed settings are customizable.
If a bullish pin bar has formed, the EA opens a long order and vice versa. Full Pin Bar Trad
FREE
This colorful trend indicator has been developed with the new generation of computer screens in mind.
CandyEnveloped Merge GreenYellow acts as SUPPORT or RESISTANCE, if the price is up it will turn GREEN and if it's descending it will turn YELLOW.
This indicator works in any time frame and with any pair of currencies, indices or stocks. However, the higher the time frame, the better results will be obtained.
To BUY verify that the indicator is GREEN, wait for the price to enter the green
50 USD
Trend PRO Expert Advisor is developed base on the PipFinite Trend PRO Indicator, the best indicators on the market so far. PipFinite Trend Pro's smart algorithm detects the trend, filters out market noise and gives entry signals with exit levels. This EA open order when the indicator has buy/sell signals and set SL/TP follow the indicator rules. You can read more information about PipFinite Trend PRO indicator here .
Important Information
This EA will only work if you purchased PipFin
39 USD
This indicator scans for you up to 30 trading instruments and up to 8 timeframes for occurrences of the high probability reversal patterns: Double Tops/Bottoms with fake breakouts . Please read also the blog post " Professional Trading With Double Tops/Bottoms And Divergences! " which explains the concepts behind the ULTIMATE Double Top/Bottom indicator and how you can use a professional top-down approach. This FREE Version of the Scanner scans only EURUSD and GBPUSD. The full version of the sca
FREE
Hidden Divergence
Hidden_Divergence
Métodos divergência https://www.mql5.com/ru/market/product/4579 , a quem , sem dúvida, verdadeiro divergência escondido vez não é novo no mundo do comércio profissional. Usá-los em combinação permitirá que você chegar tão perto a realidade do mercado, para não seguir as indicações indicadores estúpidas e analisar o preço no complexo. Naturalmente, a compreensão de ambas as técnicas e a profundidade do seu uso no comércio vai fazer você muito mais rentável comerciante , você
99 USD Os compradores deste produto também adquirem
This is an indicator for MT4 providing accurate signals to enter a trade without repainting.
It can be applied to any financial assets: forex, cryptocurrencies, metals, stocks, indices . It will provide pretty accurate estimations and tell you when it's best to open a deal and close it. Watch the video (6:22) with an example of processing only one signal that paid off the indicator! Most traders improve their trading results during the first trading week with the help of the Entry Points Pr
131 USD
CURRENTLY 33% OFF !! ⭐⭐⭐⭐⭐ Best Solution for any Newbie or Expert Trader! This indicator is a unique, high quality and affordable trading tool because we have incorporated a number of proprietary features and a new formula. With this update, you will be able to show double timeframe zones . You will not only be able to show a higher TF but to show both, the chart TF, PLUS the higher TF: SHOWING NESTED ZONES . All Supply Demand traders will love it. :) Important Information Revealed
Maximize th
148 USD
CURRENTLY 26% OFF !! Best Solution for any Newbie or Expert Trader! This Indicator is a unique, high quality and affordable trading tool because we have incorporated a number of proprietary features and a new formula. With only ONE chart you can read Currency Strength for 28 Forex pairs! Imagine how your trading will improve because you are able to pinpoint the exact trigger point of a new trend or scalping opportunity? User manual: click here That's the first one, the original! Don't buy a wort
148 USD
CURRENTLY 20% OFF !! ⭐⭐⭐⭐⭐ This DASHBOARD is a very powerful piece of software working on multiple symbols and up to 9 timeframes.
It is based on our main indicator (Best reviews: Advanced Supply Demand ). The new DASHBOARD gives a great overview. It shows: filtered Supply and Demand values including zone strength rating, pips distances to/and within zones, it highlights nested zones, it gives 4 kind of alerts for the chosen symbols in all (9) time-frames. It is highly configurable for your p
199 USD
FULL FOREX MARKET VIEW Dashboard Indicator This is a custom indicator created to give Traders a full view of what is going on in the market. It uses a real time data to access the market and display every bit of information needed to make successful trading. INSTALLATION : Before attaching this Indicator to your window chart, go to your MT4's Market Watch panel and HIDE all the Currency pairs you don't need or trade and leave the rest there. The reason is that FFMV Dashboard will DISPLAY ALL the
135 USD
You’ll love how you can receive alerts to your email and SMS when the candles turn green or red signifying the best buy and sell times in correlation to confirmed uptrends and downtrends. TO USE 1. Buy when green candles appear - this represents an uptrend. 2. Sell when red candles appear - this represents a downtrend. EXTRA FEATURE This indicator NEVER repaints so when a candle closes, that color is final. Also, the blue trend lines in the photos are not included, this is to demonstrate the pri
197 USD
For those who studies Bill Williams' books "New Trading Dimensions" and "Trading Chaos (Second Edition)" and tries trading using these methods, it becomes evident that the standard set of indicators is not sufficient for full-fledged work. The Trading Chaos Map indicator draws the "market map", thus allowing you to the charts the same way as the author of the trilogy. Parameters provide options for enabling and disabling each signal. You can use any of the methods, or use them in conjunction. Yo
125 USD
Advanced Currency Strength Indicator
The Advanced Divergence Currency Strength Indicator. Not only it breaks down all 28 forex currency pairs and calculates the strength of individual currencies across all timeframes , but, You'll be analyzing the WHOLE forex market in 1 window (In just 1 minute) . This indicator is very powerful because it reveals the true movements of the market. It is highly recommended to analyze charts knowing the performance of individual currencies or the countries ec
149 USD
Special offer! Buy and get 100% cashback! Limited by the date of purchase - valid now from 01/28/2021. The trend detection indicator will compliment any strategy and can also be used as an independent tool. Recomedation for work with indicator #8 Benefits Easy to use; does not overload the graphic wih unnecessary information. The ability to use as filter for any strategy. Contains bult -in dynamic levels of cupport and resistange, which can be used both, for profit taking, and for settings up
150 USD
CURRENTLY 20% OFF !! ⭐⭐⭐⭐⭐ Best Solution for any Newbie or Expert Trader! This dashboard software is working on 28 currency pairs. It is based on 2 of our main indicators (Advanced Currency Strength 28 and Advanced Currency Impulse). It gives a great overview of the entire Forex market. It shows Advanced Currency Strength values, currency speed of movement and signals for 28 Forex pairs in all (9) timeframes. Imagine how your trading will improve when you can watch the entire market using a sin
199 USD
Kangaroo Tail Indicator is a pattern recognition indicator for Forex, Stocks, Indices, Commodities, Metals, Cryptos. The Kangaroo Tail is a simple and very effective pattern to trade. The strategy that comes with the Kangaroo Tail is purely based on price action. Inputs of the indicator are : Distance: distance in pixel relative to top or bottom of candle to display the arrow symbol MaxBars: number of bars back used to calculate the indicator TradeDirection (Long/Short/LongAndShort): filter sign
147 USD
Examples right away
https://gyazo.com/fc130266994402bcd43d3a6b08ac2210
https://gyazo.com/8179542d3b82430be4e1c715652c0b3c
Hedge Pair This indicator allows to observe a synthetically calculated spread between two pairs. The main idea is to pick two pairs which have a strong and positive correlation, like EURUSD and GBPUSD, EURJPY and GBPJPY, AUDUSD and NZDUSD etc. Once the spread line (lightgray colored line by default) goes way up high or down low, you can obtain a margin from the market b
200 USD
CURRENTLY 20% OFF !! ⭐⭐⭐⭐⭐ Best Solution for any Newbie or Expert Trader! This Indicator is specialized to show currency strength for any symbols like Exotic Pairs Commodities, Indexes or Futures . Is first of its kind, any symbol can be added to the 9th line to show TRUE CURRENCY STRENGTH of Gold, Silver, Oil, DAX, US30, MXN, TRY, CNH etc. This is a unique, high quality and affordable trading tool because we have incorporated a number of proprietary features and a new formula. Imagine how your
128 USD
TPA True Price Action indicator reveals the true price action of the market makers through 100% non-repainting signals (except early signals mode) strictly at the close of a candle!
TPA shows entries and re-entries, every time the bulls are definitely stronger than the bears and vice versa. Not to confuse with red/green candles. The shift of power gets confirmed at the earliest stage and is ONE exit strategy of several.
TPA has been developed by traders for traders and is not another combin
168 USD
Currency Strength Meters are a great way to identify strong and weak currencies. With this CSM indicator attached to your chart, you will get a clear overlook over the 8 major currencies: USD, EUR, JPY, CAD, CHF, GBP, AUD, and NZD.
Suggested timeframes to scan is: M15 - H1 - H4 - Daily You can however just change timeframe to check in the settings. Bear in mind that scanning very low timeframes such as M1 will require a lot of resources and might make your mt4 terminal slow.
The strength s
129 USD
⭐⭐⭐ ------ GOOD LUCK ----- ⭐⭐⭐
(Telegram: @MagicBinary) The indicator allows you to trade binary options. T his indicator give high winning ratio with over 20 years of backtesting The recommended time frame is М1 and the expiration time is 3, 5 minutes. The indicator suitable for Auto and Manual trading. A possible signal is specified as a arrows above/under a candle. You can entry current candle /intrabar or can wait until candle close Arrows are not re-painted Trade sessions: Any/ Re
180 USD
The Ribonucleic indicator is a versatile indicator that combines the advantages of three categories of indicators. You get 3 indicators in 1 product: multi-step trend detection (trend indicators), determination of resistance and support levels (level indicators), determination of overbought and oversold zones (oscillator indicators).
The indicator appeared in the process of many years of work with financial assets. The Ribonucleic indicator has become a consequence of those desires and requir
133 USD
⭐⭐⭐ WARRANTY POWERFULL ⭐⭐⭐
The indicator allows you to trade binary options. The recommended time frame is М1 and the expiration time is 2,3 minutes. The indicator suitable for Auto and Manual trading. A possible signal is specified as a arrows above/under a candle. You can entry current or new candle Arrows are not re-painted Trade sessions: US section Currency pairs: Any Working time frame: M1 Expiration time: 2,3,4,5 (depend on pair) With auto trading with Bot, buffer 1: call, buffer 0 :
180 USD
VWAP Session is an indicator usually used by big institutions to spot entries in the market to buy low and sell high. VWAP means Volume Weighted Average Price, thus the indicator's purpose is to give a fair price for a given asset.
Trading rules You can buy below VWAP level and sell above VWAP level. The VWAP Session indicator also displays bands with deviations to identify price in overbought and oversold situations. Usually, you can buy an asset when the price is out of the third or fourth d
137 USD
CURRENTLY 26% OFF !! ⭐⭐⭐⭐⭐ This indicator is a super combination of both our main indicators ( Advanced Currency Strength 28 and Advanced Currency IMPULSE with ALERT ). It shows Currency Strength values for TICK-UNITS and alert signals for 28 Forex pairs. 11 different Tick-Units can be used. Those are 1, 2, 3, 4, 5, 6, 10, 12, 15, 20, and 30 Seconds. The Tick-Unit bar in the sub-window will be shown and shifted to the left when there is at least 1 tick within the second’s timer. With only ONE
148 USD
Tweezer Pro Indicator is a pattern recognition indicator for Forex, Stocks, Indices, Futures, Commodities and Cryptos.
The standard Tweezer is a two bar pattern. Our enhanced version is a multi-bar pattern. We filter the patterns for you so that you only get the best and most effective patterns and ignore the noise.
The Tweezer pattern is a simple and effective pattern to trade.
The strategy that comes with the Tweezer is based on price action.
The Tweezer Pro version let user
177 USD
⭐⭐⭐ WARRANTY POWERFULL ⭐⭐⭐
The indicator allows you to trade binary options. The recommended time frame is М1 and the expiration time is 1,2 minutes. The indicator suitable for Auto and Manual trading. A possible signal is specified as a arrows above/under a candle. You should wait until the candle closes! Arrows are not re-painted Trade sessions: US section Currency pairs: Any Working time frame: M1 Expiration time: 1,2,3,4,5 (depend on pair-contact for get detail advise) With auto trading
180 USD
Indicator captures the trend reversals with no-repaint Buy and Sell Arrow signals. Good at catching Swing Highs and Swing Lows . SCROLL DOWN TO VIEW SCREENSHOTS AND WATCH VIDEO ________________________________________________________________ Trading using CyberZingFx Trend Reversal is Simple
You Buy when a Buy Arrow Appear and Sell when there is Sell Arrow. Put Stop Loss above Higher High for SELL Order and below Lower Low for BUY. Close order partially when an exit signal (dot) appear. The
149 USD
⭐⭐⭐⭐⭐ V O L A T I L I T Y W A T C H E R ⭐⭐⭐⭐⭐ A highly powerful Market Volatility Detector. It gives current situation of market technical sentiment.
⚡ ⚡ V E R Y I M P O R T A N T ⚡ ⚡ Once the tool detects and alerts you, you have to act on it right away for more precision of entries. Once the recommended pair to trade is gone, wait for the next recommendation. If your MT4 is newly installed, there's no sufficient data yet for all 28 pairs that the tool monitors. You hav
199 USD
The Quantum VPOC indicator has been developed to expand the two dimensional study of volume and price, to a three dimensional one which embraces time. The volume/price/time relationship then provides real insight to the inner workings of the market and the heartbeat of sentiment and risk which drives the price action accordingly. The Quantum VPOC indicator displays several key pieces of information on the chart as follows: Volume Profile - this appears as a histogram of volume on the vertical pr
197 USD
INTRODUCING WORLD'S FIRST MT4 & MT5 Gann Dynamic Square, Circle and Equilateral Triangle To Analyze Markets Geometric Relationship.
Gann Dynamic Square has some of the most impressive features you will ever find in Gann & Geometric Analysis world.
The Gann Dynamic Square is a tool to draw offset Square,Equilateral Triangle & Circle. Most charting software or MT4/MT5 market indicators don't have these features.
You will be able draw your Geometric shapes like a professional geometric an
150 USD
FX Levels indicator is a very useful and powerful indicator to trade Forex and Binary Options. The purpose of the indicator is to draw levels that are turning points in the market. These lines show support and resistance levels and should be used as guideline to figure out possible turning points and targets. The indicator draws these levels analyzing the H1, H4, D1 and W1 timeframes. Levels can be customized (color, style, line width).
Inputs Prefix - prefix used by broker (for instance if sy
190 USD
MonsterDash Harmonic Indicator is a harmonic pattern dashboard. It recognizes all major patterns. MonsterDash is a dashboard that displays all detected patterns for all symbols and (almost) all timeframes in sortable and scrollable format. Users can add their own user defined patterns . MonsterDash can open and update charts with the pattern found.
Settings MonsterDash's default settings are good enough most of the time. Feel free to fine tune them to your needs. The color settings are for tho
139 USD
Description
ABC Trend Detector Pro is an indicator that identifies impulses and trends in the market and displays their presence on the price chart. Found patterns are drawn as colored connecting lines between their highs and lows. Above / below each extreme, the value of the range (the number of pips) of the trend is displayed.
Recommendations
You can use this indicator to determine the trend and, accordingly, to determine the direction of opening a position or closing an opposite posit
200 USD
Mostra inversões de mercado (reversals) com uma alta taxa de sucesso. Os reversals são apresentados no gráfico como setas, e nunca fazem repaint ou back-paint. Baseado nos nossos algoritmos proprietários de preço e volumes, é uma poderosa ferramenta para ter, e que pode ser incorporado em qualquer sistema de trading. Com parâmetros facilmente ajustáveis e um score de rating para cada setting escolhida, é um indicador bastante versátil que se ajusta ao mercado em que for usado. O indicador mostra
129 USD Mais do autor
ACB Trade Filter indicator provides a way to filtering out the low probability trading entries in a trading strategy. The indicator uses a sophisticated filtration algorithm based on the market sentiment and trend. The MT4 version of the same indicator is available here ACB Trade Filter MT4
Applications Works great with our indicator ACB Breakout Arrows MT5 Filter out low probability signals from any indicator. Avoid over-trading and minimize the losses. Trade in the direction of market sentim
60 USD
KT Renko Patterns scans the Renko chart brick by brick to find some famous chart patterns that are frequently used by traders across the various financial markets. Compared to the time-based charts, patterns based trading is easier and more evident on Renko charts due to their uncluttered appearance.
KT Renko Patterns features multiple Renko patterns, and many of these patterns are extensively explained in the book titled Profitable Trading with Renko Charts by Prashant Shah. A 100% automate
180 USD
The ACB Breakout Arrows indicator provides a crucial entry signal in the market by detecting a special breakout pattern. The indicator constantly scans the chart for a settling momentum in one direction and provide the accurate entry signal right before the major move.
MT5 Version is available here https://www.mql5.com/en/market/product/23373
Key features Stoploss and Take Profit levels are provided by the indicator. Comes with a MTF Scanner dashboard which tracks the breakout signals acr
180 USD
KT Renko Live Chart utility creates the Renko charts on MT5 that can be further used for speculation or live trading. The Renko chart created by this utility supports most of the custom indicators and automated Expert Advisors. Fully compatible with our Renko Patterns indicator and Renko Patterns EA .
Features
A simple and straightforward Renko utility that provides the Renko chart on MT5 without any complicated settings. It supports most of the custom indicators and Expert Advisors for 100%
FREE
In manual trading, many of the trading setups and opportunities provided by the KT Renko Patterns indicator are missed due to sudden price movements on the Renko charts.
KT Renko Patterns EA solves this problem by implementing a 100% automated trading strategy based on the "KT Renko Patterns indicator". After fetching the patterns formation and signals directly from the indicator, it performs some pre-checks and assessments to efficiently execute the trading positions.
All the dependencies
199 USD
KT Renko Live Chart utility creates the Renko charts on MT4 that can be further used for speculation or live trading. The Renko chart created by this utility supports most of the custom indicators and automated Expert Advisors. Fully compatible with our Renko Patterns indicator and Renko Patterns EA . To use an Expert Advisor on the generated Renko chart, make sure to untick the "Offline Chart" in the chart properties.
Features
A simple and straightforward Renko utility that provides the Ren
FREE
The ACB Trade Filter indicator provides a solution for filtering out the low probability trading setups in a trading strategy. The indicator uses a sophisticated filtration algorithm based on the market sentiment and trend.
Applications Works great with our indicator " ACB Breakout Arrows ". Filter out low probability signals from any indicator. Avoid overtrading and minimize the losses. Trade in the direction of market sentiment and trend. Avoid the choppiness in the market.
How to use Only
60 USD
KT Momentum Arrows Indicator is based on a momentary breakout which is calculated using the bands deviation and emerging volatility in a certain direction. A buy signal is generated when the price close above the upper band and a sell signal is generated when the price close below the lower band. A magnitude coefficient is used as the input which affects the band deviation and volatility at the same time. The coefficient value should be carefully selected and analyzed based on the instrument and
80 USD
KT COG is an advanced implementation of the center of gravity indicator presented by John F. Ehlers in the May 2002 edition of Technical Analysis of Stocks & Commodities magazine. It's a leading indicator which can be used to identify the potential reversal points with the minimum lag. The COG oscillator catches the price swings quite effectively.
MT5 version of the same indicator is available here KT COG Advanced MT5
Calculation of COG The COG indicator is consist of the two lines. The mai
60 USD
KT Ichimoku Trader is a fully automated expert advisor that offers five popular trading strategies based on the Ichimoku indicator. Each strategy has it's own entry and exit method without any interference to other strategies. The Ichimoku system can be applied to all major currency pairs and metals. However, we found that it performs reasonably well mainly on two pairs. MT5 Version is available here https://www.mql5.com/en/market/product/35043
Features
Trade up to 5 famous trading strate
80 USD
KT COG Robot is a fully automated Expert Advisor based on the KT COG Indicator . The COG indicator was originally presented by John F. Ehlers in the May 2002 edition of Technical Analysis of Stocks & Commodities magazine. The EA fires a long trade when COG line cross above the signal line and a short trade is fired when the COG line cross below the signal line.
Adaptive Filtration
Our adaptive filtration algorithm combines the original COG formula with the major trend direction and market ac
60 USD
This is a 100% automated expert advisor based on our custom indicator named "ACB Breakout Arrows" . The entries are based on a breakout pattern that constantly occurs in a bi-directional manner. The intensity of entry signals can be manipulated using the external input called "Signal Sensitivity". MT5 Version is available here https://www.mql5.com/en/market/product/35785
Trades Confirmation
ACB Breakout Arrows EA provides an ability to filter the entries using our another custom indicator n
180 USD
KT Asian Breakout carefully analyzes the range-bound market during the Asian session and then fires a long or short trade after doing some preassessment based on its inbuilt technical analysis module.
The executed orders are closed within a day before the completion of the next day session. The inbuilt technical analysis module checks for the session range and compares it with the last 20 days price movement. If it finds any erratic price movement within the session, the orders are not execute
140 USD
First thirty minutes are essential for a trading session. The early reaction of traders and market players sets a path for the rest of the day. KT London Breakout EA takes advantage of this phenomenon, and after analyzing the first thirty minutes of London session, it places two bidirectional pending orders. One of pending order is eventually canceled after realizing the market direction with certainty.
It has been strictly tested and developed for EUR/JPY using 30-Min Time Frame. You can ex
100 USD
If you trade Forex, having detailed information about the currency strength and currency pairs correlation can take your trading to new heights. The correlation will help to cut your risk in half, and strength analysis will help to maximize the profits. This indicator provides a hybrid approach for selecting the most appropriate currency pairs using the strength analysis and currency pairs correlation.
How to use the Currency Strength Analysis
Suppose your trading strategy provides a buying o
120 USD
KT MACD Divergence Seeker trades the regular and hidden divergence signals generated by our free indicator named KT MACD Divergence indicator.
Trading the standalone divergences can be a risky affair that's why the KT MACD Divergence Seeker combines the standard divergence signals with an advanced analysis module to exploit the price inefficiencies on some FX pairs.
What is the Divergence exactly?
As a general conception if the price is making higher highs, then macd should also be making
90 USD
KT Asian Breakout indicator scans and analyzes a critical part of the Asian session to generate bi-directional buy and sell signals with the direction of a price breakout. A buy signal occurs when the price breaks above the session high, and a sell signal occurs when the price breaks below the session low. MT5 Version is available here https://www.mql5.com/en/market/product/41704
Things to remember
If the session box is vertically too wide, a new trade should be avoided as most of the price
150 USD
KT Bollinger Bands Trader is a 100% automated expert advisor that's incorporated a mean reversion trading strategy using the Bollinger bands during the period of low volatility. Price often reacts at the upper or lower line of Bollinger bands, but a reversal not always occurs. However, there is more chance of price reversal during the time of low volatility.
Entries A buy trade is activated when price correctly aligns below the bottom line of Bollinger bands. A sell trade is activated when pri
140 USD
Despite the popularity of inside bar pattern among the traders, using it as a standalone signal doesn't provide any edge in the market.
KT Inside Bar Advanced indicator solves this problem by combining the classic inside bar pattern with the "ECE" cycle and Fibonacci extensions. Using this indicator in place of our classic inside bar indicator will provide a tremendous advantage and edge in the market.
What is the ECE cycle?
In financial markets, the price never moves in a straight line bu
90 USD
Despite the popularity of inside bar pattern among traders, using it as a standalone entry signal doesn't provide any evidentiary advantage. KT Inside Bar Hunter trades only selected inside bar patterns using some preassessment and ECE price action cycle.
Trading Strategy
On successful detection of the required pattern, EA places a pending order in the direction of the forecasted price expansion phase. Pending orders are canceled if they are not triggered within the next bar. Once triggered,
199 USD
KT CCI Surfer uses a mean reversion trading strategy with a combination of extreme overbought/oversold zone detection using the Commodity Channel Index (CCI). Developed by Donald Lambert in 1980, CCI is a leading indicator that helps to identify the overbought/oversold region in the market without any lag.
Obviously, not every overbought/oversold signal turns out into a price reversal. However, when combined with a well-planned mean reversion strategy, it produces excellent results.
Recomme
120 USD
KT RSI Divergence robot is a 100% automated expert advisor that trades regular and hidden divergence built between the price and Relative Strength Index (RSI) oscillator. The divergence signals are fetched from our freely available RSI divergence indicator.
Not every divergence ends up in a successful price reversal, that's why this ea combines the raw divergences signals with its inbuilt technical analysis module to exploit the price inefficiency that occurs after some selected divergence si
90 USD
KT CCI Divergence robot is a 100% automated expert advisor that trades regular and hidden divergence built between the price and Commodity Channel Index (CCI) oscillator. The divergence signals are fetched from our freely available CCI divergence indicator.
Not every divergence ends up in a successful price reversal, that is why this ea combines the raw divergences signals with its inbuilt technical analysis module to exploit the price inefficiency that occurs after some selected divergence s
90 USD
KT Stochastic Divergence robot is a 100% automated expert advisor that trades regular and hidden divergence built between the price and Stochastic oscillator. The divergence signals are fetched from our freely available Stochastic Divergence indicator.
Not every divergence ends up in a successful price reversal, that's why this ea combines the raw divergences signals with its inbuilt technical analysis module to exploit the price inefficiency that occurs after some selected divergence signals
90 USD
KT Power Pennant finds and marks the famous pennant pattern on the chart. A pennant is a trend continuation pattern with a significant price movement in one direction, followed by a period of consolidation with converging trend-lines.
Once a pennant pattern is formed, a buy/sell signal is provided using a bullish or bearish breakout after the pattern formation.
MT5 Version is available here https://www.mql5.com/en/market/product/44714
Features
Pennant patterns provide a low-risk entry af
65 USD
KT Murrey Math robot incorporates a trading strategy that explicitly trades the price bars that crossed above or below a Murrey Math level. Entries: A buy order is placed when a bar closes above a Murrey Math level. A sell order is placed when a bar closes below a Murrey math level. Exits: EA places the stop-loss and take-profit always at the subsequent Murrey Math levels.
MT5 Version is available here https://www.mql5.com/en/market/product/45406
Features
This EA combines a simple Murrey
90 USD
KT Trend Trading Suite is a multi-featured indicator that incorporates a trend following strategy combined with multiple breakout points as the entry signals.
Once a new trend is established, it provides several entry opportunities to ride the established trend successfully. A pullback threshold is used to avoid the less significant entry points.
MT5 Version is available here https://www.mql5.com/en/market/product/46270
Features
It combines several market dynamics into a single equati
180 USD
KT Candlestick Patterns finds and marks the 24 most dependable Japanese candlestick patterns in real-time. Japanese traders have been using the candlestick patterns to predict the price direction since the 18th century.
It's true that not every candlestick pattern can be equally trusted to predict the price direction reliably. However, when combined with other technical analysis methods like Support and Resistance, they provide an exact and unfolding market situation.
This indicator includ
140 USD
KT Candlestick Patterns Robot is a 100% automated expert advisor based on the KT Candlestick Patterns indicator . After fetching the candlestick patterns and signals directly from the indicator, it performs some pre-checks and assessments to execute the trading positions efficiently. Entries: On the emergence of new candlestick patterns. Exits: The opposite pattern, Neutral pattern, Stop-loss, or Take-Profit.
All the dependencies are embedded in the expert advisor. It's not imperative to buy
140 USD
Filtro:
Sem comentários
Versão 1.6
2020.11.22
- A minor change in the alerts text.
- Performance improvements.
- Source code optimizations.
- Performance improvements.
- Source code optimizations.
Versão 1.5
2019.07.17
- improved the indicator execution speed.
- Added the alerts on a level touch.