EasyTrend 2 AM
- Indicadores
- Andriy Matviyevs'kyy
- Versão: 26.0
- Atualizado: 15 setembro 2023
EasyTrend 2 AM is an indicator that allows you to open a position at the very beginning of a significant price movement.
The second most important quality of the indicator is the ability to follow the trend as long as possible in order to obtain all potential profits while minimizing potential losses.
The indicator allows you to notify the user about your signals by sending messages to the terminal and e-mail.
This indicator does not repaint or not recalculate.
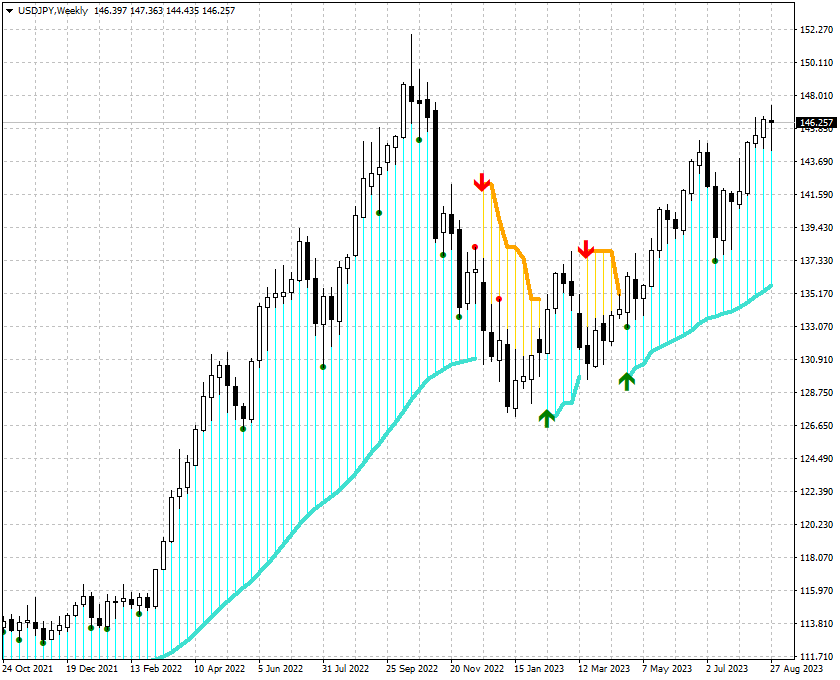
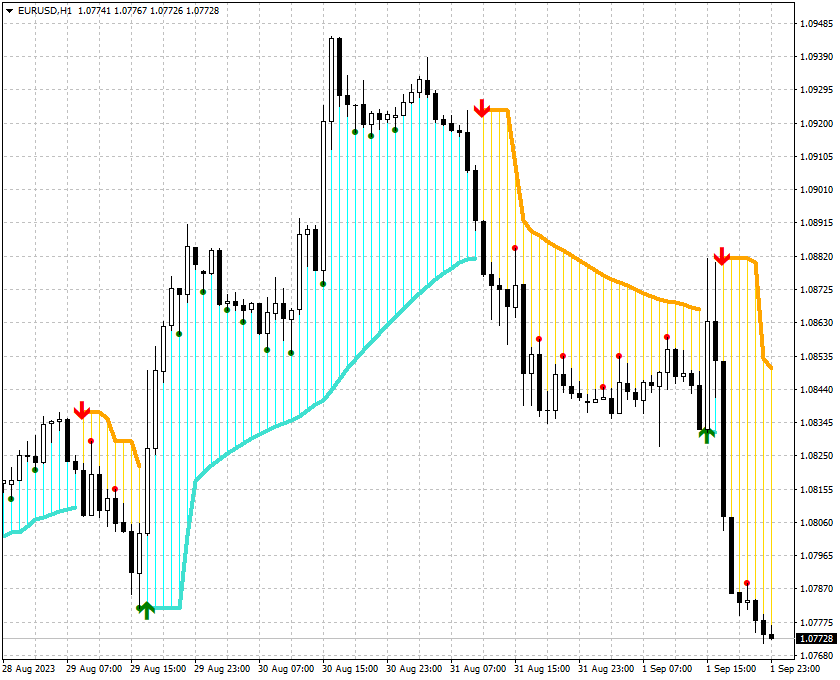
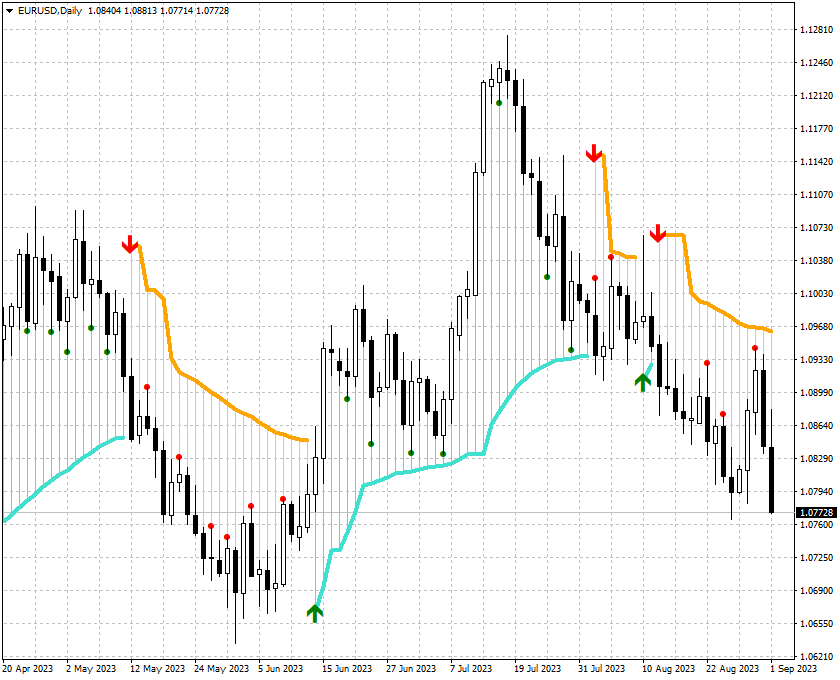
Signal of the indicator:
- red arrow appearing above the price graph - possible start of a downtrend;
- green arrow appearing below the price graph - possible start of an uptrend;
- line - S/R levels.
- Sensitivity (>0) - indicator sensitivity;
- Alerts - show a dialog box containing user data;
- Send_Notification - sends push notifications to the mobile terminals, whose MetaQuotes IDs are specified in the "Notifications" tab;
- Send_Mail - sends an email using an address specified on the Email tab of the options window.