MASi MACD Histogram
- Indicadores
- Aleksey Terentev
- Versão: 1.6
- Atualizado: 22 junho 2017
This oscillator has become one of the main tools of most professional traders.
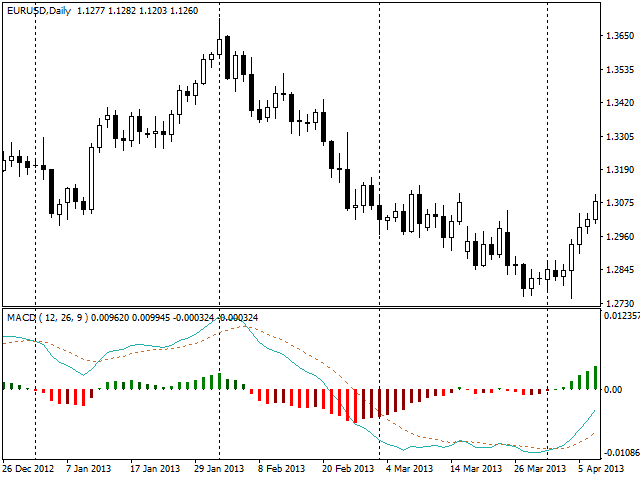
The indicator includes a classical MACD (Moving Average Convergence/Divergence) line, a signal line, as well as a MACD histogram.
Exponential moving averages are used in the calculation.
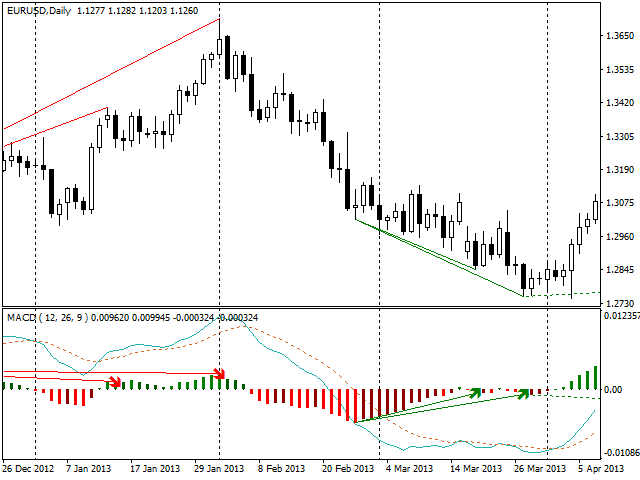
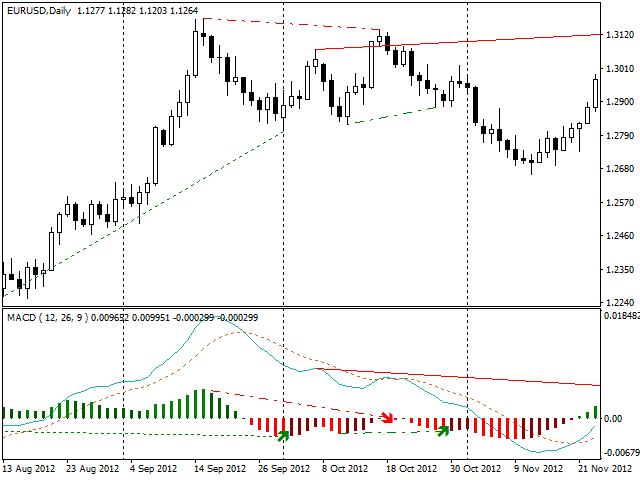
The indicator also provides the ability to enable signals on identification of divergences between the price graph and the indicator. Divergences are identified using three patterns: classic, hidden and extended divergences.
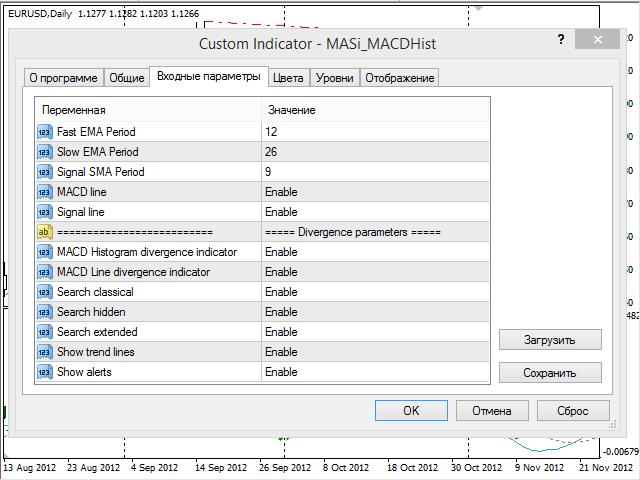
Indicator Parameters
- Fast EMA Period - period of the fast exponential moving average
- Slow EMA Period - period of the slow exponential moving average
- Signal SMA Period - period of the signal exponential moving average
- MACD line - enable the display of the MACD line
- Signal line - enable the display of the signal line
Divergence parameters
- MACD Histogram divergence indicator - enable searching for divergences using the histogram
- MACD Line divergence indicator - enable searching for divergences using the MACD line
- Search classical - enable searching for classical divergences
- Search hidden - enable searching for hidden divergences
- Search extended - enable searching for extended divergences
- Show trend lines - enable the display of the divergence trend lines
- Show alerts - enable notifications when finding a divergence on the current bars


I like it , added to my main chart as second confirmation. Thank you