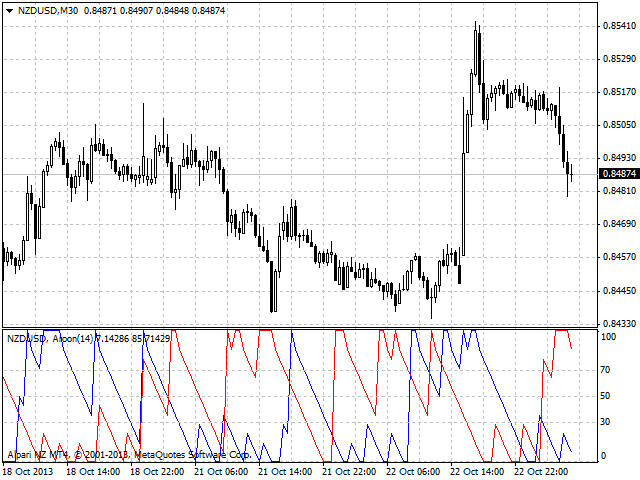
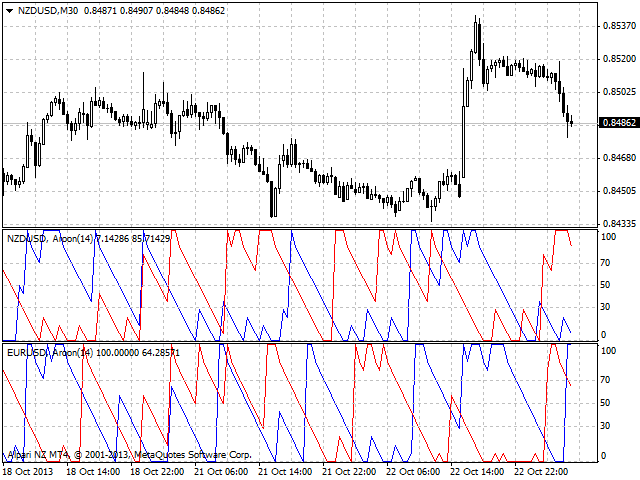
Aroon
- Indicadores
- Igor Semyonov
- Versão: 1.21
- Atualizado: 31 março 2020
- Ativações: 5
A colored multicurrency/multisymbol indicator Aroon consisting of two lines: Aroon Up and Aroon Down.
The main function of the indicator is to predict the trend change.
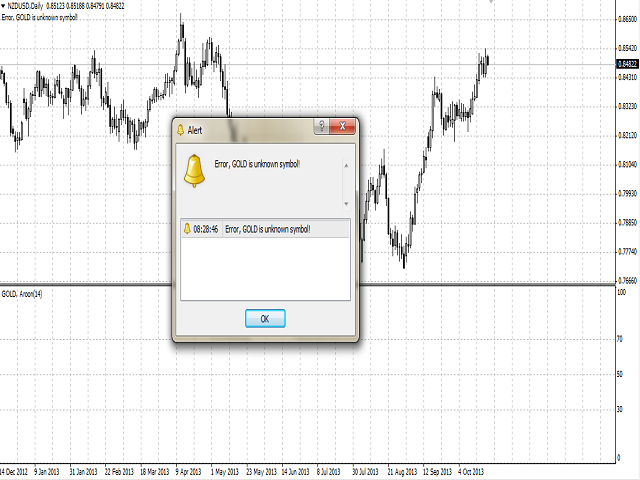
The indicator may be used with any broker, irrespective of the name of the financial instrument since it is necessary to manually enter the name as an input parameter. If you enter a non-existent or incorrect name of a financial instrument, you will receive an error message that this financial instrument is unknown (does not exist).
The indicator lines can be colored.
Purpose
The indicator can be used for manual or automated trading in an Expert Advisor. Values of indicator buffer of the double type can be used for automated trading:
- The bullish line of the indicator Aroon Up - buffer 0.
- The bearish line of the indicator Aroon Down - buffer 1.
Meaning of the Indicator Signals
The indicator may have multiple states depending on the mutual arrangement of its lines - Aroon Up and Aroon Down:
- When the lines reach extremes.
- When the lines stay in certain ranges.
- When there is a parallel movement of Aroon Up and Aroon Down.
- Crossing of Aroon Up and Aroon Down.
So
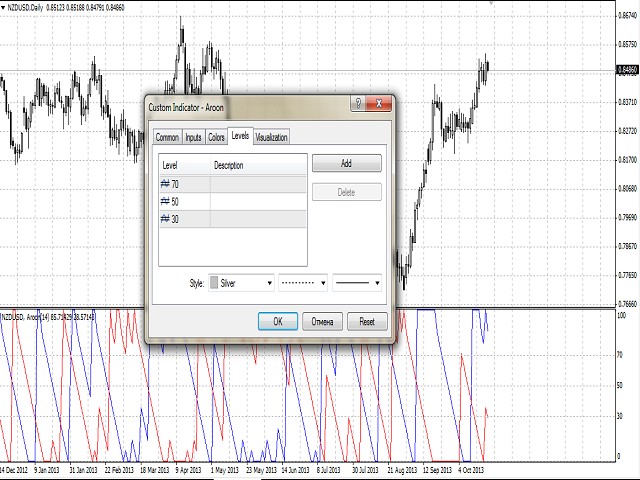
- Extremes and lines in certain ranges:
- When Aroon Up reaches 100, this may mean strengthening of the market.
- If Aroon Up persistently stays between 70 and 100, a new uptrend is expected.
- Similarly, if Aroon Up reaches zero, weakening of the market is expected.
- If Aroon Up is between 0 and 30, a new downtrend is expected.
- A strong downtrend is observed when Aroon Up persistently stays between 0 and 30, while Aroon Down persistently stays between 70 and 100.
- Parallel movement of Aroon Up and Aroon Down:
- If the lines are parallel and close to each other, further strengthening of the trend can be expected.
- Intersection of the Lines:
- When Aroon Down crosses Aroon Up from bottom upwards, market weakening is detected and price decrease should be expected.
- When Aroon Up crosses Aroon Down from bottom upwards, potential market strengthening and price growth is expected.
The most reliable is the signal received on D1 interval compared to, for example H1 interval.
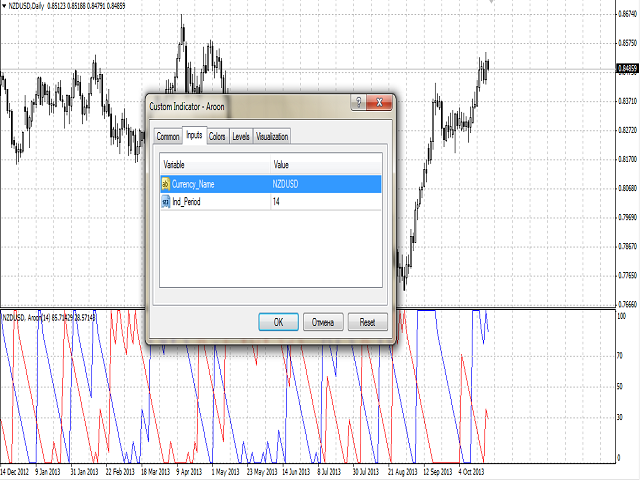
Inputs
- Currency_Name - the name of the financial instrument.
- Ind_period - indicator calculation period.