RSI Mirrors and Reflections
- Indicadores
- Libertas LLC
- Versão: 1.3
- Atualizado: 1 dezembro 2021
- Ativações: 20
"Battles between bulls and bears continue to influence price development long after the combat has ended, leaving behind a messy field that observant technicians can use to manage risk and find opportunities. Apply "trend mirror" analysis to examine these volatile areas, looking for past action to impact the current trend when price turns and crosses those boundaries." - Investopedia.com
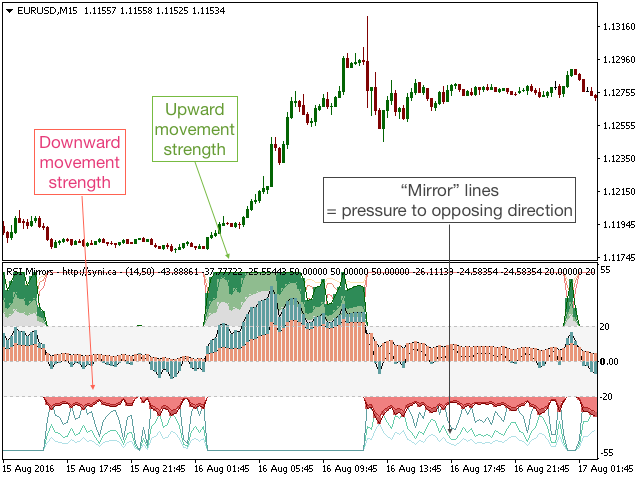
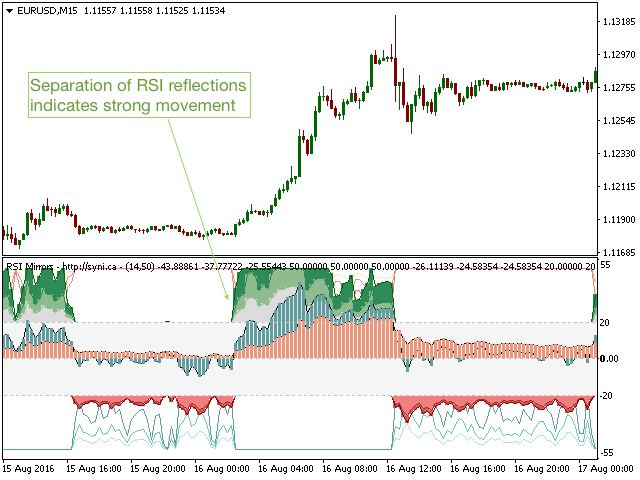
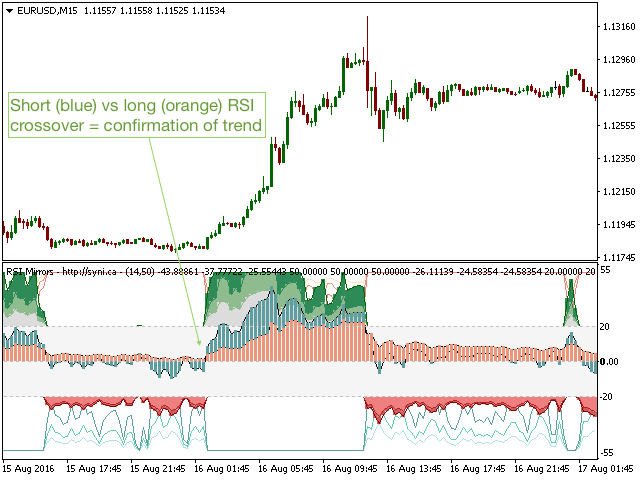
RSI Mirrors and Reflections is a robust technique using multiple RSI periods, mirrors and reflections based on RSI values to indicate the strength of price movements and reversals. Three upward and three downward RSI reflections are calculated: separation and divergence of the RSI reflections indicates a strong vs weak upcoming price movement (please see screenshots) and crossover of long-term vs short-term RSI lines is a confirmation of trend. Mirrors (lines) above and below the plot can be used in conjunction with reflections (filled bars) to track the strength of a price movement and when they are fading.
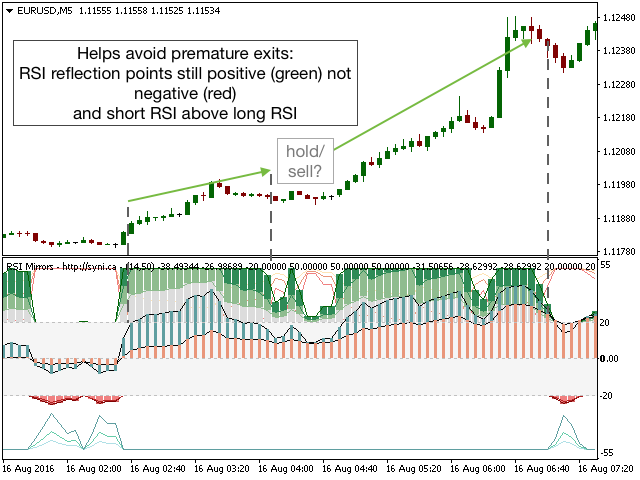
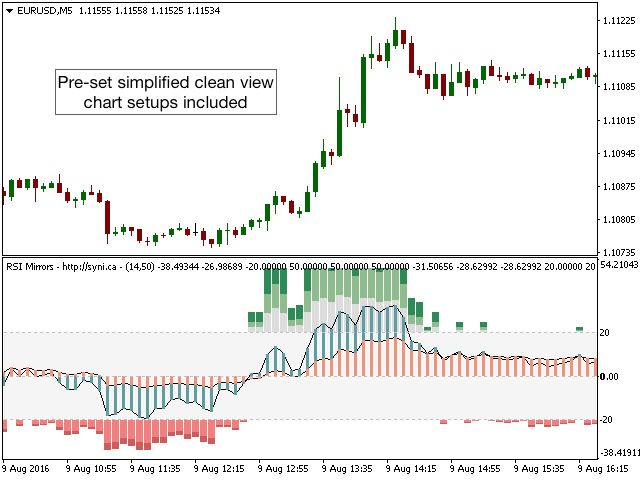
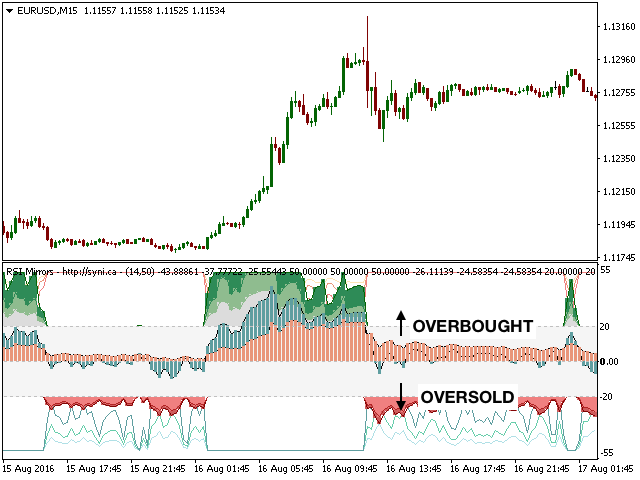
As shown in the screenshots below, RSI Mirrors and Reflections can be used to identify strong price movements, track the trend and avoid premature exit which would be tempting if only using candlesticks or more limited indicators. In addition to its stand-alone use, this extremely flexible indicator can be used to supplement trading strategies in any timeframes and assets. This pairs well with MACD and moving averages.
Parameters
- RSI Period 1 (Default=14): Calculation period for short-term RSI
- RSI Period 2 (Default=50): Calculation period for long-term RSI
- Plot RSI Reflection Lines (Default=true): Plot trend lines through the filled reflection bars to help visualization
- Plot RSI Mirror Lines (Default=true): Plot RSI mirror values
- Reflection bar width (Default=4): Adjust the width of all reflection bars at once
To facilitate plotting, RSI values are set to oscillate between -50 and 50, not 0 and 100.


nice work