• Visão global
  • Comentários
  • Discussão

PTS Divergence Sell Finder V2

O Indicador de Venda PTS Divergence Finder por Roger Medcalf - Precision Trading Systems.

Este indicador fornece apenas Indicações de Venda - Baixa.

Em primeiro lugar, muitas vezes me perguntaram por que não forneci um indicador de divergência de venda enquanto felizmente fornecia um localizador de divergência de sinal de compra por muitos anos.

Eu dei a resposta de que as divergências de venda são menos confiáveis do que as divergências de compra, o que ainda é verdade.

Algumas soluções foram encontradas para mudar isso, não cedendo à pressão dos pares ou modificando este indicador que fiz há mais de quinze anos, mas alterando as configurações padrão para torná-lo mais rigoroso.

Como funciona o Indicador de Venda PTS Divergence Finder?

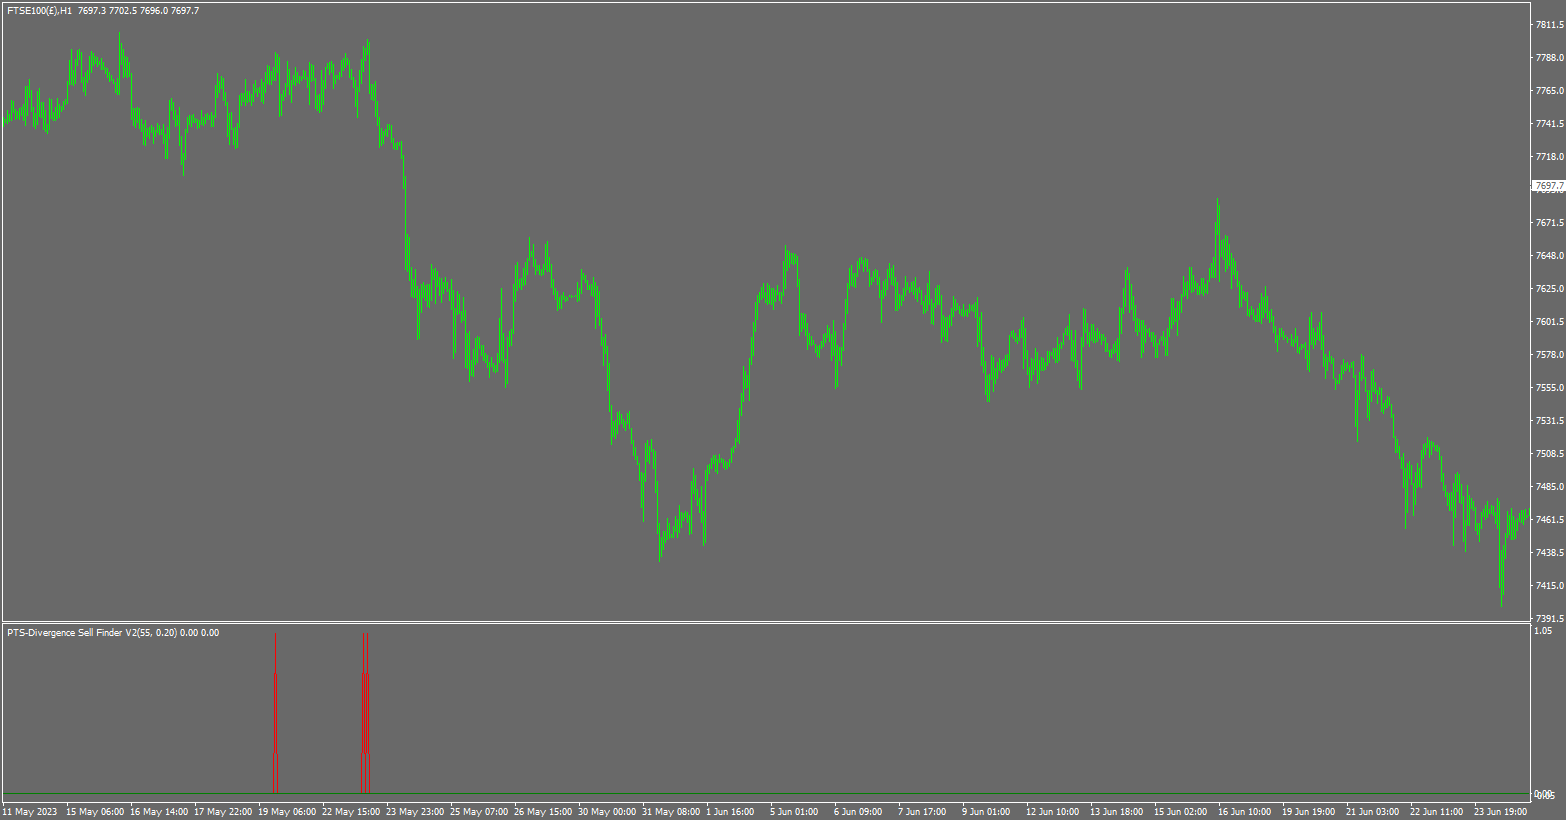
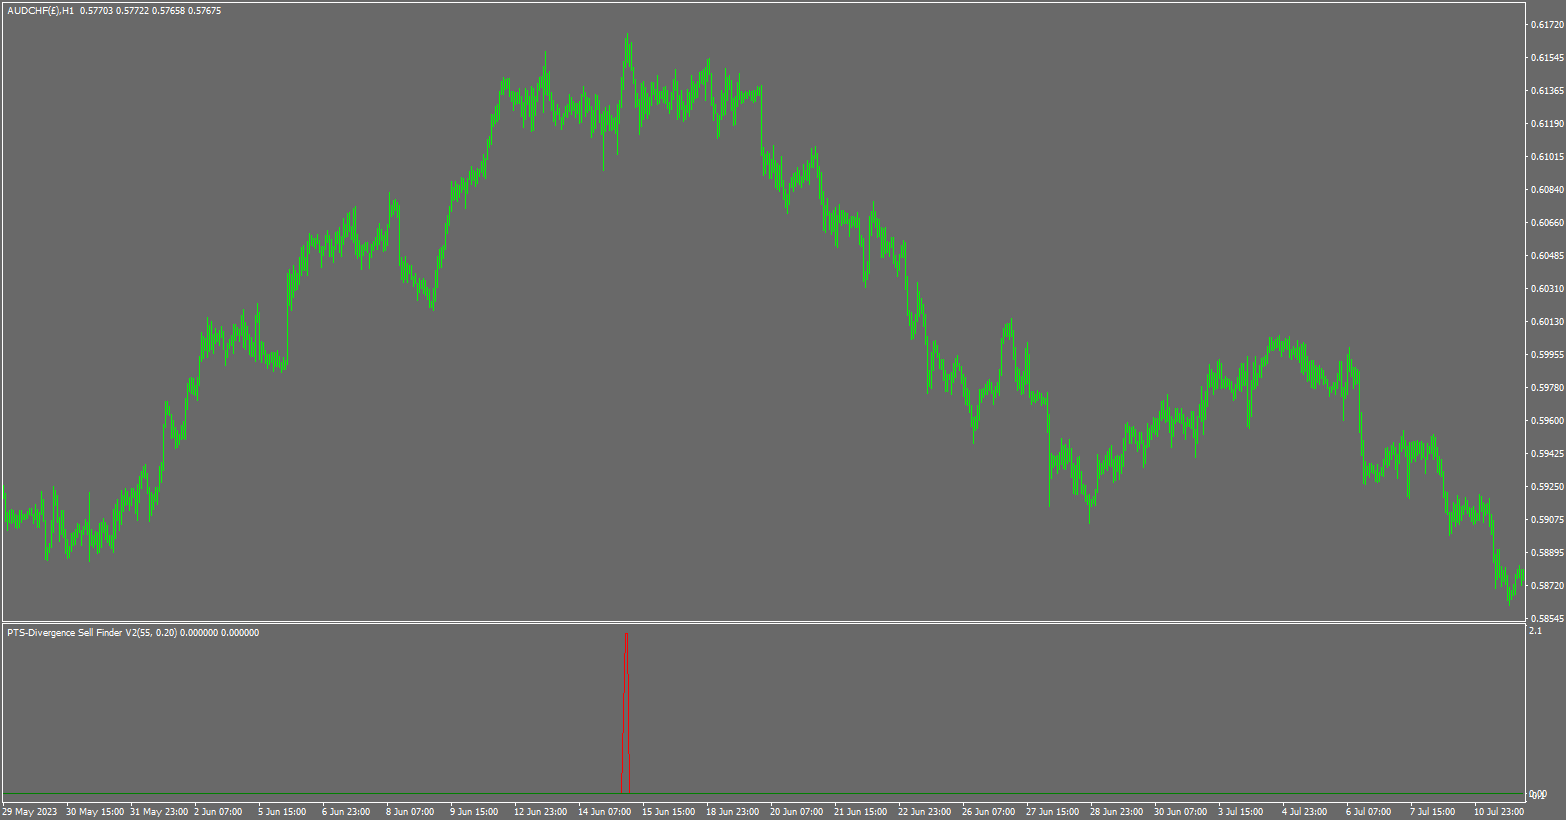
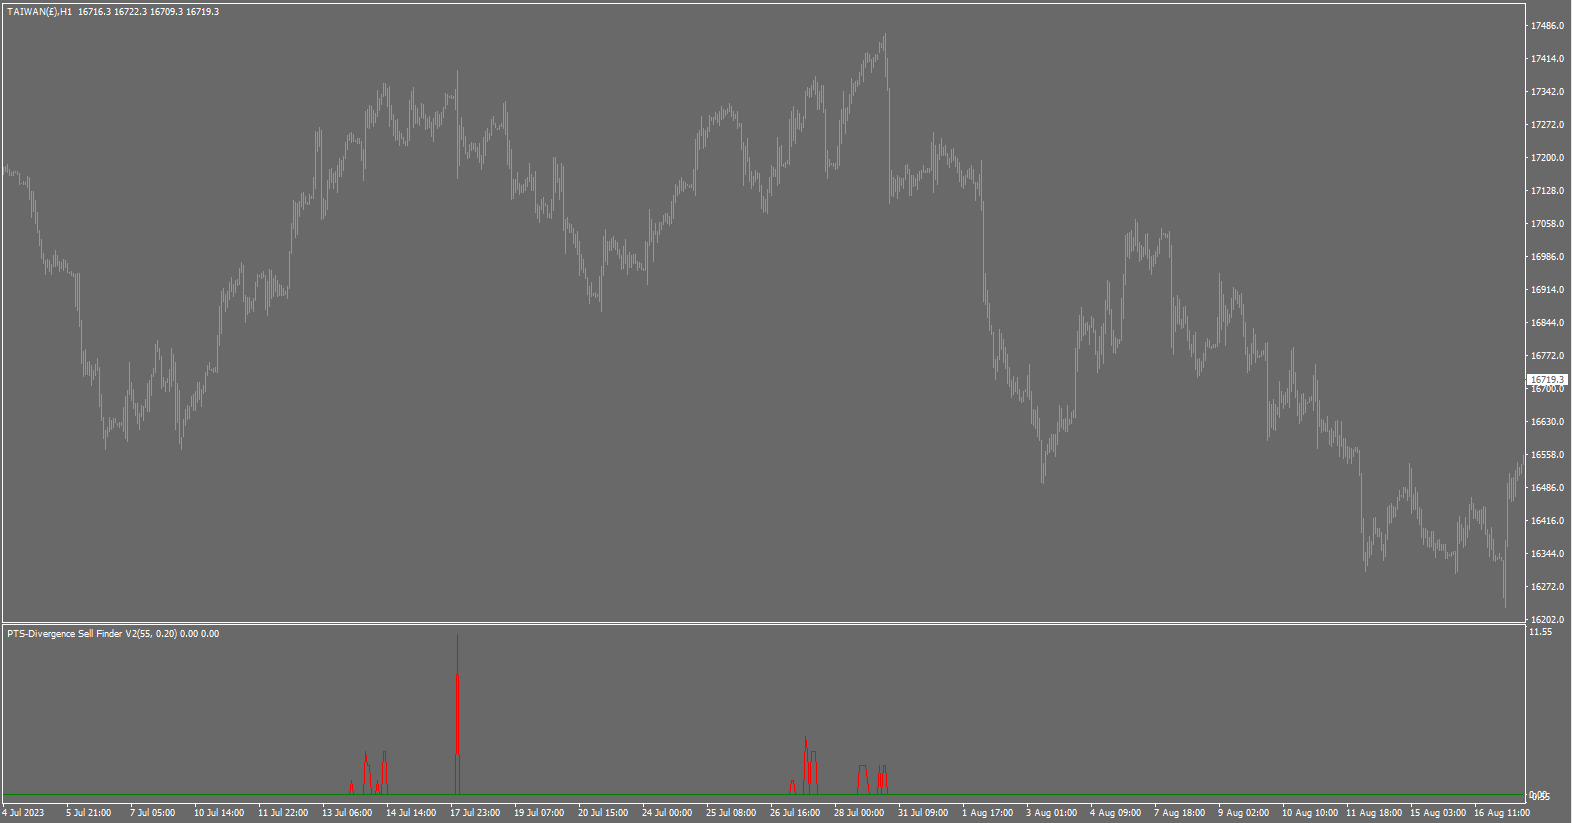
O Indicador de Venda PTS Divergence Finder mede com precisão o número de divergências que ocorreram no Índice de Demanda, que é um indicador baseado no volume. Como o MT4 fornece volume de ticks em vez de volume de negociação, as oscilações no indicador subjacente do Índice de Demanda são cerca de 10 vezes menores, então a entrada de diferença deve ser reduzida como indicado abaixo.

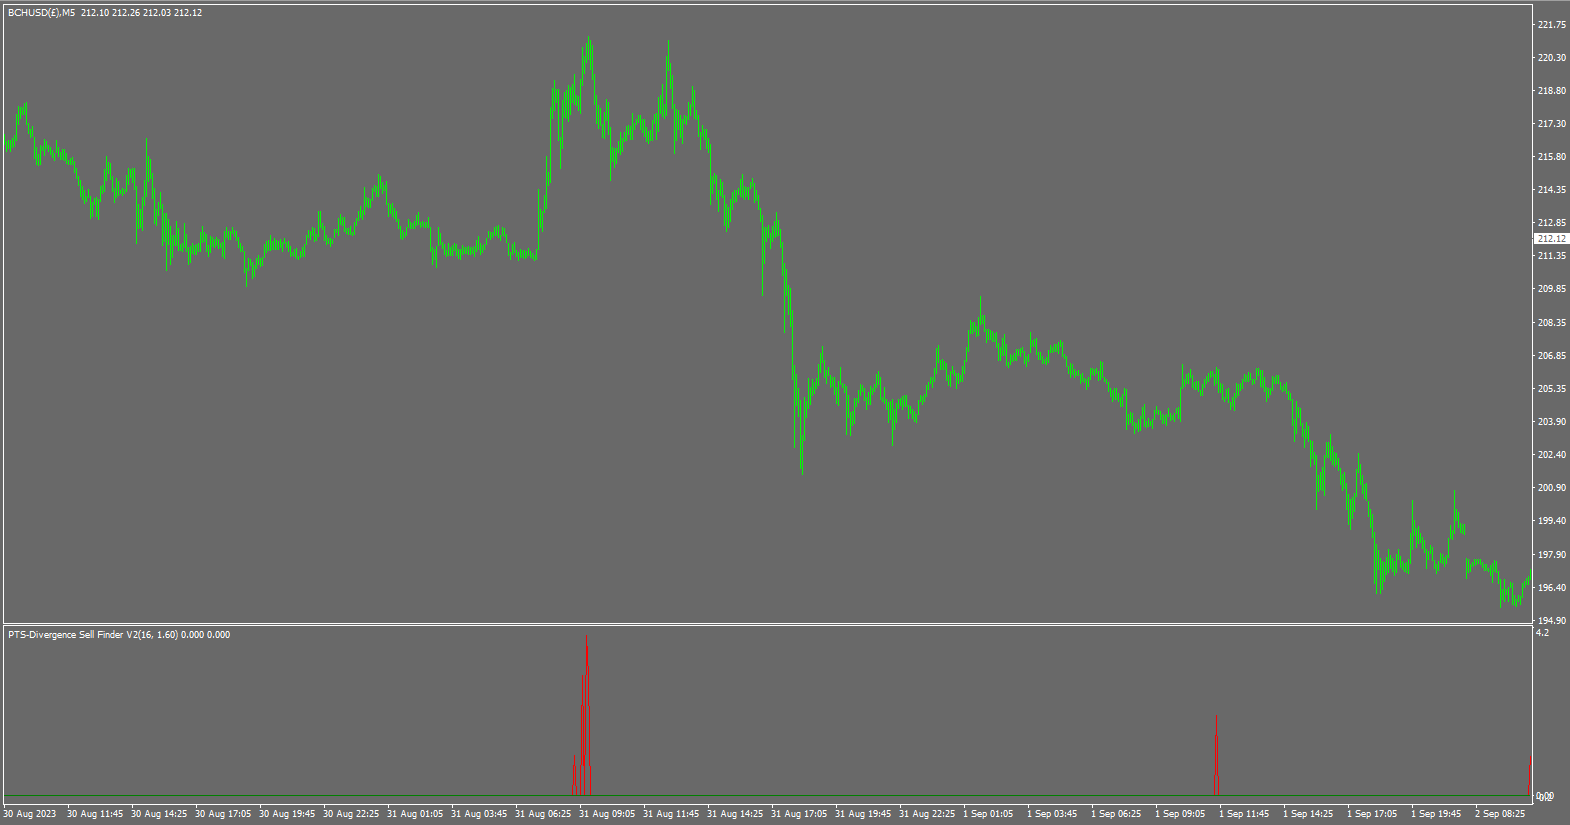
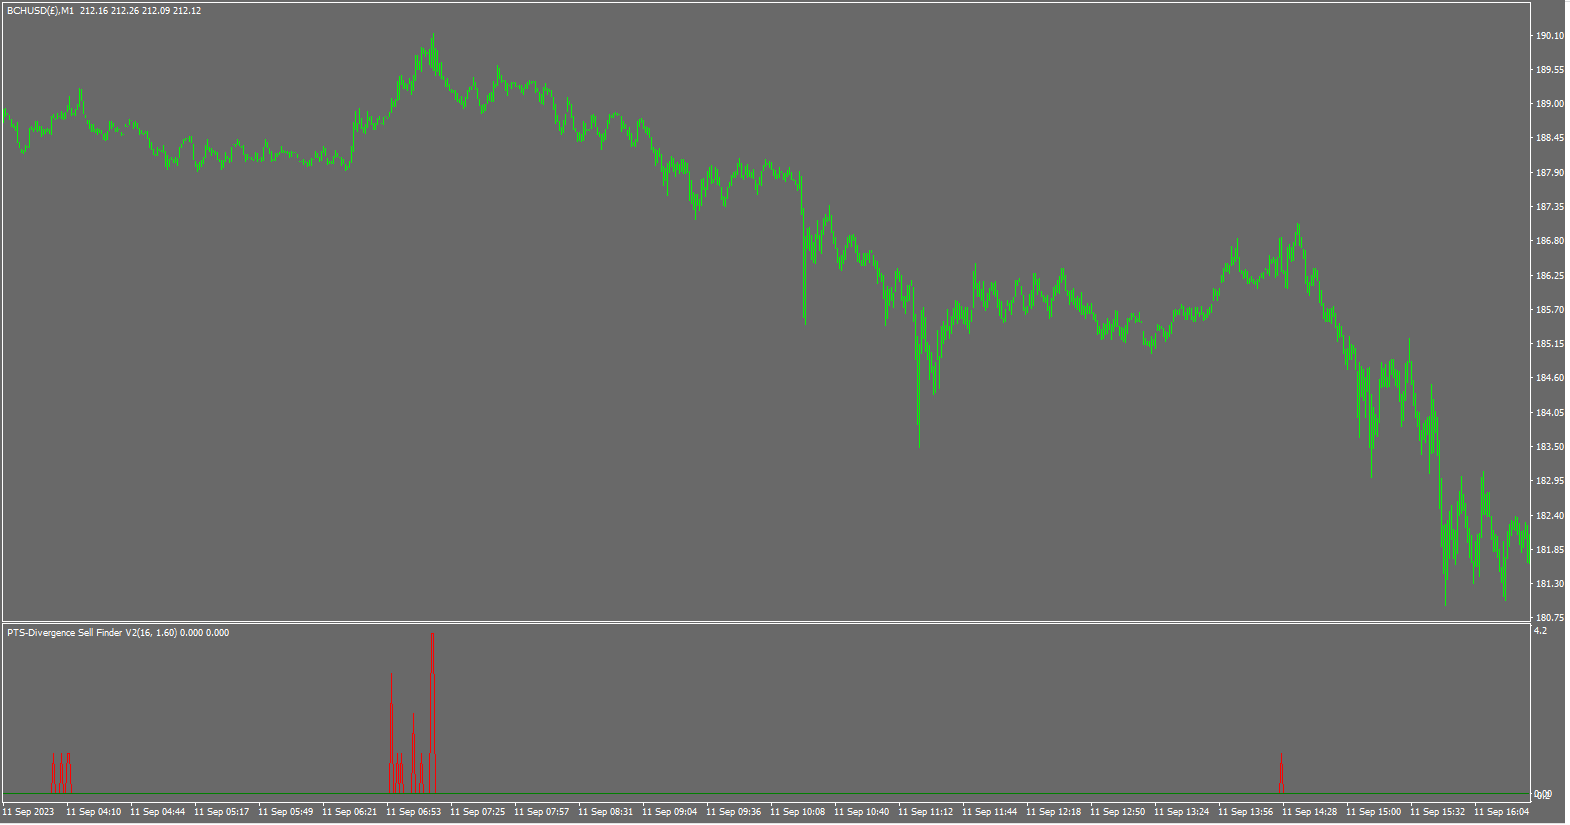
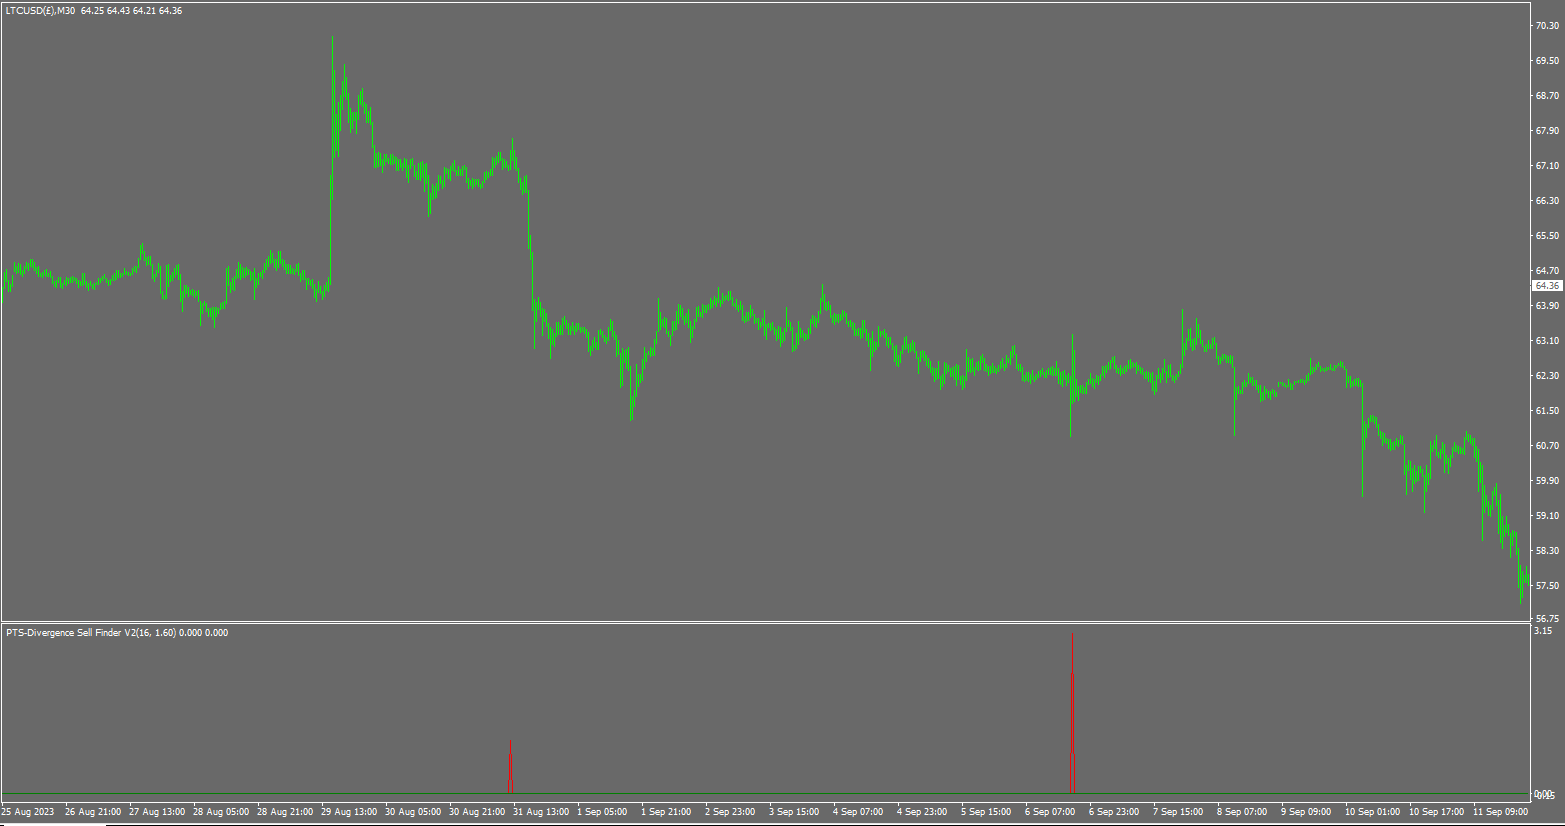
Este é um indicador de estilo de histograma para o subgráfico dois, que traça picos que se parecem com estalactites subindo da base.

O indicador examina vários períodos anteriores do Índice de Demanda baseado no volume pelo comprimento que você especificar. Ele encontra pontos altos nos preços onde o DI não está fazendo um novo alto "local" e o está perdendo pela configuração de "diferença" que você inserir.

Mercados líquidos onde muitas pessoas votam na direção do mercado oferecem os melhores resultados.

Um total de vinte períodos anteriores são verificados em cada barra e esses são codificados rigidamente e não ajustáveis. O comprimento do Índice de Demanda é ajustável pelo usuário, mas é sugerido que não se afaste muito da configuração padrão de comprimento 55.

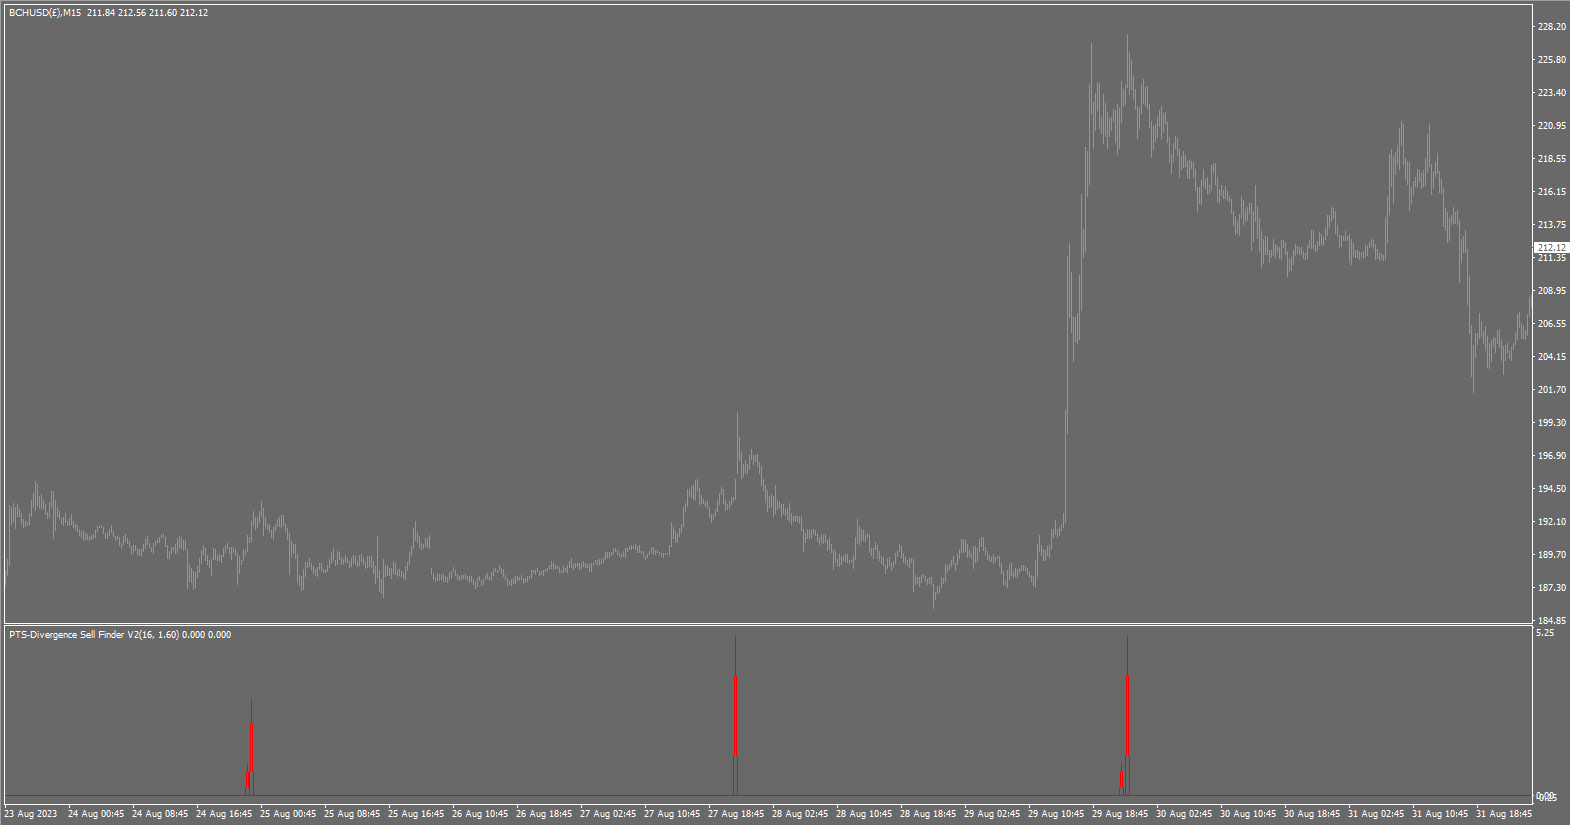
O segundo campo ajustável pelo usuário é a diferença e isso representa a diferença entre o Índice de Demanda agora e o Índice de Demanda N barras atrás. (N sendo 20 diferentes períodos anteriores de vários períodos)

Você entenderá que um Índice de Demanda de comprimento 18 produz um gráfico muito mais volátil do que um período de 80.

Por essa razão, você pode encontrar comprimentos curtos do Índice de Demanda e pequenos valores de diferença produzirão muitos mais sinais de divergência, pois há uma maior volatilidade no indicador subjacente. (Declaração repetida para enfatizar)

Você observará isso quando o usar. Você pode configurá-lo para fornecer centenas de valores insignificantes, mas é melhor usá-lo para ver apenas os significativos, seguindo as diretrizes abaixo.

A natureza do medo e da ganância é completamente diferente, pois o medo é rápido e impulsionado pelo instinto nos topos do mercado, já que as emoções opostas do medo e da euforia podem levar instantaneamente o cérebro humano ao modo de sobrevivência de luta ou fuga.

Nas condições de fundo ou sobrevenda nos mercados, a ganância se propaga lentamente entre os compradores, pois consideram a aquisição de compras de valor nos mínimos do mercado com uma mentalidade de ter baixas expectativas de sucesso.

Isso é o que causa a assimetria nos topos e fundos do mercado. Portanto, as configurações assimétricas das versões de compra e venda deste produto são explicadas agora com clareza.

Decidi lançar o indicador de divergência de venda com configurações padrão "mais rigorosas".

O comprimento do Índice de Demanda usado é 55 e a diferença necessária para disparar um sinal é 0,25. Estas, é claro, são ajustáveis pelo usuário. A rigorosidade significa que há menos sinais insignificantes.

Os resultados são muitos topos e pontos intermediários definidos com precisão. Como esperado, existem alguns sinais desastrosos no meio de tendências fortes de alta, em que um trader pode perder se não usar gerenciamento de risco e stops. Da mesma forma, muitas vezes encontra o topo exato.

Comprimento do DI 20 = diferença de 0,95 - 3

Comprimento do DI 30 = diferença de 0,85 - 2,3

Comprimento do DI 40 = diferença de 0,75 - 2,1

Comprimento do DI 50 = diferença de 0,25 - 1,8

Comprimento do DI 60 = diferença de 0,2 - 1,5

Comprimento do DI 70 = diferença de 0,15 - 1,2

Comprimento do DI 80 = diferença de 0,1 - 1,1

Comprimento do DI 90 = diferença de 0,1 - 0,9

Comprimento do DI 100 = diferença de 0,1 - 0,8

Comprimento máximo = 100.

Como usar.

Observe a divergência e aguarde o rompimento da tendência antes de vender. Essa medição pode ser definida como uma mínima de 20 barras ou uma média móvel virando para baixo, por exemplo.

Os prazos que funcionam bem variam, alguns bons resultados em M1 e H1 foram observados recentemente.

Se você tiver alguma dúvida, é melhor me enviar um e-mail através do meu site, que você pode encontrar pesquisando, pois não tenho notificações push habilitadas. Se me enviar uma mensagem aqui, pode levar uma ou duas semanas antes que eu a veja.


Produtos recomendados
Infinity Trend Pro
Yaroslav Varankin
1 (1)
This is a trend indicator without redrawing Developed instead of the binary options strategy (by the color of the Martingale candlestick) Also works well in forex trading When to open trades (binary options) A signal will appear in the place with a candle signaling the current candle It is recommended to open a deal for one candle of the current timeframe M1 and M5 When a blue dot appears, open a deal up When a red dot appears, open a trade down. How to open trades on Forex. When a signal is rec
1 000 USD
Heiken Ashi Smoothed Strategy is a very simple but powerful system to get forex market trend direction. This indicator is actually 2 indicators in 1 pack, Heiken Ashi and Heiken Ashi Smoothed Moving Average both included. Because HA (Heiken Ashi) and HAS (Heiken Ashi Smoothed) are calculated in the same one system event with necessary buffers and loop only, so it is the FAST, OPTIMIZED and EFFICIENT HA having the combined indicator of MetaTrader 4. You can choose to display HA and HAS in the sam
77.77 USD
Line Magnit
Aleksey Trenin
The LineMagnit Indicator for MT4 is a highly precise tool that builds support and resistance levels which magnetically attract prices. This feature allows traders to easily determine the most probable entry and exit points in the market, as well as identify the market's directional forces, as levels are based on capital inflows into the instrument. Equipped with an intuitively understandable graphical interface, the LineMagnit Indicator enables users to quickly locate and analyze support and res
150 USD
CyberZingFx Trend Reversal
Afsal Meerankutty
4.26 (19)
Indicator captures the trend reversals with no-repaint Buy and Sell Arrow signals. CyberZingFx Trend Reversal Indicator - your go-to solution for accurate and reliable trend reversal signals. With its  advanced trading strategy , the indicator offers you Buy and Sell Arrow signals that do not repaint, making it a reliable tool for catching Swing Highs and Swing Lows in any market and any time frame. Indicator works on  any market  and  any time frames . __________________________________________
149 USD
PABT Pattern Indicator - it's classical system one of the signal patterns. Indicator logic - the Hi & Lo of the bar is fully within the range of the preceding bar, look to trade them as pullback in trend. In the way if indicator found PABT pattern it's drawing two lines and arrow what showing trend way.  - First line - it's entry point and drawing at: 1. On the high of signal bar or on middle of the signal bar (depending from indicator mode) for buy; 2. On the low of signal bar or on middle of t
110 USD
Insider Scalper Binary This tool is designed to trade binary options. for short temporary spends. to make a deal is worth the moment of receiving the signal and only 1 candle if it is m1 then only for a minute and so in accordance with the timeframe. the accuracy of this tool is about to 80% for better results, you need to select well-volatile charts.... recommended currency pairs eur | usd, usd | jpy .... the indicator is already configured, you just have to add it to the chart and tra
103 USD
The Th3Eng PipFinite indicator is based on a very excellent analysis of the right trend direction with perfect custom algorithms. It show the true direction and the best point to start trading. With StopLoss point and Three Take Profit points. Also it show the right pivot of the price and small points to order to replace the dynamic support and resistance channel, Which surrounds the price. And Finally it draws a very helpful Box on the left side on the chart includes (take profits and Stop loss
89 USD
Renko, Heiken Ashi, Ticks Bar, Range Bar.    Easy switching, easy setup, all in one window.        Place the Custom Chart indicator and view Renko, Heiken Ashi, Tick bar, Range bar charts in real time at real chart.    Position the offline chart window so that the indicator control panel is visible.    Switch the chart mode by click of a button.    Connect to the output chart any indicator, expert advisor without any restrictions.    No, it doesn't work in the tester.    Yes, you can use an
50 USD
Master Scalping M1 é um indicador inovador que usa um algoritmo para determinar a tendência de forma rápida e precisa. O indicador calcula o tempo de abertura e fechamento de posições, os algoritmos do indicador permitem encontrar os momentos ideais para entrar em uma negociação (comprar ou vender um ativo), o que aumenta o sucesso das transações para a maioria dos traders. Benefícios do indicador: Fácil de usar, não sobrecarrega o gráfico com informações desnecessárias. Pode ser usado como filt
30 USD
Super Gator
Agustinus Biotamalo Lumbantoruan
This indi shows the following 1. Supertrend 2. Alligator (Not a regular alligator) 3. ZigZag 4. Moving Average 5. Trend Continuation/Mini correction Signal (plotted in X) (See screenshots in green background color 6. Early Signal Detection (See screenshots in green background color) You may treat Alligator as the lagging indicator The leading indicator is the supertrend. The zig zag is based on the leading indicator where it gets plotted when the leading indicator got broken to the opposite.
150 USD
Stepping Trend
Mpendulo Chiliza
The Stepping Trend Indicator     The Steppi ng Trend indicator uses the  average true range  (ATR indicator) in its calculation. This gives you control to set your own average true range period, I set the Default as 10.   Indicator Details. Green Arrow Up: This means you are at the starting point of a new bullish trend, it’s time to buy.   Red  Arrow  Down : This means you are at the starting point of a new  bearish  trend, it’ s time to sell .   What if you miss the Arrow Signal?   No
40 USD
Trendiness Index
Libertas LLC
5 (3)
"The trend is your friend" is one of the best known sayings in investing, because capturing large trendy price movements can be extremely profitable. However, trading with the trend is often easier said than done, because many indicators are based on price reversals not trends. These aren't very effective at identifying trendy periods, or predicting whether trends will continue. We developed the Trendiness Index to help address this problem by indicating the strength and direction of price trend
49 USD
The indicator displays the data of the Stochastic oscillator from a higher timeframe on the chart. The main and signal lines are displayed in a separate window. The stepped response is not smoothed. The indicator is useful for practicing "manual" forex trading strategies, which use the data from several screens with different timeframes of a single symbol. The indicator uses the settings that are identical to the standard ones, and a drop-down list for selecting the timeframe. Indicator Parame
30 USD
Capernaum
Andriy Sydoruk
Visually, Capernaum, on the chart, appears as small arrows indicating the direction of the trend movement and the opening of trading positions. The appearance of a blue up arrow indicates that the market is beginning to rise and it is time to buy. And the appearance of a red down arrow means that the market is falling and it is high time to sell. When a suitable moment for buying appears, the indicator generates a signal exactly at the moment of its appearance and not below or above the current
66 USD
New, more accurate version of the Xmaster indicator. More than 200 traders from around the world have conducted more than 15,000 tests of different combinations of this indicator on their PCs in order to get the most effective and accurate formula. And here we present to you the "Xmaster formula indicator forex no repaint" indicator, which shows accurate signals and does not repaint. This indicator also sends signals to the trader by email and push. With the arrival of each new tick, it constan
58 USD
PipFinite Trend PRO
Karlo Wilson Vendiola
4.9 (2763)
Breakthrough Solution For Trend Trading And Filtering With All Important Features Built Inside One Tool! Trend PRO's smart algorithm detects the trend, filters out market noise and gives entry signals with exit levels. The new features with enhanced rules for statistical calculation improved the overall performance of this indicator. Important Information Revealed Maximize the potential of Trend Pro, please visit www.mql5.com/en/blogs/post/713938 The Powerful Expert Advisor Version Automa
98 USD
Noize Absorption Index MT4
Ekaterina Saltykova
5 (1)
Noize Absorption Index - is the manual trading system that measures the difference of pressure between bears forces and bulls forces. Green line - is a noize free index that showing curent situation. Zero value of index shows totally choppy/flat market.Values above zero level shows how powerfull bullish wave is and values below zero measures bearish forces.Up arrow appears on bearish market when it's ready to reverse, dn arrow appears on weak bullish market, as a result of reverse expectation. S
199 USD
ZhiBiCCI MT4
Qiuyang Zheng
5 (1)
Os indicadores [ZhiBiCCI] são adequados para todo o ciclo de uso e também são adequados para todas as variedades do mercado. [ZhiBiCCI] Linha sólida verde é uma inversão da divergência de alta. A linha pontilhada verde é uma divergência de alta clássica. [ZhiBiCCI] A linha sólida para o vermelho é uma divergência de baixa reversa. A linha pontilhada vermelha é uma divergência clássica de baixa. [ZhiBiCCI] pode ser definido nos parâmetros (Alerta, Enviar e-mail, Enviar notificação), definid
58 USD
The Search for Reversal trend indicator can be used both for pipsing on small periods and for long-term trading. Indicator showing signals for entry. Displays both entry points and the trend itself. Shows statistically calculated times to enter the market with arrows. Using the indicator, you can optimally distribute the risk coefficient. Uses all one parameter for settings. When choosing a parameter, it is necessary to visually resemble so that the corresponding graph has an excellent projec
79 USD
Chart Patterns Detect 15 patterns (Ascending Triangle, Descending Triangle, Rising Wedge, Falling Wedge, Bullish Flag, Bearish Flag, Bullish Rectangle, Bearish Rectangle Symmetrical triangle, Head and Shoulders, Inverted Head and Shoulders, Triple top, Triple Bottom, Double Top, Double Bottom) Use historical data to calculate the probability of each pattern to succeed (possibility to filter notification according to the chance of success) gives graphic indication about the invalidation level and
58 USD
Forex Gump
Andrey Kozak
2.83 (6)
Forex Gump is a fully finished semi-automatic trading system. In the form of arrows, signals are displayed on the screen for opening and closing deals. All you need is to follow the instructions of the indicator. When the indicator shows a blue arrow, you need to open a buy order. When the indicator shows a red arrow, you need to open a sell order. Close orders when the indicator draws a yellow cross. In order to get the most effective result, we recommend using the timeframes H1, H4, D1. There
69 USD
SystemBinaryM1
Andrey Spiridonov
SystemBinaryM1 - a professional indicator for trading short-term binary options, is a complete, self-contained author's strategy for working in the binary options market. The unique algorithm for analyzing the foreign exchange market is based on the calculation of reference points on three different time periods M15, M5. M1. Thus, the indicator simultaneously analyzes the long-term, medium-term and short-term price behavior before issuing a signal. The indicator is set in the usual way and work
30 USD
VR Cub
Vladimir Pastushak
VR Cub é um indicador para obter pontos de entrada de alta qualidade. O indicador foi desenvolvido para facilitar cálculos matemáticos e simplificar a busca por pontos de entrada em uma posição. A estratégia de negociação para a qual o indicador foi escrito tem provado a sua eficácia há muitos anos. A simplicidade da estratégia de negociação é a sua grande vantagem, o que permite que até mesmo os comerciantes novatos negociem com sucesso com ela. VR Cub calcula os pontos de abertura de posição e
34 USD
Fibonacci indicator based on fractal.This software can automatically draw the golden section proportional line of two trend lines, and mark all the recent high and low prices.And the percentage value of volatility is a multi-cycle, multi-currency oscillation indicator.It is very effective for traders to find support and resistance lines and find entry and exit points near them.
120 USD
Alpha Trend
Evgeny Belyaev
3.33 (3)
Alpha Trend is a trend indicator for the MetaTrader 4 platform; it has been developed by a group of professional traders. The Alpha Trend indicator finds the most probable tendency reversal points, which allows making trades at the very beginning of a trend. This indicator features notifications, which are generated whenever a new signal appears (alert, email, push-notification). This allows you to open a position in a timely manner. Alpha Trend does not redraw, which makes it possible to evalua
35 USD
Heiken Ashi candle chart is an improved version of The Japanese candle chart, which can effectively filter the market "noise" of the Japanese candle chart. It is favored by many traders for its simplicity and intuition. For trend traders, the HA candle chart is a magic tool. Unlike the traditional Japanese candle chart, Heikenashi does not reflect the opening price, high price, low price and closing price of the market. Instead, Heikenashi calculates the value of a single K line in the dominant
30 USD
Owl smart levels
Sergey Ermolov
4.76 (41)
Versão MT5  |  Como instalar?   |   FAQ O   Indicador Owl Smart Levels   é um sistema de negociação completo dentro de um indicador que inclui ferramentas populares de análise de mercado, como   fractais avançados de Bill Williams , Valable ZigZag que constrói a   estrutura de onda correta   do mercado e   níveis de Fibonacci que marcam os níveis exatos de entrada no mercado e lugares para obter lucros. Descrição detalhada da estratégia Instruções para trabalhar com o indicador Consultor de neg
97 USD
Laser Trend
Nicolas Zouein
The trend is your friend! This is what this indicator is all about. Follow this famous saying and be safe. Characteristics: Buy/Sell signals fixed on the close of a bar. Works on all symbols and all timeframes. Clear visual market trend laser line, Buy/Sell signal arrows, market strength meter, TP1 & TP2 boxes. Visual signals when to enter, when to exit the market. No repainting. Compatible with Flexible EA for trading automation. (Ask for a free set file optimized to perform 2010-2018) Para
50 USD
Forex Indicator "MACD with Trend ZigZag" for MT4 MACD   indicator itself is one of the most popular tool for trend trading "MACD with Trend ZigZag" is excellent for using   with Price Action entries or in combination with other indicators Use this indicator to select most accurate entry signals: - If MACD is above 0 (green color) and ZigZag line is upward - search only for Buy Price Action patterns -  If MACD is below 0 (pink color) and ZigZag line is downward - search only for Sell Price Action
39.99 USD
Distinctive
Tatiana Savkevych
Distinctive is a forex trending arrow indicator for identifying potential entry points. I like it, first of all, because it has a simple mechanism of work, adaptation to all time periods and trading tactics. Created on the basis of a regression channel with filters. Plotting the Lawrence indicator signals on a price function chart using a mathematical approach. How it works - when the price breaks out in the overbought / oversold zone (channel levels), a buy or sell signal is generated. Every
119 USD
Os compradores deste produto também adquirem
ACTUALMENTE COM 26% DE DESCONTO A melhor solução para qualquer novato ou comerciante especializado! Este Indicador é uma ferramenta comercial única, de alta qualidade e acessível, porque incorporámos uma série de características proprietárias e uma nova fórmula. Com apenas UM gráfico, pode ler a força da moeda para 28 pares de Forex! Imagine como a sua negociação irá melhorar porque é capaz de apontar o ponto exacto do gatilho de uma nova tendência ou oportunidade de escalada? Manual do u
148 USD
Advanced Supply Demand
Bernhard Schweigert
4.91 (304)
Atualmente com 33% de desconto! A melhor solução para qualquer Trader Novato ou especialista! Este indicador é uma ferramenta de negociação exclusiva, de alta qualidade e acessível porque incorporamos uma série de recursos proprietários e uma nova fórmula. Com esta atualização, você poderá mostrar fusos horários duplos. Você não só será capaz de mostrar um TF mais alto, mas também mostrar ambos, o TF do gráfico, MAIS o TF mais alto: MOSTRANDO ZONAS ANINHADAS. Todos os traders de Oferta e Demanda
148 USD
Actualmente 20% OFF ! A melhor solução para qualquer novato ou comerciante especializado! Este software de painel de instrumentos está a funcionar em 28 pares de moedas. É baseado em 2 dos nossos principais indicadores (Advanced Currency Strength 28 e Advanced Currency Impulse). Dá uma grande visão geral de todo o mercado Forex. Mostra valores avançados de força da moeda, velocidade de movimento da moeda e sinais para 28 pares de divisas em todos os (9) períodos de tempo. Imagine como a sua
199 USD
TrendMaestro
Stefano Frisetti
5 (1)
note: this indicator is for METATRADER4, if you want the version for METATRADER5 this is the link: TRENDMAESTRO recognizes a new TREND in the bud, he never makes mistakes. The certainty of identifying a new TREND is priceless. DESCRIPTION TRENDMAESTRO identifies a new TREND in the bud, this indicator examines the volatility, volumes and momentum to identify the moment in which there is an explosion of one or more of these data and therefore the moment in which prices have strong probability of f
397 USD
FX Power MT4 NG
Daniel Stein
5 (2)
Receba a sua atualização diária do mercado com detalhes e screenshots através do nosso Morning Briefing aqui no mql5 e no Telegram ! O FX Power MT4 NG é a próxima geração do nosso medidor de força de moeda muito popular de longa data, o FX Power. E o que é que este medidor de força da próxima geração oferece? Tudo o que adorou no FX Power original MAIS Análise de força GOLD/XAU Resultados de cálculo ainda mais precisos Períodos de análise configuráveis individualmente Limite de cálculo personal
169 USD
GOLD Impulse with Alert
Bernhard Schweigert
4.43 (7)
Este indicador é uma super combinação dos nossos 2 produtos Advanced Currency IMPULSE with ALERT  +   Currency Strength Exotics . Funciona para todos os períodos de tempo e mostra graficamente impulso de força ou fraqueza para as 8 principais moedas mais um Símbolo! Este Indicador é especializado para mostrar a aceleração da força da moeda para quaisquer símbolos como Ouro, Pares Exóticos, Commodities, Índices ou Futuros. É o primeiro do seu género, qualquer símbolo pode ser adicionado à
149 USD
Cycle Sniper
Elmira Memish
4.41 (34)
NEW YEAR SALE PRICE FOR LIMITED TIME!!! Please contact us after your purchase and we will send you the complimentary indicators to complete the system . Cycle Sniper is not a holy grail but when you use it in a system which is explained in the videos, you will feel the difference. If you are not willing to focus on the charts designed with Cycle Sniper and other free tools we provide, we recommend not buying this indicator. We recommend watching the videos about the indiactor and system befor
199 USD
Weis Wave with Alert
Trade The Volume Waves Single Member P.C.
4.78 (18)
Rental/Lifetime Package Options and Privileges' * For optimum results the yearly or lifetime package is suggested due to live training and Discord  channel trading with the  creator! Rent Monthly Six Months   Yearly/Lifetime Weis Wave with Speed with Alert+Speed Index x x x Manual  x x x Quick Set up Video x x x Blog x x x Lifetime Updates x x x Setup and Training Material x x Free Rectangle Break Alert Tool      x Discord Access Channel "The SI traders" x 2-hour live methodology traini
599 USD
FX Volume
Daniel Stein
4.59 (34)
Receba a sua atualização diária do mercado com detalhes e screenshots através do nosso Morning Briefing aqui no mql5 e no Telegram ! O Volume FX é o PRIMEIRO e ÚNICO indicador de volume que fornece uma visão REAL do sentimento do mercado do ponto de vista de um corretor. Ele fornece uma visão incrível de como os participantes do mercado institucional, como corretores, estão posicionados no mercado Forex, muito mais rápido do que os relatórios COT. Ver essas informações diretamente no seu gráfi
249 USD
MTF Supply Demand Zones
Georgios Kalomoiropoulos
4.83 (23)
Próxima geração de zonas automatizadas de oferta e demanda. Algoritmo novo e inovador que funciona em qualquer gráfico. Todas as zonas estão sendo criadas dinamicamente de acordo com a ação do preço do mercado. DOIS TIPOS DE ALERTAS --> 1) QUANDO O PREÇO ATINGE UMA ZONA 2) QUANDO UMA NOVA ZONA É FORMADA Você não recebe mais um indicador inútil. Você obtém uma estratégia de negociação completa com resultados comprovados.     Novas características:     Alertas quando o preço ati
149 USD
TPA True Price Action indicator reveals the true price action of the market makers through 100% non-repainting signals (except early signals mode) strictly at the close of a candle! TPA shows entries and re-entries, every time the bulls are definitely stronger than the bears and vice versa. Not to confuse with red/green candles. The shift of power gets confirmed at the earliest stage and is ONE exit strategy of several. There are available now two free parts of the TPA User Guide for our custo
168 USD
Scalping and Binary Signal Detector - Indicador de scalping que fornece sinais direcionais para abertura de posições ao longo da tendência. O indicador é um sistema de negociação completo que pode ser usado para Forex e opções binárias. O sistema de algoritmos permite reconhecer movimentos intensos de preços em diversas barras consecutivas. O indicador fornece vários tipos de alertas para setas. Funciona em quaisquer instrumentos de negociação e prazos (recomendado M5 ou superior). Como u
159 USD
Price Action Entry Alerts
Stephen Sanjeeve Sahayam
5 (2)
Este indicador analisa cada barra de pressão de compra ou venda e identifica 4 tipos de padrões de velas com o maior volume. Essas velas são filtradas usando vários filtros lineares para mostrar sinais de compra ou venda. Os sinais funcionam melhor, em conjunto com a direção do período de tempo mais alto e quando negociados durante as horas de alto volume. Todos os filtros são personalizáveis ​​e funcionam de forma independente. Pode visualizar sinais de uma única direção com o clique de um bot
225 USD
Entry Points Pro
Yury Orlov
4.7 (224)
Este é um indicador para MT4 que fornece sinais precisos para entrar em uma negociação sem redesenhar. Ele pode ser aplicado a qualquer ativo financeiro: forex, criptomoedas, metais, ações, índices. Ele fornecerá estimativas bastante precisas e informará quando é melhor abrir e fechar um negócio. Assista o vídeo (6:22) com um exemplo de processamento de apenas um sinal que compensou o indicador! A maioria dos traders melhora seus resultados de negociação durante a primeira semana de negociação c
249 USD
Enigmera
Ivan Stefanov
5 (1)
ENIGMERA: O núcleo do mercado https://www.enigmera.com Introdução Este indicador e sistema de negociação é uma abordagem notável aos mercados financeiros. ENIGMERA utiliza os ciclos fractais para calcular com precisão os níveis de suporte e resistência. Mostra a autêntica fase de acumulação e dá direcções e objectivos.  Um sistema que funciona quer estejamos numa tendência ou numa correção.  Como é que funciona? O ENIGMERA é composto por três linhas: a linha de suporte/resistência, a linha
1 800 USD
Smart Ai Levels  Accumulation & Distribution indicator Smart Ai Levels are Ai controlled indicator which is based on Wyckoff Price cycle theory . It automatically scans the Accumulation & Distribution phases on chart and Ai draws the possible areas before Mark up and Mark down which acts as hot zones and can be traded with confirmation to catch those big price movements . It's a great tool for both Reversal and Breakout Trades suitable to all Trading Styles such as Scalping - Intraday - Swing 
249 USD
"Supply / Demand Zones" The concepts of supply and demand zones   are undoubtedly two of the most highly discussed attributes of technical analysis. Part of analysing chart of pattern , these terms are used by traders   to refer to price levels i n charts that tend to act as barriers, preventing the price of an asset from getting pushed in a certain direction. At first, the explanation and idea behind identifying these levels seems easy, but as you'll find out, supply and demand zones can co
199 USD
NNFX Strength System
Benjamin Joshua Nash
3 (1)
A complete NNFX algorithm in one indicator. NEW: Inbuilt backtester shows historical trade stats on the chart to show which pairs are most profitable. Don't be fooled. It's not enough to simply match a strong and weak currency to trade successfully with a strength meter, you need to know the intimate details of the relationship between two currencies. This is exactly what we've done with NNFX Strength, giving you all the information you need to make solid trading decisions. Years in the makin
150 USD
Introduction to Fractal Pattern Scanner Fractal Indicator refers to the technical indicator that makes use of the fractal geometry found in the financial market. Fractal Pattern Scanner is the advanced Fractal Indicator that brings the latest trading technology after the extensive research and development work in the fractal geometry in the financial market. The most important feature in Fractal Pattern Scanner is the ability to measure the turning point probability as well as the trend probabi
180 USD
Volume by Price MT4
Brian Collard
5 (14)
The Volume by Price Indicator for MetaTrader 4 features Volume Profile and Market Profile TPO (Time Price Opportunity). Get valuable insights out of currencies, equities and commodities data. Gain an edge trading financial markets. Volume and TPO histogram bar and line charts. Volume Footprint charts. TPO letter and block marker charts including split structures. Positioning and styling options to suit the user's needs and context. Highlight Volume Profile and Market Profile TPO Point of Contro
259 USD
Difícil de encontrar e com pouca frequência, as divergências são um dos cenários de negociação mais confiáveis. Este indicador localiza e verifica automaticamente divergências ocultas e regulares usando seu oscilador favorito. [ Guia de instalação | Guia de atualização | Solução de problemas | FAQ | Todos os produtos ] Fácil de trocar Encontra divergências regulares e ocultas Suporta muitos osciladores conhecidos Implementa sinais de negociação baseados em fugas Exibe níveis adequados de
249 USD
Full STO
Roman Smoroda
Indicador STO completo (inclui todas as versões dos três indicadores STO: Premium, Gold, Silver) - STABLE TRADE OPTION foi concebido para a negociação automática de opções binárias.  LER COM ATENÇÃO!!!!! IMPORTANTE Num terminal, criar dois modelos com expirações diferentes, um modelo para as 18:01, 18:02 com expirações de 1 a 15 minutos e um modelo para as 22:00 com expirações de 10 a 20 minutos. Taxa de vitórias: 71% nos últimos 5 anos Gestão de dinheiro: 0,3% do depósito Esta versão
500 USD
ECM Elite Channel é um indicador baseado na volatilidade, desenvolvido com um algoritmo de tempo especifico, que consiste em encontrar possíveis correções no mercado. Este indicador mostra duas linhas exteriores, uma interior (linha de retração) e um sinal de seta, onde a teoria do canal consiste em ajudar a identificar condições de sobrecompra e sobrevenda no mercado. O preço do mercado cairá geralmente entre os limites do canal. Se os preços tocarem ou se moverem para fora do canal é uma
250 USD
CFF Banks Liquidity
Abdalla Mohamed Kandil
CFF Banks Liquidity     Entry signals without repainting or delays     Error-free opening of trades     Provides signals for any direction sell & Buy Join Our Public Telegram Channel for latest updates and set files.   | Our Telegram Channel How does the CFF Banks Liquidity Works? Our CFF Banks Liquidity trading system based on a very accurate "Trend-Following" Trading Strategy. Here's how to Start using our System 1.      Buy and install the indicator in your terminal. Ask the guide.
313 USD
Hello Dear Trader, Today Im Telling You About The "Golden Scalp System V1 " Metatrader4 Golden Scalp System Scalper with EMA   This is a  Scalper strategy   based on ( Exponential moving average) EMA . Time frame: H1 Pair: EUR/USD, GBP/USD,AUD/USD XAU/USD Platform Mt4   Indicators for Scalper with Ema: 300  EMA (Exponential Moving Average) ; 500 EMA (Expontial Moving Average); Stochastic   (5,3,3)   Long Entry 1) 300  EMA   > 500  EMA . 2) Find significant levels of support. 3) Wait for
500 USD
Gartley Hunter Multi MT4
Siarhei Vashchylka
4.67 (3)
Gartley Hunter Multi - An indicator for searching for harmonic patterns simultaneously on dozens of trading instruments and on all classic timeframes: (m1, m5, m15, m30, H1, H4, D1, Wk, Mn). Manual (Be sure to read before purchasing) | Version for MT5 Advantages 1. Patterns: Gartley, Butterfly, Shark, Crab. Bat, Alternate Bat, Deep Crab, Cypher 2. Simultaneous search for patterns on dozens of trading instruments and on all classic timeframes 3. Search for patterns of all possible sizes. Fr
149 USD
Introduction to Chart Pattern MT Chart Pattern MT is a chart pattern scanner to detect the triangle pattern, falling wedge pattern, rising wedge pattern, channel pattern and so on. Chart Pattern MT uses highly sophisticated chart pattern detection algorithm. However, we have designed it in the easy to use with intuitive user interface. Chart Pattern MT will show all the patterns in your chart in the most efficient format for your trading. You do not have to do tedious manual pattern detection an
180 USD
This indicator will help you identify the key zones needed for The Silver Bullet Strategy which are:  The three time-windows the ICT mentioned in the strategy Window 1: 3 AM and 4 AM New York time Window 2: 10 AM and 11 AM New York Time Window 3: 2 PM to 3 PM New York Time Bullish and bearish supply and demand zones which will help you identify FVG inside those time windows T he previous day's high and low, draw on liquidity The indicator does not plot the FVGs to avoid cluttering the chart  Exi
200 USD
Este indicador é um indicador de análise automática de onda perfeito para negociação prática! A definição padronizada da banda não é mais uma onda de pessoas diferentes, e o desenho de interferências feitas pelo homem é eliminado, o que desempenha um papel fundamental na análise rigorosa da abordagem. =》Increase the choice of international style mode, (red fall green rise style)             Atualmente comprando desconto!   Conteúdo do índice: 1         Onda básica:   Primeiro, encontram
188 USD
Estratégia Sniper criada para fornecer os melhores pontos de entrada para todos os pares e todos os prazos e sempre se movendo na direção da tendência com base na ação do preço. uma vez que você domine a estratégia, ela permitirá que você tenha mais confiança em sua negociação, para que você saiba quando abrir e fechar sua negociação com lucro máximo, porque está mostrando o início da tendência com várias entradas, portanto, se você perder a entrada no início de a estratégia Sniper de tendênc
750 USD
Mais do autor
PTS Precision Index Oscillator V2
PrecisionTradingSystems
5 (1)
O Oscilador de Índice de Precisão (Pi-Osc) de Roger Medcalf da Precision Trading Systems A Versão 2 foi cuidadosamente reconfigurada para carregar rapidamente em seu gráfico, e algumas outras melhorias técnicas foram incorporadas para aprimorar a experiência. O Pi-Osc foi criado para fornecer sinais precisos de temporização de negociações projetados para encontrar pontos de exaustão extremos, os pontos para os quais os mercados são forçados a ir apenas para tirar as ordens de todos. Este
147.50 USD
PTS - Buscador de Compras por Divergência da Precision Trading Systems O Buscador de Divergência de Precisão foi projetado para encontrar fundos de mercado com precisão milimétrica e frequentemente o faz. Na análise técnica, a arte de escolher fundos geralmente é muito mais fácil do que escolher topos; este item foi projetado precisamente para essa tarefa. Após a identificação de uma divergência de alta, é prudente esperar que a tendência se reverta antes de comprar. Você pode usar um mínim
147 USD
Demand Index
PrecisionTradingSystems
Código do PTS Demand Index pela Precision Trading Systems O Demand Index foi criado por James Sibbet e utiliza um código complexo para simplificar a interpretação de volume e preço como uma combinação. Entender volumes nunca é uma tarefa fácil, mas esta bela peça de programação certamente torna isso muito mais simples. Existem várias maneiras pelas quais este indicador pode beneficiar traders e investidores. Divergências (Como um indicador líder) Após estudar muitos indicadores técn
75 USD
O Oscilador de Índice de Precisão (Pi-Osc) de Roger Medcalf da Precision Trading Systems A Versão 2 foi cuidadosamente reconfigurada para carregar rapidamente em seu gráfico, e algumas outras melhorias técnicas foram incorporadas para aprimorar a experiência. O Pi-Osc foi criado para fornecer sinais precisos de temporização de negociações projetados para encontrar pontos de exaustão extremos, os pontos para os quais os mercados são forçados a ir apenas para tirar as ordens de todos. Este
147 USD
PTS - Buscador de Compras por Divergência da Precision Trading Systems O Buscador de Divergência de Precisão foi projetado para encontrar fundos de mercado com precisão milimétrica e frequentemente o faz. Na análise técnica, a arte de escolher fundos geralmente é muito mais fácil do que escolher topos; este item foi projetado precisamente para essa tarefa. Após a identificação de uma divergência de alta, é prudente esperar que a tendência se reverta antes de comprar. Você pode usar um mínim
147 USD
PTS Demand Index MT5
PrecisionTradingSystems
Código do PTS Demand Index pela Precision Trading Systems O Demand Index foi criado por James Sibbet e utiliza um código complexo para simplificar a interpretação de volume e preço como uma combinação. Entender volumes nunca é uma tarefa fácil, mas esta bela peça de programação certamente torna isso muito mais simples. Existem várias maneiras pelas quais este indicador pode beneficiar traders e investidores. Divergências (Como um indicador líder) Após estudar muitos indicadores técn
75 USD
Filtro:
Sem comentários
Responder ao comentário