Conheça o Mercado MQL5 no YouTube, assista aos vídeos tutoriais
Como comprar um robô de negociação ou indicador?
Execute seu EA na
hospedagem virtual
hospedagem virtual
Teste indicadores/robôs de negociação antes de comprá-los
Quer ganhar dinheiro no Mercado?
Como apresentar um produto para o consumidor final?
Indicadores Técnicos para MetaTrader 5 - 35

In Kyle’s model, the variable captures price impact. Illiquidity increases with uncertainty about v and decreases with the amount of noise Kyle argues that the market maker must find an equilibrium between profit maximization and market efficiency. This indicator is based on Advances in Financial Machine Learning 2018 - Marcos Lopez de Prado book, Page 288.
Amihud studies the positive relationship between absolute returns and illiquidity. In particular, he computes the daily price response associated with one dollar of trading volume, and argues its value is a proxy of price impact. Despite its apparent simplicity, Hasbrouck [2009] found that daily Amihud’s lambda estimates exhibit a high rank correlation to intraday estimates of effective spread. This indicator is based on Advances in Financial Machine Learning 2018 - Marcos Lopez de Prado book,

Hasbrouck follows up on Kyle’s and Amihud’s ideas, and applies them to estimating the price impact coefficient based on trade-and-quote (TAQ) data. Consistent with most of the literature, Hasbrouck recommends 5-minute time-bars for sampling ticks. This indicator is based on Advances in Financial Machine Learning 2018 - Marcos Lopez de Prado book, Page 289. --- This code can run slow when using big timeframes, it use copytick to get dollar volume, in a next version I will implement a temporary i
Easley et al. [2011] proposed a high-frequency estimate of PIN, which they named volume-synchronized probability of informed trading (VPIN). This procedure adopts a volume clock, which synchronizes the data sampling with market activity. For additional details and case studies of VPIN, see Easley et al. [2013]. A number of studies have found that VPIN indeed has predictive power: Abad and Yague [2012], Bethel et al. [2012], Cheung et al. [2015], Kim et al. [2014], Song et al. [2014], Van Ness et
Easley et al. study the frequency of trades per trade size, and find that trades with round sizes are abnormally frequent. For example, the frequency rates quickly decay as a function of trade size, with the exception of round trade sizes {5, 10, 20, 25, 50, 100, 200,…}.
These authors attribute this phenomenon to socalled “mouse” or “GUI” traders, that is, human traders who send orders by clicking buttons on a GUI (Graphical User Interface).
In the case of the E-mini S&P 500, for example, si

A useful feature may be to determine the normal frequency of round-sized trades, and monitor deviations from that expected value. The ML algorithm could, for example, determine if a larger-than-usual proportion of round-sized trades is associated with trends, as human traders tend to bet with a fundamental view, belief, or conviction. Conversely, a lower-than-usual proportion of round-sized trades may increase the likelihood that prices will move sideways, as silicon traders do not typically hol

this indicator very simple and easy if you understand and agree with setup and rule basic teknical sba you can cek in link : please cek my youtube channel for detail chanel : https://t.me/SBA_FOREX_SIGNAL https://youtu.be/-Vtp99XGfe0 an for detail info contact me https://t.me/shadowbreakerfx basicly setup buy (long) for this indicator is Magenta- blue and green candle or magenta - green and green candlestik and for setup sell (short) is Black - yellow - and red candle or black - red and red
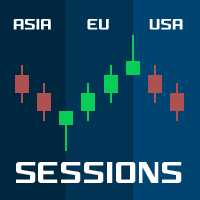
Sessions PRO is a perfect tool which divide your chart screen by 3 main market sessions: 1> asian 2> european (with division for Frankfurt and London start) 3> american
Sessions PRO is perfect especially for trading indices, where main pivot points often occurs along with new market center enters the market. With Sessions PRO you see what events happened at their exact corresponding time - European and American moves and pivot points are much more important than asian. Stop analyzing your
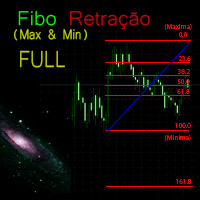
Funcional no mercado Forex. Funcional no mercado B3 - Bolsa Brasil Balcão. Motivação O indicador técnico de retração Fibonacci para muitos é essencial e a base de todas a previsões dos movimentos do mercado. O nome da ferramenta vem do matemático italiano Leonardo de Pisa (século XIII).
Essa versão FULL ira funcionar no Meta Trader 5 em qualquer tipo de conta.
Para testar na conta DEMO baixe a versão grátis em: https://www.mql5.com/pt/market/product/37855
Funcionamento O Fibo Ret

Apesar de um indicador muito simples, ele auxilia o trader que por ventura fica posicionado vários dias em uma operação se, o Swap do ativo esta a favor ou contra a sua operação. É o indicador ideal para operadores de longo prazo. O Swap é a taxa que o operador paga por ficar posicionado de um dia para outro ou as vezes de uma semana para outra. Há estratégias que além de um setup e um gerenciamento de risco contemplam também operar a favor do Swap.
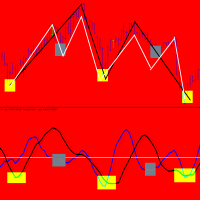
TimingCycleWithLLV is an excellent tool to determine the timing of your entry point! Everyone knows that cycles exist both in nature and in financial markets.Cycles are present in all time frames,from 1 minute to 1 year.Sometimes they are very clear to identify,others there is overlap between cycles of varyng duration. I can say this:the one-day cycle corresponds to the duration of a trading day( for example the one-day cycle for GERMAN DAX index is 14 hours as the trading day is 14 hours). Obvi

Indicador multi-nivel y multi-timeframe que permite seguir la tendencia del precio de cualquier par de divisas, metales, acciones, CFD's, etc. Intuitivo y fácil de aplicar sobre cualquier gráfico.
Parámetros: Timeframe : Marco de tiempo que se le aplicará al nivel Period : Periodo que se aplicará Applied Price : Precio a aplicar
Aplicaciones: Se puede usar aplicando diferentes niveles sobre el mismo gráfico, por ejemplo, in nivel de 8, 14, 20, etc.
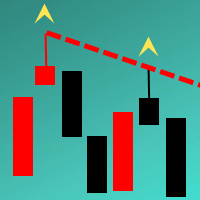
The Indicator automatically draws trend lines on the specified timeframe ( Trend lines period parameter). The lines are drawn based on the last two known fractals of the specified period. If you want the lines to be drawn only on the confirmed fractal, then set the Confirmed or unconfirmed fractal parameter to True . Indicator feature - lines are drawn with the accuracy of any timeframe. It allows analyzing the chart on smaller timeframes without loosing the precision of drawing the lines in re
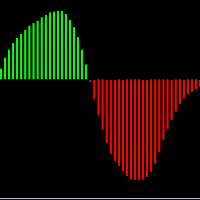
É um indicador oscilador baseado no "MACD" convencional porém com suavização . Através desse indicador você será capaz de operar sem os ruídos produzidos pelo indicador "MACD" convencional. Em quais ativos o indicador funciona: Em qualquer ativo do mercado, tanto em forex, como B3 ou binárias. Qual é o novo parâmetro: Smooth Period ou período de suavização, que representa o período que será suavizado no "MACD".

Индикатор показывает развороты рынка в виде стрелок. Разворотные сигналы основаны на моих личных наблюдениях за поведением рынка. В основу взяты такие принципы как поиск экстремумов, объемы и Price Action. Индикатор дает сигналы на следующих принципах: Поиск окончания тенденции на рост/снижение рынка Поиск модели разворота на основе Price Action Подтверждение разворота объемом контракта. Также в индикатор встроен сигнал при появлении стрелки. Индикатор не перерисовывается. Индикатор не перерисов
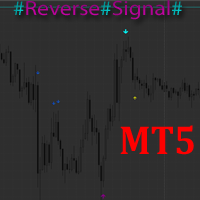
Версия индикатора MT4 - https://www.mql5.com/ru/market/product/16415 Индикатор обозначает предполагаемые развороты рынка в виде стрелок. В индикатор встроены 3 вида разворота. Основной сигнал на разворот. Это более сильный и важный разворот. Обозначается самой крупной стрелкой. Альтернативный сигнал - это дополнительный сигнал без использования дополнительных фильтров в отличие от основного. Подойдет для скальпирования на малых таймфреймах. Смесь основного разворота и альтернативного, но с доба

Vejamos a natureza das mudanças de preço no mercado Forex, não prestando atenção às razões pelas quais essas mudanças ocorrem. Essa abordagem nos permitirá identificar os principais fatores que afetam o movimento dos preços. Por exemplo, vamos considerar os preços de abertura das barras no par de moedas EUR-USD e no período de tempo H1. Por esses preços, construímos o diagrama de Lameray (Figura 1). Neste diagrama, pode-se ver que o movimento dos preços ocorre basicamente de acordo com uma equaç

this is an indicator to clarify seeing Low and High in the market and is very useful for facilitating those who are studying technical price action
this is a type of indicator that gives color to the candlestick where the indicator is divided into 3 colors red = bearish green = Bullish
Gray = base
this indicator can be used on the forex market or the mt5 binary market. https://t.me/SBA_FOREX_SIGNAL

Технический индикатор "Reversal patterns" является математической интерпретацией классических разворотных паттернов: Pin Bar, Harami и Engulfing. То есть «Разворотного бара», «Харами» и «Поглощения». Данный индикатор позволяет определить момент разворота котировок на основе рыночной динамики и победителя между «быками» и «медведями». Индикатор отображает момент разворота на локальных максимумах и минимумах графика любого таймфрейма, что позволяет повысить точность сигнала. Также индикатор имеет

Niubility Trend Niubility Trend displays the trend direction for all time frames in real time.
You'll see at a glance at which direction the trends are running, how long they last and how powerful they are.
All this makes it an easy-to-use trend trading system for beginners, advanced and professional traders.
Features
Easy to trade Customizable colors and sizes It is non-repainting and non-backpainting It is fantastic as a trailing stop method It implements alerts of all kinds

A singularidade deste indicador reside no algoritmo de contabilidade de volume: a acumulação ocorre diretamente para o período selecionado sem referência ao início do dia. As últimas barras podem ser excluídas do cálculo, então os dados atuais terão menos influência sobre os níveis significativos (volumes) formados anteriormente. Para um cálculo mais preciso, os dados do gráfico M1 são usados por padrão. A etapa de distribuição dos volumes de preços é regulamentada. Por padrão, a borda direita d
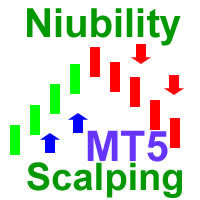
Niubility Scalping The Niubility Scalping indicator detects trend, give sell point and buy point. this indicator can use for scalping technique, and also use for trend technique.
Attention
Chart statistics will help you to optimize your trading, statistical accuracy to the hour.
It can works on every timeframe.
The indicator analyzes its own quality and performance.
Losing signals are highlighted and accounted.
The indicator is non-repainting.
It implements sound alerts.
Parame
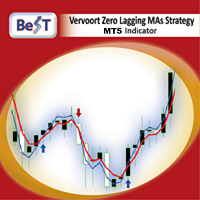
All those involved in trading do certainly know that Moving Average Crossovers for being tradable should be reliable and also they need to have minimal lag.
BeST_Vervoort Zero Lagging MAs Strategy is an outstanding indicator that can help you to achieve it and is based on S.Vervoort's work about Reliable and of Zero Lag MAs Crossovers as described in his TASC_05/2008 article " The Quest For Reliable Crossovers ". It's a Multipotentiality Indicator as it can display of either simply the Zero Lag

Niubility RSI and Fibo The RSI will send an alert when the RSI value of the price gets to the level specified in the settings.
The input of the indicator can allow for change of RSI period, overbought and oversold.
The RSI will work for multi timeframe.
The RSI will scan different pairs.
This Fibo is designed to draw a Fibonacci retracement, using as a basis the ZigZag indicator.
Description:
'up' word means up trend.
'down' word means down trend.
' -- ' word means no tre

The indicator calculates volume profiles dynamically and displays the result as VAL, VAH and POC curves.
Indicator features The indicator uses the historical data of the lower (relative to the current) timeframes for calculations: M1 - for timeframes up to H1, M5 - for timeframe H1, M15 - for timeframe H4, H1 - for timeframe D1, H4 - for timeframe W1, D1 - for timeframe MN. The color of the DPOC curve sections is determined by comparing the volume of the POC levels of all profiles that make u

O indicador calcula e traça automaticamente os níveis de suporte e resistência de Fibonacci - uma das ferramentas mais eficazes para análise de mercado. O cálculo usa os dados de preço médio para o período e intervalo de tempo selecionados. O mínimo e o máximo para este período são considerados o início e o fim do movimento. Os níveis de Fibonacci permitem que você veja os pontos de referência potenciais, em torno dos quais o movimento do preço pode desacelerar ou reverter, ou seja, eles são usa

Alert Stochastic plus delay and level Filter
A stochastic oscillator is a momentum indicator comparing a particular closing price of a security to a range of its prices over a certain period of time. We added many types of alerts plus the Level Cross Filter to aid in your search for better opportunities in the market. Product Features Sound alert Push Notification (Alerts can be sent to your mobile phone) Signs on chart Alert box Level Filter Delay Level Filter
Indicator Parameters K
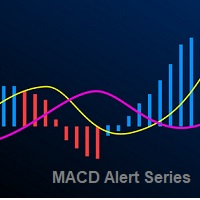
The Moving Average Convergence Divergence Indicator (MACD) is both a trend–seeking and momentum indicator which uses several exponential moving averages set to closing prices to generate trading signals. We added many types of alerts plus the Delay Cross Filter to aid in your search for better opportunities in the market.
Product Features Sound alert Push Notification (Alerts can be sent to your mobile phone) Signs on chart Alert box Alert on zero histogram cross or line sign cross. DelayCros
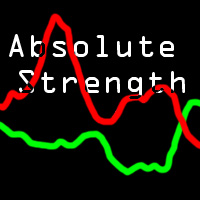
The Absolute Strength (AS) is intended to chart the current and historical gain or loss of an underlying based on the closing prices of a recent trading period. It is based on mathematical decorrelation. It shows absolute strength momentum.
This indicator is not measured on a scale like Relative Strength (RSI). Shorter or longer timeframes are used for alternately shorter or longer outlooks. Extreme high and low percentage values occur less frequently but indicate stronger momentum of the un

Este indicador é mais informativo. Seu trabalho é baseado na suposição de que o movimento de preços no mercado pode ser escrito como o barulho de uma cor que depende dos valores dos preços dos parâmetros de distribuição. Isso torna possível analisar a variação dos preços dos diferentes partidos, e considerando o movimento de preços como o som de uma determinada cor, você pode obter informações sobre a situação atual no mercado e fazer uma previsão sobre o comportamento dos preços. Na análise do

Apesar de algumas desvantagens do indicador “ AIS Color Noise Filter ”, a ideia de usá-lo para suavizar a série de preços e os preços previstos parece bastante atraente. Isso se deve a vários motivos: em primeiro lugar, tendo em conta vários componentes de ruído permite construir uma previsão sobre fatores independentes uns dos outros, o que pode melhorar a qualidade da previsão; em segundo lugar, as características de ruído da série de preços se comportam de maneira bastante estável ao longo d

Este é o indicador de Bandas Bollinger da Gekko. Ele amplia o uso das famosas bandas de bollinger e calcula sinais fortes de entrada e saída usando a ação do preço contra as bandas superior, inferior e do meio. Você pode configurá-lo de muitas maneiras diferentes, por exemplo: pullback, pullback contra a tendência, cruzamento da banda do meio, etc. Parâmetros de Entrada Number of Bars to Plot Indicator: número de barras históricas para plotar o indicador, mantenha baixo para melhor desempenho;

O indicador de Larry Wiliams chamado WillSpread considera a influência do ativo secundário (símbolo) no ativo atual (em negociação). A essência do indicador é transformar a correlação entre ativos dos dados do histórico acumulado, oferecendo uma oportunidade para detectar várias peculiaridades e padrões na dinâmica dos preços que são invisíveis a olho nu. Com base nessas informações, os traders podem assumir mais movimentos de preços e ajustar sua estratégia de acordo. Em poucas palavras, o Will
THRUST BAR ALERT!!!! THRUST BAR ALERT!!!
Now you dont have to worry about going through each currency pair, your favorite stocks watch list or crypto to find BIG CANDLES (also called THRUST BARS ). This indicator does everything for you.
This indicator has the capability to SCAN different CURRENCY PAIRS and TIMEFRAMES to give you BIG CANDLE (THRUST BAR) information through ALERT (MOBILE NOTIFICATION, EMAIL AND PUSH NOTIFICATION)
NOTE: If you are willing to scan more currency

Muitas vezes, no estudo das séries financeiras, aplica-se a suavização. Usando suavização, você pode remover componentes de alta freqüência - acredita-se que eles são causados por fatores aleatórios e, portanto, irrelevantes. A suavização sempre inclui alguma forma de calcular a média dos dados, na qual alterações aleatórias na série temporal se absorvem mutuamente. Na maioria das vezes, para esse propósito, métodos de média móvel simples ou ponderados são usados, assim como a suavização expo

Para isolar componentes de longo prazo e não aleatórios, é necessário saber não apenas quanto o preço mudou, mas também como essas mudanças ocorreram. Em outras palavras, estamos interessados não apenas nos valores dos níveis de preços, mas também na ordem em que esses níveis se substituem uns aos outros. Por meio dessa abordagem, é possível encontrar fatores estáveis e de longo prazo que influenciam (ou podem influenciar) a mudança de preço em um determinado ponto no tempo. E o conheciment

Posicionamento automático MIDAS, o indicador permite a colocação de dois MIDAS, cada um com 3 linhas que podem ser calculadas usando os preços Open / High / Low / Close / Mediano / Típico ou Ponderado, você pode anexar cada MIDAS as barras Open / High / Low ou Close de qualquer dia, incluindo o dia atual, uma vez anexado, se o preço desta barra mudar ou alterar o intervalo de tempo, o indicador fará o reposicionamento e o recálculo.
Você também pode fazer o reposicionamento manual dos dois M

This indicator represent option and basis values as a tax, using this formula: Tax = ( ( strike / ( basis - option ) ) - 1 ) * 100 It's not time based (don't use time to expire information) You can set a fixed strike value, and a fixed basis symbol if needed. Some exchanges/brokers don't provide this information at marketdata and that's the only method to use this information when not provided.

PINBAR SCANNER PRO with TREND and RSI + CCI OSCILLATORS filter This indicator has been designed to automatically and constantly scan entire market to find high probability pinbar formations, so you can just wait for the perfect trading opportunity come to you automatically.
PINBAR is the strongest candle reversal pattern known in technical analysis. It shows excellent areas to determine potential entries and exits with opportunity to use excellent risk and reward ratios. It includes an RSI an
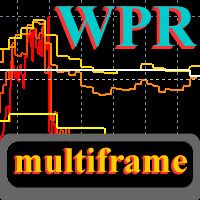
This is a multi-frame version of the standard indicator " Williams Percent Range ", that was previously available only for Mt4 . Now there is a version for Mt5 . Like the other indicators of the author, it allows you to see any set of timeframes at the same time, and all they will be presented on a scale of the current price chart. You can choose any set of timeframes of the indicator and freely switch to the price chart in both the highter and the lower direction. For each price period, indi

O indicador Volume OBV Average plota uma média (que pode ser ajustada) calculada sob o ON-BALANCE-VOLUME auxiliando na busca por melhores oportunidades nas operações de mercado. Funciona em qualquer tempo gráfico e instrumento.
Funcionalidades do produto EMA de volume plotada no gráfico Parâmetros do indicador VOL Ema - Ajusta a média que será plotada no gráfico.

Um dos métodos poderosos de análise é a modelagem de séries financeiras usando processos Levy. A principal vantagem desses processos é que eles podem ser usados para modelar um grande número de fenômenos - do mais simples ao mais complexo. É suficiente dizer que a idéia do movimento dos preços fractais no mercado é apenas um caso especial dos processos de Levy. Por outro lado, com a seleção adequada de parâmetros, qualquer processo Levy pode ser representado como uma média móvel simples. A Fi

Prezados amigos Este é um indicador que traz duas médias móveis configuráveis e que emitirá som e alerta, a depender da sua escolha, quando elas se cruzarem. Bastante útil para quem opera vários tempos ou ativos ao mesmo tempo. Com o indicador configurado ele o avisará onde ocorreu o cruzamento. Caso deseje algum indicador personalizado por favor entrar em contato.
Bons negócios

Description: The indicator of tick volumes Better Volume MT5 allows you to assess the general mood of the market and quite accurately catch the moments of the formation of large movements. The indicator is a color histogram in an additional window. In the calculation of Better Volume MT5 the Price Action combinations are taken into account, the values of the volumes with the height of columns and color marking are displayed. Input parameters: MAPeriod - period for calculating the moving average
PRICE BREAKOUT ALERT!!!! PRICE BREAKOUT ALERT!!!
Now you dont have to worry about going through each currency pair, your favorite stocks watch list or crypto to find breakouts. This indicator does everything for you.
This indicator has the capability to SCAN different CURRENCY PAIRS and TIMEFRAMES to give you breakout information through ALERT (MOBILE NOTIFICATION, EMAIL AND PUSH NOTIFICATION)
NOTE: If you are willing to scan more currency pairs along with many timeframes, you
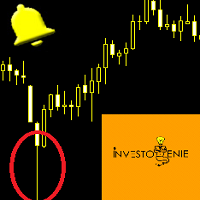
WICK BAR ALERT!!!! WICK BAR ALERT!!!
Now you dont have to worry about going through each currency pair, your favorite stocks watch list or crypto to find WICK BAR CANDLES (also called LONG TAIL BARS ). This indicator does everything for you.
This indicator has the capability to SCAN different CURRENCY PAIRS and TIMEFRAMES to give you LONG TAIL CANDLE (LONG WICK BAR) information through ALERT (MOBILE NOTIFICATION, EMAIL AND PUSH NOTIFICATION)
NOTE: If you are willing to

KEY LINKS: Indicator Manual – How to Install – Frequent Questions - All Products Description: Indicator which uses trend, breakout and reversal innovative indicators to show a complete visual trading strategy, with transparent metrics. It follows simple visual patterns, which will improve your trading significantly. Support: We create great tools for the entire trading community. Most of them are free. If you believe in what we do Support Us Here.
Outstanding Features Shows current
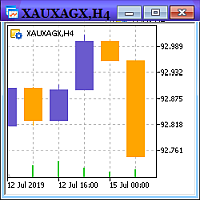
Индикатор CustomCrossIndexCreator позволяет создавать свой собственный пользовательский символ на основе истории двух любых финансовых инструментов как произведение этих двух индексов (кросс-индекс) и подкачивать его ценовую историю в виде минутных баров. Таким образом, в клиентском терминале Metatrader 5 появляется новый символ, с которым можно работать по аналогии с другими финансовыми инструментами, то есть открывать полноценные графики любого таймфрейма этого символа и проводить технически

Este é o indicador de Canais da Gekko. Ele amplia o uso dos famosos Canais e calcula sinais fortes de entrada e saída usando a ação do preço contra as linhas superior, inferior e do meio. Você pode configurá-lo de muitas maneiras diferentes, por exemplo: pullback, pullback contra a tendência, cruzamento da linha do meio, etc. Parâmetros de Entrada Number of Bars to Plot Indicator: número de barras históricas para plotar o indicador, mantenha baixo para melhor desempenho; Produces Signal Only W

The Hi Lo Breakout is taken from the concept of the ZZ Scalper EA which exploits the inevitable behaviour of price fluctuations and breakouts. The fact that because market prices will always fluctuate to higher highs before ebbing down to lower lows, breakouts will occur.
But here I've added a few more filters which I see work well also as an Indicator.
Range Analysis : When price is within a tight range this Indicator will be able to spot this and only then look for price breaks. Yo

Stochastic Reversal allows you to recognize reversals professionally. Stochastic Indicator: This technical indicator was developed by George Lane more than 50 years ago. The reason why this indicator survived for so many years is because it continues to show consistent signals even in these current times. The Stochastic indicator is a momentum indicator that shows you how strong or weak the current trend is. It helps you identify overbought and oversold market conditions within a trend. Rules
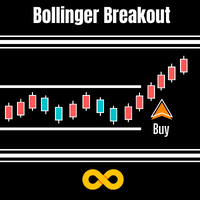
Bollinger Breakout Trader tells the trader when the market is about to breakout from a non-volatile period. Non volatility usually means its building up steam for more good moves in future. A signal is formed when this switch from non-volatile to volatile occurs. These periods are measured by both Bollinger Bands and Keltner Channels. Bollinger Bands measure the standard deviation of price from the Moving Average which results in an expanding and contracting channel. Keltner Channels are based

Muitas vezes, o comerciante é confrontado com a tarefa de determinar a medida em que o preço pode mudar no futuro próximo. Para este propósito, você pode usar o tipo de distribuição Johnson SB. A principal vantagem dessa distribuição é que ela pode ser usada mesmo com uma pequena quantidade de dados acumulados. A abordagem empírica usada na determinação dos parâmetros dessa distribuição permite determinar com precisão os níveis máximo e mínimo do canal de preço. Esses valores podem ser usados
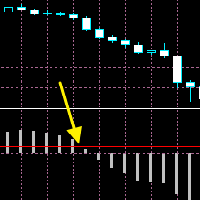
The moment when the MACD line crosses the signal line often leads to a significant price movement and trend changes. MACD Cross Prediction is an indicator that uses OSMA(MACD oscillator) and a red line. You can change the level of the red line on the indicator setting popup(and the red line moves up and down). The alerts(email, mobile push, sound, MT5 alert) will be sent when the MACD histogram touches the red line, which means the alerts can be sent just before/around the time when the MACD

Este é um indicador muito simples, porém eficaz, para negociar rompimentos de períodos variáveis de fractal. Um fractal é uma formação de preço de um número ímpar de barras, sendo a barra do meio o ponto de preço mais alto ou mais baixo da formação. Esses preços atuam como níveis de suporte e resistência de curto prazo, usados por esse indicador para desenhar um canal de preços e exibir rompimentos. [ Guia de instalação | Guia de atualização | Solução de problemas | FAQ | Todos os produtos ] Fá

Oscilador bem próximo que o indicador SANTO mostrado pelo Bo Williams em sua metodologia PhiCube, para mim este indicador ainda é melhor que o próprio SANTO original. Ótimo para entender a força e tendência de movimentos e possíveis divergências. Preço fazendo topo e o SANTO não renovando máxima, tudo indica que teremos uma reversão ou no mínimo um drawback.
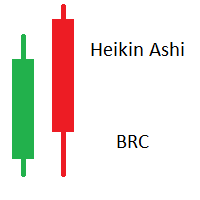
Heikin Ashi (HA) is a type of candlestick chart originated in Japan. The difference from traditional candlesticks is that HA bars are averaged, creating a smoother appearence. HA doesn't show the exact open and close price, they should be used as Technical Indicator and not as exact market prices. Calculation: HA Open = (Open of previous bar + Close of previous bar) / 2 HA Close = (Open + High + Low + Close) / 4 HA High = Highest of High, HA Open, or HA Close HA Low = Lowest of Low, HA Open, or

Индикатор Magneto Weekly Pro отображает: Недельные важные линии поддержки и сопротивления (выделены желтым, красным и синим цветами). Основные недельные цели (выделены белым цветом). Недельные паттерны возврата цены (обозначаются красными флажками). Применение индикатора Magneto Pro можно использовать и как дополнение к существующей стратегии, и как самодостаточную торговую стратегию. Данный продукт состоит из двух индикаторов, работающих на разных временных промежутках, и предназначен для скал

Moon 1 is a Box Break is a powerful indicator of Break Zone for any par and any timeframe. It doesn't requires any additional indicators for the trading setup.The indicator gives clear signals about opening and closing trades.This Indicator is a unique, high quality and affordable trading tool.
Perfect For New Traders And Expert Traders Low risk entries. Never repaints signal. Never backpaints signal. Never recalculates signal. For MT5 Only Great For Scalping Great For Swing Trading Arr
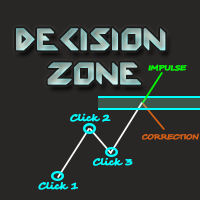
Decision Zone é um indicador que define zonas de decisão a partir de pivôs selecionados previamente. Nas zonas de decisão o usuário pode decidir com mais segurança se a onda que atingiu esta zona é de correção ou de impulso.
Os níveis das zonas foram baseados na expansão de Fibonacci junto as ondas de Elliot e em análises de casos.
Estratégia de negociação:
Basicamente, quando a onda do mercado atinge a zona de decisão no *Nível 1.0*, existe grande potencial dessa onda ser uma onda de imp

FZR indicator determines fractal zigzag reversal pattern of all the time frames of the chosen symbol and shows the information in the Info label. Indicator draws the detected pattern in the chosen time frame and also you can select in the menu to draw the trend line according to FZR peaks. What it is FZR? See the first picture in the screenshots. As you can see for every peak of FZR the AO indicator must cross zero line. FZR indicator determines the trend direction.
How to use FZR for trading?

The current Rise and Fall is judged from the Commodity Channel Index (CCI) of the three cycles and displayed in a panel by color coding.
The second and third of the three cycles are changed according to the correction factor multiplied by the first cycle (minimum cycle).
In addition, each CCI is displayed with ATR (Average True Range) corrected for variation.
When two of the three CCI are complete, Trend_1 is displayed.
When all three are complete, Trend_2 is displayed.
// ---

MOON 2 THE WALL is a Oscilator indicator. I s a powerful indicator of TREND for any par and any timeframe. It doesn't requires any additional indicators for the trading setup.The indicator gives clear signals about opening and closing trades.This Indicator is a unique, high quality and affordable trading tool.
Perfect For New Traders And Expert Traders Low risk entries. Never repaints signal. Never backpaints signal. Never recalculates signal. For MT5 Only Great For Scalping Great For Swi

Описание Данный индикатор строит (альтернативные, математически рассчитанные) уровни поддержки и сопротивления, а так же уровни, к которым с большой вероятностью придет цена в ближайшее время. Следует обратить внимание на то, что расчет уровней производится на исторических данных, и качество котировок играет важную роль при построении индикатором линий. Замечу, что отрисованные Magneto и Magneto Weekly линии не изменяют свои значения на всем расчетном периоде. Важное изменение! Добавлена функция

Pivot levels indicator shows 7(9 for Camarilla) pivot levels. It is adjusted for major use, including: all standard time frames
choice of periods to show four popular calculation formulas (typical, median, weighted and Camarilla)
pivot day shift choice of properties for lines and labels choice of showing alerts when crossing pivot lines Parameters: ----------Main parameters----------- Timeframe - time frame for pivot levels
Number of periods to show - displays pivot levels for number of perio

KT MACD Divergence shows the regular and hidden divergences build between the price and oscillator. If your trading strategy anticipates the trend reversal, you can include the MACD regular divergence to speculate the potential turning points. And if your trading strategy based on the trend continuation, MACD hidden divergence would be a good fit.
Limitations of KT MACD Divergence
Using the macd divergence as a standalone entry signal can be a risky affair. Every divergence can't be interpr

O Indicador 3 Automatic Vwap (Midas) pode ser usado para quem estuda Preço e Volume para mapear o movimento de quem direciona o mercado. Ele plota automaticamente 3 Vwaps sendo que duas delas são dinâmicas e vão sendo atualizadas no decorrer do dia, se novas máximas ou novas mínimas surgirem. A terceira Vwap é diária e pode ajudar se a tendência é de alta ou baixa.
Ainda, foi inserido um indicador auxiliar que plota pontos de interesse (também dinâmicos) com os preços OHLC (Open, High e Low do

Este indicador permite determinar a probabilidade de o preço atingir um ou outro nível. Seu algoritmo é bastante simples e baseia-se no uso de dados estatísticos nos níveis de preços de um par de moedas específico. Graças aos dados históricos coletados, é possível determinar até que ponto o preço será alterado durante a barra atual. Apesar de sua simplicidade, este indicador pode fornecer assistência inestimável na negociação. Assim, com sua ajuda, é possível determinar os níveis TakeProfit e S
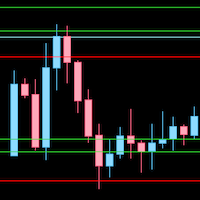
Desenha níveis de suporte e resistência baseado nas altas/baixas ou fechamento do diário, semanal ou mensal. Este indicador utiliza as altas, baixas ou fechamentos para desenhar linhas horizontais no gráfico. Ao observar essas linhas você pode identificar tendência (ganhando ou perdendo níveis de suporte/resistência) e encontrar bons níveis de entrada para seus trades. Para traders que utilizam price action como método, esse indicador é essencial.

Moon 3 is a Trend indicator. I s a powerful indicator of TREND for any par and any timeframe. It doesn't requires any additional indicators for the trading setup.The indicator gives clear signals about opening and closing trades.This Indicator is a unique, high quality and affordable trading tool.
Perfect For New Traders And Expert Traders Low risk entries. Never repaints signal. Never backpaints signal. Never recalculates signal. For MT5 Only Great For Scalping Great For Swing Trading Arro
O mercado MetaTrader é um espaço, sem precedentes, para negociar robôs e indicadores técnicos.
Leia o artigo Manual do usuário da MQL5.community para saber mais sobre os serviços exclusivos que oferecemos aos traders: cópia de sinais de negociação, aplicativos personalizados desenvolvidos por freelances, pagamentos automáticos através de sistema de pagamento e a rede em nuvem MQL5.
Você está perdendo oportunidades de negociação:
- Aplicativos de negociação gratuitos
- 8 000+ sinais para cópia
- Notícias econômicas para análise dos mercados financeiros
Registro
Login
Se você não tem uma conta, por favor registre-se
Para login e uso do site MQL5.com, você deve ativar o uso de cookies.
Ative esta opção no seu navegador, caso contrário você não poderá fazer login.