Assista a como encomendar um robô de negociação
Leia as Regras antes começar a trabalhar
Como Encomendar um Robô de Negociação em MQL5 e MQL4
Consulte o exemplo de Termos de Referência para solicitar um robô
Novo na categoria:
30+ USD
30+ USD
30+ USD
40+ USD
30 - 200 USD
30+ USD
Trabalho concluído
Tempo de execução 48 segundos
Comentário do cliente
Great developer. Thanks.
Termos de Referência
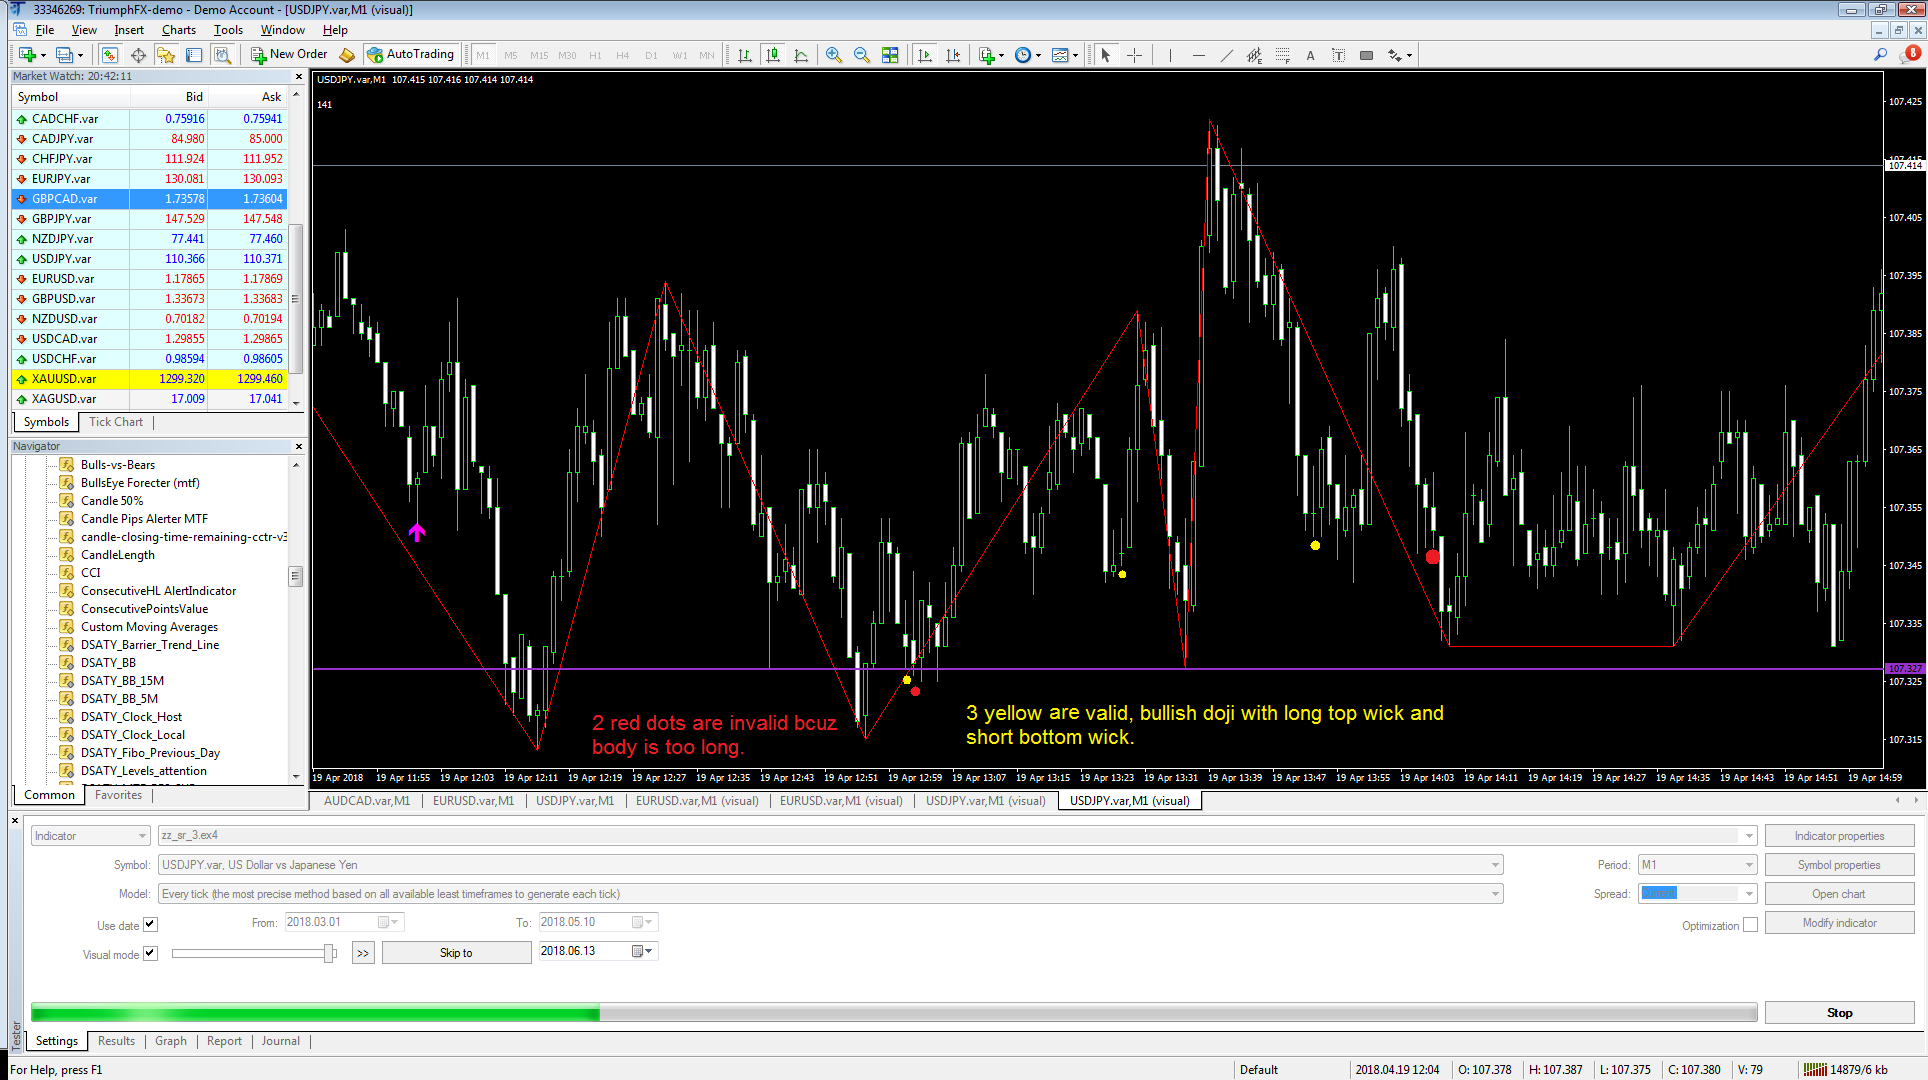
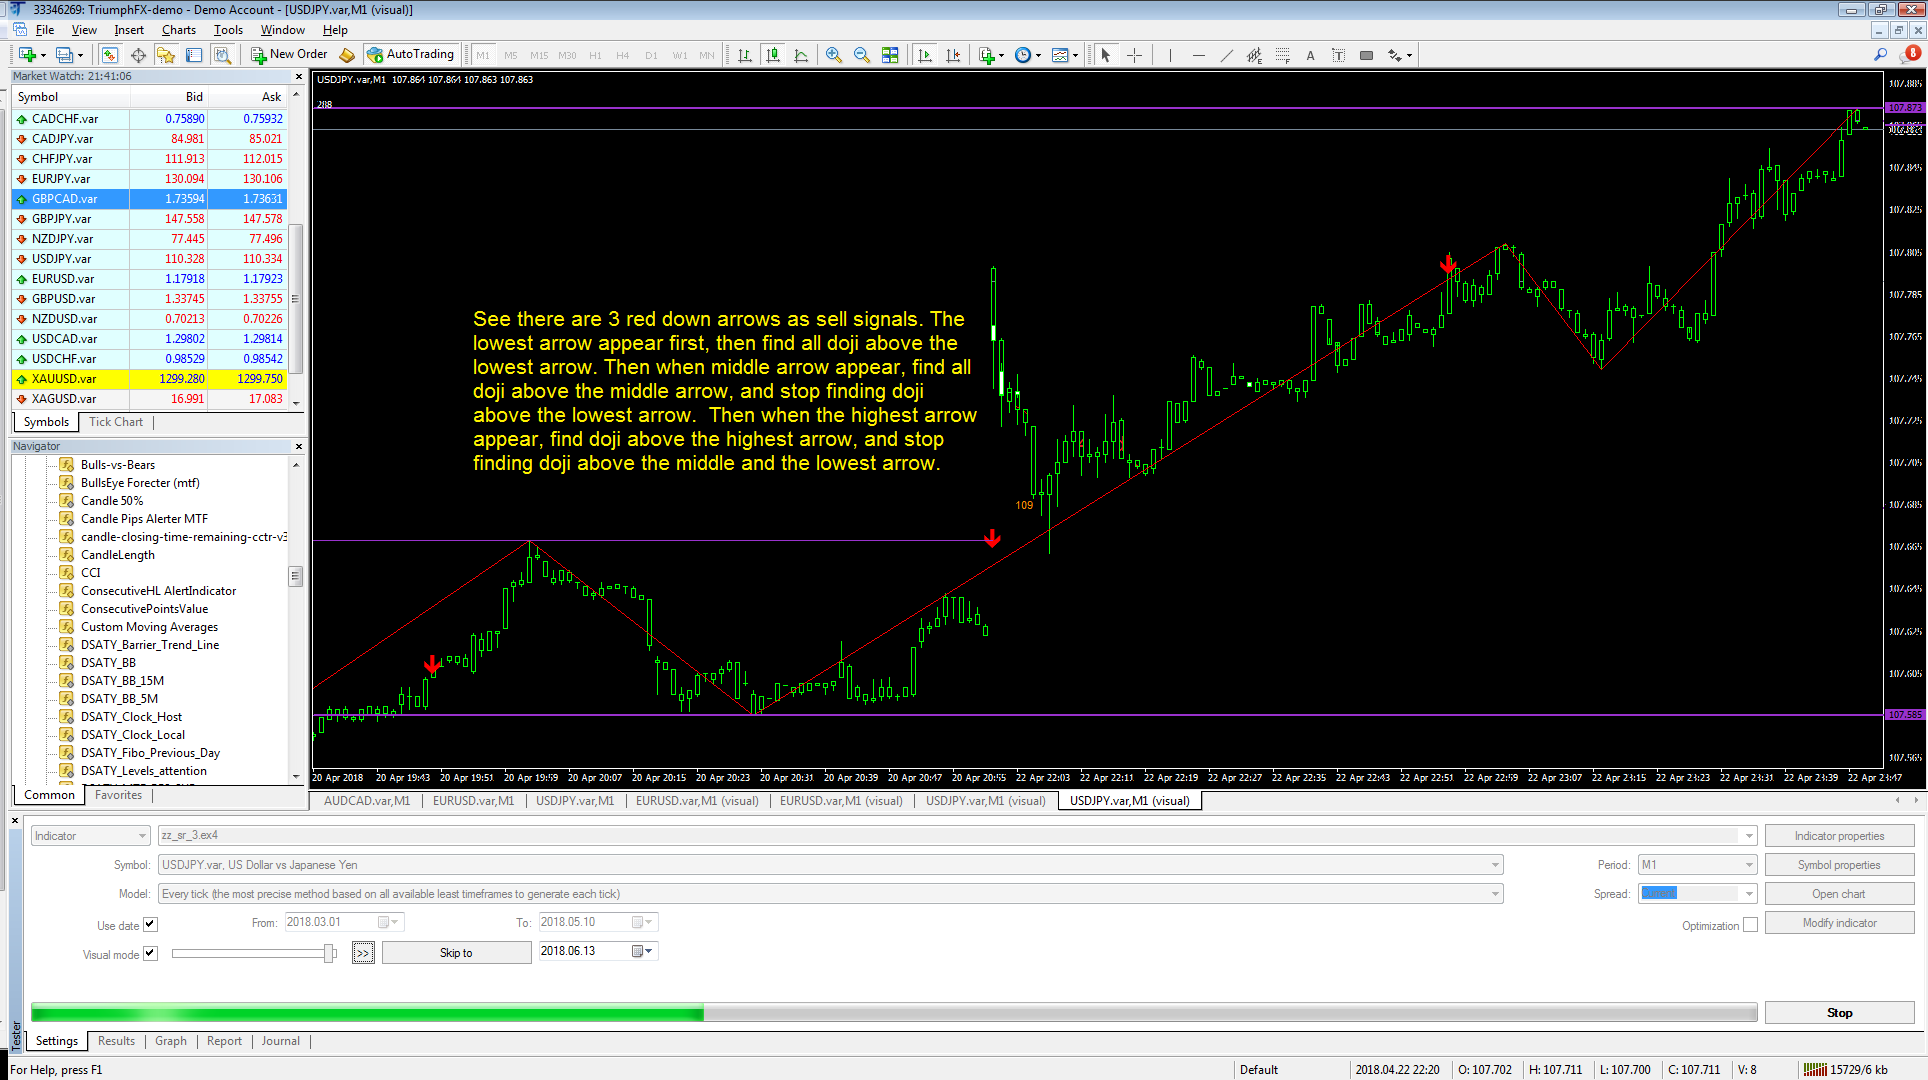
My old indicator show red down arrow as sell signal when price reach previous zigzag higher turning point.
show pink up arrow as buy signal when price reach previous zigzag lower turning point.
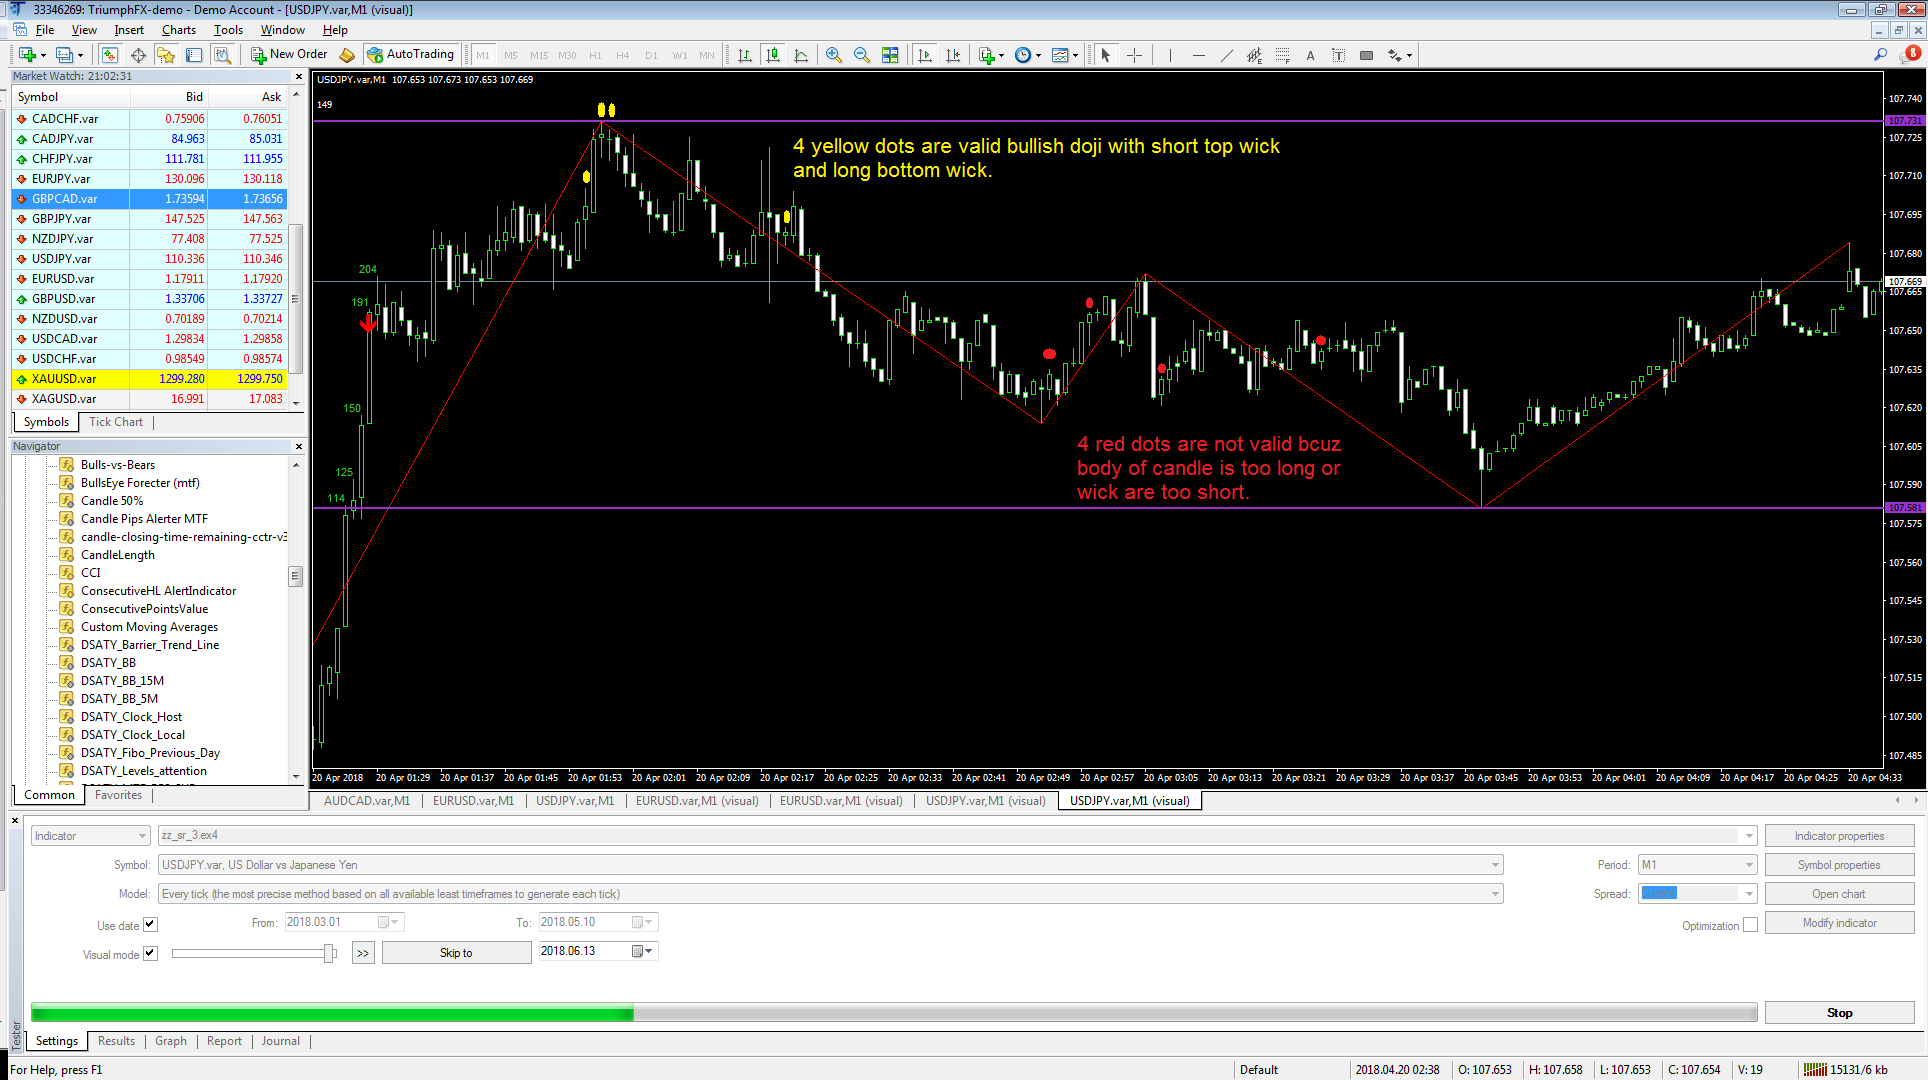
I need to hire a developer to modify this old indicator to add a new function : find all bullish doji candles above the price of sell signal arrow, and find all bearish doji candles below the price of buy signal arrow.
Just draw a circle on the doji candle, and pop up alert like "usdjpy Doji".
Hope can complete in 1 day.
Respondido
1
Classificação
Projetos
118
17%
Arbitragem
44
23%
/
39%
Expirado
20
17%
Livre
2
Classificação
Projetos
149
31%
Arbitragem
32
34%
/
41%
Expirado
43
29%
Livre
3
Classificação
Projetos
369
66%
Arbitragem
10
50%
/
0%
Expirado
46
12%
Livre
4
Classificação
Projetos
507
40%
Arbitragem
159
17%
/
74%
Expirado
99
20%
Carregado
5
Classificação
Projetos
154
47%
Arbitragem
2
0%
/
50%
Expirado
4
3%
Livre
6
Classificação
Projetos
744
56%
Arbitragem
48
31%
/
31%
Expirado
120
16%
Livre
Publicou: 1 código
7
Classificação
Projetos
204
30%
Arbitragem
25
40%
/
44%
Expirado
12
6%
Livre
8
Classificação
Projetos
1462
63%
Arbitragem
21
57%
/
10%
Expirado
43
3%
Livre
9
Classificação
Projetos
0
0%
Arbitragem
0
Expirado
0
Livre
10
Classificação
Projetos
146
34%
Arbitragem
13
8%
/
62%
Expirado
26
18%
Livre
Publicou: 6 códigos
Pedidos semelhantes
Indicator CRT Arrows
30 - 50 USD
I want signal being generated using Candle Range Theory on the higher time frames to the lower time frames as arrows. The arrows should also be visible on the lower time frame as my entry
I’m looking for an experienced MT4 developer to create a custom indicator (or EA) with mobile push notifications based on the following strategy. Trend Filter (Daily Timeframe) Daily Close above 50 EMA = Bullish Bias Daily Close below 50 EMA = Bearish Bias Entry Timeframe (H1) RSI Settings RSI Period: 14 (default) Upper Level: 65 Lower Level: 35 Buy Signal Generate a BUY signal when: Daily bias is Bullish (Daily
Hello, I'm looking for EA or indicator that would help me reach at least 0.5 lot daily on XAUUSD pair. I trade with 30-35 spread on live standard account. 0.3 to 0.5 lot on XAUUSD is all i need per day, without losing too much money during week or month doing that. Every advice od product is welcome. tg @stellarcptadmin
Tradingview Script to EA
30+ USD
✅ MT4 EA Developer Checklist (For Your Ladder EA) 1️⃣ Indicator Integration EA reads signals from provided custom indicator (.ex4 or .mq4) Detects “Buy Next” / “Sell Next” signals on current candle Works with arrow-based or buffer-based signals 2️⃣ Next Candle Execution EA does not trade on the candle where the signal appears Orders placed only at first tick of the next candle Timeframes supported: M1, M5, M15
PROFITABLE AI BOTS FOR MT5 AND CTRADER
100 - 200 USD
Hello, i need expert developer that have been develop so many profitable AI bots that work for mt5 and ctrader autonomously if you know you can easily execute this requirement bid for it. NOTE:- YOU MUST COME WITH SAMPLE FOR THE 2 TRADING PLATFORM. While i take a look at your profile and reach out to you thanks
I am looking for an experienced MT4/MT5 developer to analyze my trading history and replicate the strategy in a new Expert Advisor (EA). The developer must have proven experience in reverse engineering strategies, analyzing trading data, and developing EAs across various trading methodologies. A deep understanding of XAUUDS and BTCUSD behavior, as well as chart analysis, is essential. Please note that we do not have
Ea.Mix
30+ USD
I am in need of a good scalping bot for gold or any currency pair. If you have one that is working, reach out. You must be able to provide a trial version so I can test the bot myself
Trading View Indicator
50+ USD
i have built a indicator on trading view which is veryt good, its based on liquidity sweeps on stop losses. im looking for an someone with experience in trading and indicators that has worked on similar strategy indicators. it already wins lots of very good trades im looking to tighten up on uneccesary trades it may send to clean it up as i currently am testing it out running to signal channel and want it the best /
Generate a signal and place 2 arrows on the chart when these conditions happen. Rules: Levels up:price is below the Kijunsen and Senku A value is less than Senku B value Kijun sen close = previous kijun sen close; Kijun sen close value is LESS than Senku B close value Senkou B close = previous senku B close. Levels down: price is above Kijunsen. Senku A value is above Senku B value
ZigZag based on oscillators is needed The idea of the indicator Create a ZigZag indicator, which is constructed based on extreme values determined using oscillators. It can use any classical normalized oscillator, which has overbought and oversold zones. The algorithm should first be executed with the WPR indicator, then similarly add the possibility to draw a zigzag using the following indicators: CCI Chaikin RSI
Informações sobre o projeto
Orçamento
30+ USD
Prazo
para 1 dias