Trabajo finalizado
Plazo de ejecución 48 segundos
Comentario del Cliente
Great developer. Thanks.
Tarea técnica
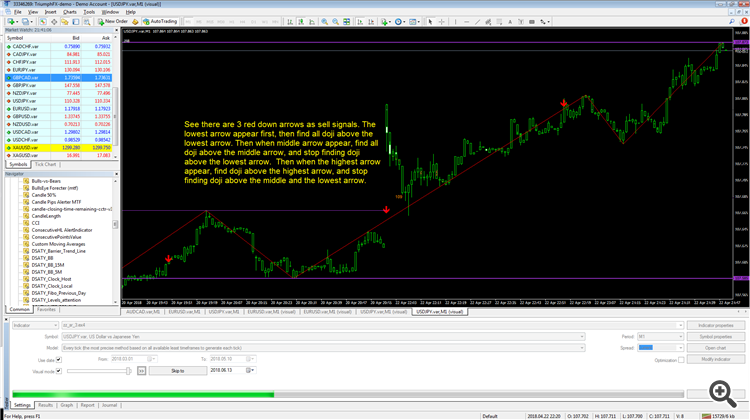
My old indicator show red down arrow as sell signal when price reach previous zigzag higher turning point.
show pink up arrow as buy signal when price reach previous zigzag lower turning point.
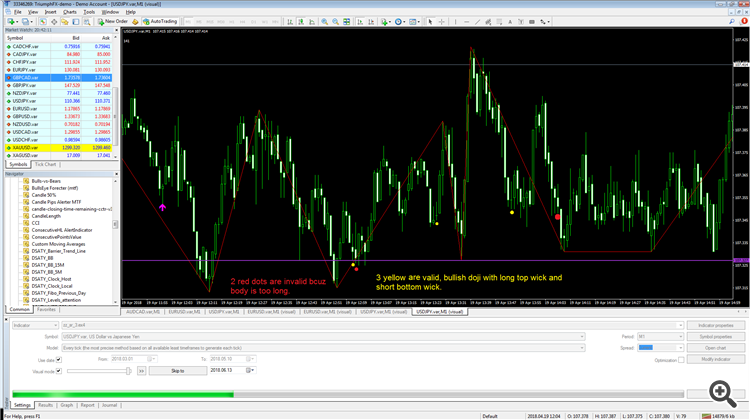
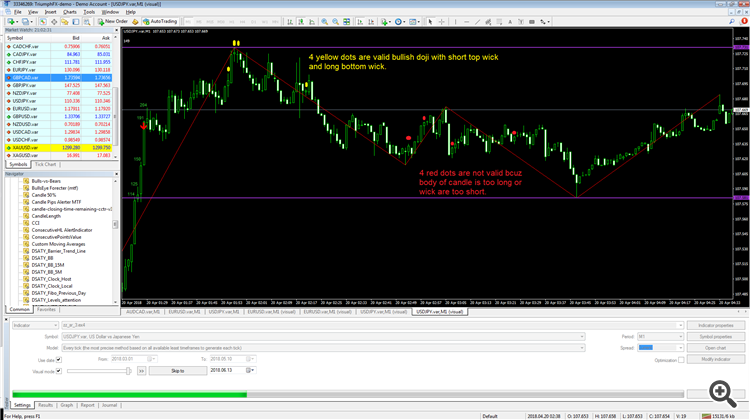
I need to hire a developer to modify this old indicator to add a new function : find all bullish doji candles above the price of sell signal arrow, and find all bearish doji candles below the price of buy signal arrow.
Just draw a circle on the doji candle, and pop up alert like "usdjpy Doji".
Hope can complete in 1 day.
Han respondido
1
Evaluación
Proyectos
118
17%
Arbitraje
44
23%
/
39%
Caducado
20
17%
Libre
2
Evaluación
Proyectos
149
31%
Arbitraje
32
34%
/
41%
Caducado
43
29%
Libre
3
Evaluación
Proyectos
369
66%
Arbitraje
10
50%
/
0%
Caducado
46
12%
Libre
4
Evaluación
Proyectos
506
40%
Arbitraje
147
18%
/
72%
Caducado
99
20%
Trabajando
5
Evaluación
Proyectos
154
47%
Arbitraje
2
0%
/
50%
Caducado
4
3%
Libre
6
Evaluación
Proyectos
703
56%
Arbitraje
45
29%
/
31%
Caducado
115
16%
Trabaja
7
Evaluación
Proyectos
204
30%
Arbitraje
25
40%
/
44%
Caducado
12
6%
Libre
8
Evaluación
Proyectos
1436
62%
Arbitraje
21
57%
/
10%
Caducado
43
3%
Libre
9
Evaluación
Proyectos
0
0%
Arbitraje
0
Caducado
0
Libre
10
Evaluación
Proyectos
143
34%
Arbitraje
10
10%
/
60%
Caducado
26
18%
Libre
Solicitudes similares
Code mt4 ea with tradingview indicators sript
50 - 60 USD
I have list of free indicators in tradingview and i would like to convert them into an mt4 ea, But the EA will have and work based on the indicators features The list of the are listed as follows :> 1. Market Structure Break And Order block. By EmreKb 2. Rainbow Adaptive RSI by LuxAlgo 3. Multiple MA (21,50,100) 4. SuperTrend Please don't apply if can't do this, So we won't ourselves time
Source code for indicator
30+ USD
good day i have an indicator but need the source for this reason The indicator only work on a single Time frame open trade, and close with only a single TF i will like the indicator work on multiple time frame just like other installed indicator My coder said the reason it cannot work like other indicator installed is because it has no buffer First confirm if you have the source code because its a popular indicator
Hello! I am looking for an experienced Pine Script coder to create a custom indicator for mapping market structure based on fractals. The developer must be skilled in Pine Script and have a solid understanding of how to code market structure indicators. Looking forward to working with a talented developer
Hello developers, I would like to hire someone can convert the Radar Signal indicator: https://www.youtube.com/watch?v=5DmKcy7rb-U  ; to it's TradingView equivalent. Radar signal indicator is the combination of 7 classic MT4 indicators. They include ADX, RSI , CCI , OsMA, ATR, WPR. The indicator shows the values of these indicators in blue and red. Red color indicates a bearish market condition and the blue shows
Hi , i want a indicator that shows the trades history on the chart, just for current day, like : first trade : -54 Second trade : -52 Third trade : +126 , and after three trades, display "No more trades"
AngelShark system
30+ USD
Hello i need someone who can convert a trading view indicator into an mt5 indicator that can work smoothly also need to add an alert on the indicator i will require to test the indicator run it for 1-2days to confirm all is okay thank you
Here's a clearer step-by-step guide to checking the last 50 candles on your chart and applying Fibonacci retracement levels based on their colors: Identify Candle Color: Start from the 100th candle from the left on the chart and check its color. If the 100th candle is green (i.e., the close is higher than the open): Draw a Fibonacci Retracement: From the highest price to the lowest price of this candle. Check the
Here's a clearer step-by-step guide to checking the last 50 candles on your chart and applying Fibonacci retracement levels based on their colors: Identify Candle Color: Start from the 100th candle from the left on the chart and check its color. If the 100th candle is green (i.e., the close is higher than the open): Draw a Fibonacci Retracement: From the highest price to the lowest price of this candle. Check the
I have an equity reporter. This equity reporter displays the maximum and minimum equity reached over a specific interval. So, if the interval is set to 24 hours, the script will generate data in the format: "Profit ATT" (profit AtThatTime) shows max./min. during the specific interval This specific report shows data in pips. It can also be set to display in price or percentages. The interval is also easily adjustable
I want you to make me an indicator in Training View. Its idea is very simple, and I want it to have an alarm. Here's a clearer step-by-step guide to checking the last 50 candles on your chart and applying Fibonacci retracement levels based on their colors: Identify Candle Color: Start from the 100th candle from the left on the chart and check its color. If the 100th candle is green (i.e., the close is higher than the
Información sobre el proyecto
Presupuesto
30+ USD
Para el ejecutor
27
USD
Plazo límite de ejecución
a 1 día(s)


