Multiple Horizontal (support-resistance) line upload indicator-tool from excel spreadsheet

MQL4 Indicadores Integração

Trabalho concluído

Tempo de execução 36 dias

Termos de Referência

Hey,

I  think I have an easy task for you guys.

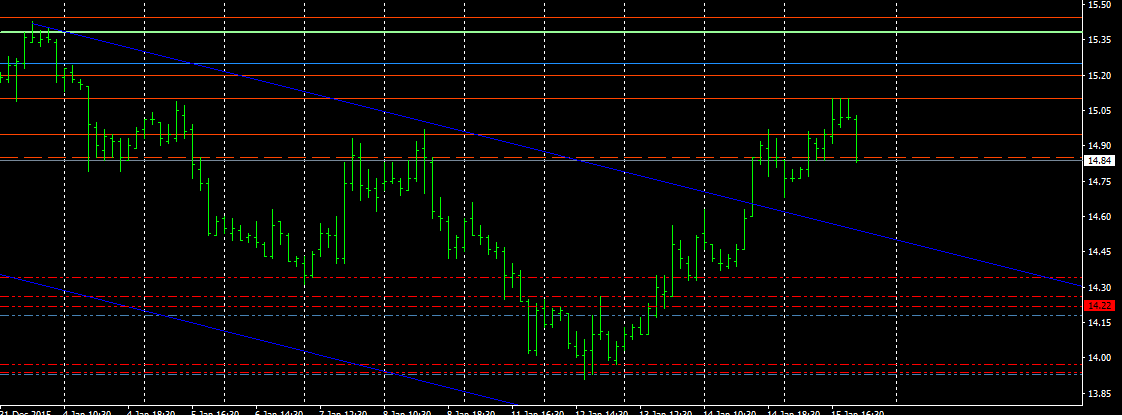
There is a need for an indicator which could draw multiple horizontal price lines (support and resistance lines) on the chart uploaded from an excel spreadsheet template.

Support prices will be classified into

two Main groups:

o   Bullish   

o   Bearish

five sub-groups:

1.       Yearly

2.       Quarterly

3.       Monthly

4.       weekly

5.       daily

And can have features(description):

A.      2

B.      Major

C.      Major2

D.      Major3

E.       Double

Excel template which will be used for upload, will have 4 different columns with support prices. Example:

Price

Timeframe

Bullish or bearish

Description

14.95

 monthly

Bearish

Double

15.1 

weekly

Bearish

Major

15.2 

daily

Bearish

Major

15.45 

daily

Bullish


15.62

  weekly

Bullish

Major2

15.89

  monthly

Bullish

2

15.99 

Quarterly

Bullish

Major3

16.08  

Yearly

Bullish


*Price is the actual price at which horizontal line should be drawn.

Transferring excel template values to horizontal lines on MT4:

* A1,B1,C1,D1 are column names so referencing should start from A2,B2,C2,D2 boxes.

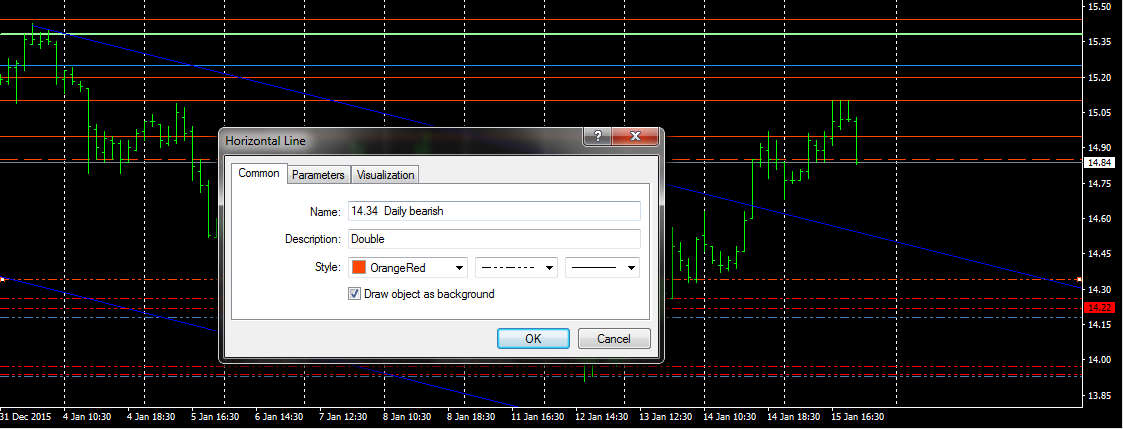
*Price, Timeframe and Status (bullish and bearish) should fill the "line name" text box space in MT4

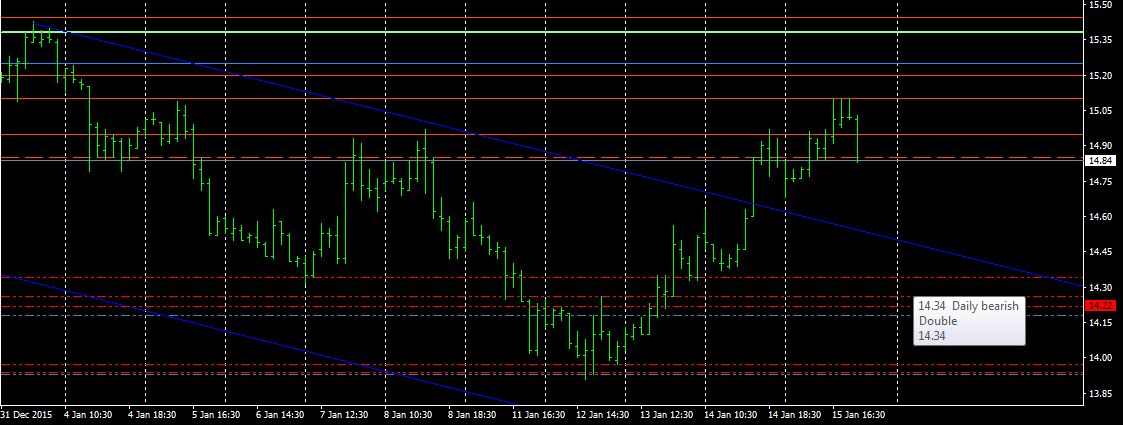
*"Line description" should have the same text  as "Description" value of the excel spreadsheet. If there is no text, then there is no extra text in this box. (attaching screenshot)

Requirements for upload and adjustments:

When uploading support prices from template I want have 10 tick boxes to enable/disable prices and choose [line colors] and styles [dashed,pointed...] for these groups:


daily

Bearish

6

 daily

Bullish

2

 weekly

Bearish

7

 weekly

Bullish

3

 monthly

Bearish

8

 monthly

Bullish

4

 quarterly

Bearish

9

 quarterly

Bullish

5

 yearly

Bearish

10

 yearly

Bullish


[ On default all groups should be enabled]


Also I want to be able to choose [line width] based on "description" column value, for each one out of 6 different groups:

No value

|     2

      Major

    Major2

    Major3

    Double


[on default it should be thinnest to thickest, Left to Right]


When uploaded, I don't want to see any price tags for these price lines on the chart.

[on default draw object on background function should be enabled]


That's basically good for start, later I would ask for more work, but that's most important.

Appreciate people with skills and always give more work for the same person who can deliver more than I expect ;)

Thank you!
Respondido

1
Desenvolvedor 1
Classificação
(2)
Projetos
2
0%
Arbitragem
13
8% / 92%
Expirado
1
50%
Livre
2
Desenvolvedor 2
Classificação
(271)
Projetos
553
50%
Arbitragem
57
40% / 37%
Expirado
227
41%
Trabalhando
3
Desenvolvedor 3
Classificação
(564)
Projetos
845
73%
Arbitragem
15
53% / 13%
Expirado
193
23%
Livre
4
Desenvolvedor 4
Classificação
(46)
Projetos
73
16%
Arbitragem
13
8% / 92%
Expirado
37
51%
Livre
5
Desenvolvedor 5
Classificação
(219)
Projetos
370
42%
Arbitragem
145
17% / 41%
Expirado
124
34%
Livre
Publicou: 38 códigos
Pedidos semelhantes
Hello looking for someone to convert an indicator from tradingview to Thinkorswim I have attached the codes from trading view Also, I like make it trigger (alert) a one-time alert when the trend changes, and can also create a custom watchlist column that flags symbols currently in a new trend so you can scan multiple stocks easily. And like the watchlist to show only fresh trend changes or the current trend direction
Version document : 1.0 Plateforme : TradingView Langage : Pine Script v6 Type : Indicateur d'analyse et d'aide à la décision (non-exécutant) 1. Présentation du projet Nom du produit ONYX SR V2 — Intelligent Support & Resistance Scalping System Objectif Créer un indicateur TradingView capable d'identifier automatiquement des opportunités de scalping basées sur : supports et résistances dynamiques ; action du prix ;
I have a EA/indicator that I want built. I should say 1st off dont know how to code myself so I will be using AI to verify that the source code is complete and matches the documents spec or if better so if you can not truly do the job do not waste either of out time. This is a idea I came.up wit and used AI to produce a framework for it.... and of course AI isn't 100% accurate so I need a knowledgeable quantitative
TumiiFX 30 - 20000 USD
1. Use two EMAs: 20 and 50. If EMA 20 is above EMA 50 → uptrend (look for buys) If EMA 20 is below EMA 50 → downtrend (look for sells) 2. Wait for a pullback into the area between the two EMAs. - For buys: price must touch or move between EMA 20 and EMA 50 during the last few candles. - For stils: same idea, but in a downtrend. 3. Entry signal: Buy: a bullish engulfing candle in an uptrend after the pullback
I am looking for an experienced MQL4 developer to build a professional High-Frequency Trading (HFT) / Low-Latency Expert Advisor for MetaTrader 4 (MT4) . The EA will be deployed on an IC Markets Live account and should be optimized for the fastest possible execution using a low-latency VPS located in LD4 or NY4 . The primary instruments will be US30 and XAUUSD (Gold) . The goal is to create an EA capable of
A robot 50+ USD
HIGH-FREQUENCY M5/M15 CONCURRENT ENTRY SNIPER import time class HighFrequencySniper: def __init__(self): self.target_profit = 25.00 # Targeted Delta Move self.max_execution_time = 3600 # 1 Hour Sandbox (Seconds) self.lot_allocation = "CALIBRATED_TO_RISK" def execute_hft_scan(self, current_price, m5_rsi, m15_order_block): print(f"[SCANNING] Current Kernel Metric: ${current_price:.2f
I need a trading bot, please i need this project urgently and when messaing me kindly send me samples of past works and dont forget i need the project to be done as soon as possible
A lightweight MT5 chart overlay displaying total floating P&L, average entry price, combined lot size, and current symbol exposure as a percentage of account balance, all updating in real time with color-coded profit/loss indicators, delivered with clean object-oriented source code and no DLL dependencies
QUIERO CONSEGUIR EL CODIGO FUENTE DE ESTE INDICADOR QUE ME GUSTA MUCHO TAMBIEN TIENE EL NOMBRE DE ET BANDS O ENTRY EXIT TIMING . no se los componentes pero estas son las imagenes. que mejor lo describen
I am looking to convert my existing TradingView Pine Script (v5) strategy into an MQL5 Expert Advisor (EA) for MetaTrader 5. Strategy Details: Asset: Gold (XAUUSD) Timeframe: 15-minute Strategy Logic: The strategy is based on a breakout concept. Anchor Candle: The base calculation starts from the Specified Candle Entry Window: The EA should only look for entries As Per Indicator Risk Management: The strategy

Informações sobre o projeto

Orçamento
30 - 70 USD
Prazo
de 1 para 10 dias