Multiple Horizontal (support-resistance) line upload indicator-tool from excel spreadsheet

MQL4 インディケータ 統合

仕事が完了した

実行時間36 日

指定

Hey,

I  think I have an easy task for you guys.

There is a need for an indicator which could draw multiple horizontal price lines (support and resistance lines) on the chart uploaded from an excel spreadsheet template.

Support prices will be classified into

two Main groups:

o   Bullish   

o   Bearish

five sub-groups:

1.       Yearly

2.       Quarterly

3.       Monthly

4.       weekly

5.       daily

And can have features(description):

A.      2

B.      Major

C.      Major2

D.      Major3

E.       Double

Excel template which will be used for upload, will have 4 different columns with support prices. Example:

Price

Timeframe

Bullish or bearish

Description

14.95

 monthly

Bearish

Double

15.1 

weekly

Bearish

Major

15.2 

daily

Bearish

Major

15.45 

daily

Bullish


15.62

  weekly

Bullish

Major2

15.89

  monthly

Bullish

2

15.99 

Quarterly

Bullish

Major3

16.08  

Yearly

Bullish


*Price is the actual price at which horizontal line should be drawn.

Transferring excel template values to horizontal lines on MT4:

* A1,B1,C1,D1 are column names so referencing should start from A2,B2,C2,D2 boxes.

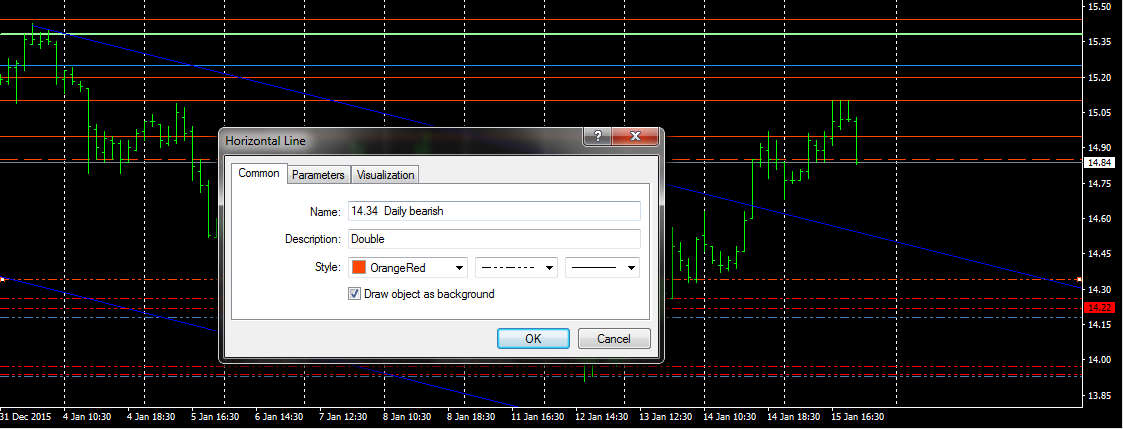
*Price, Timeframe and Status (bullish and bearish) should fill the "line name" text box space in MT4

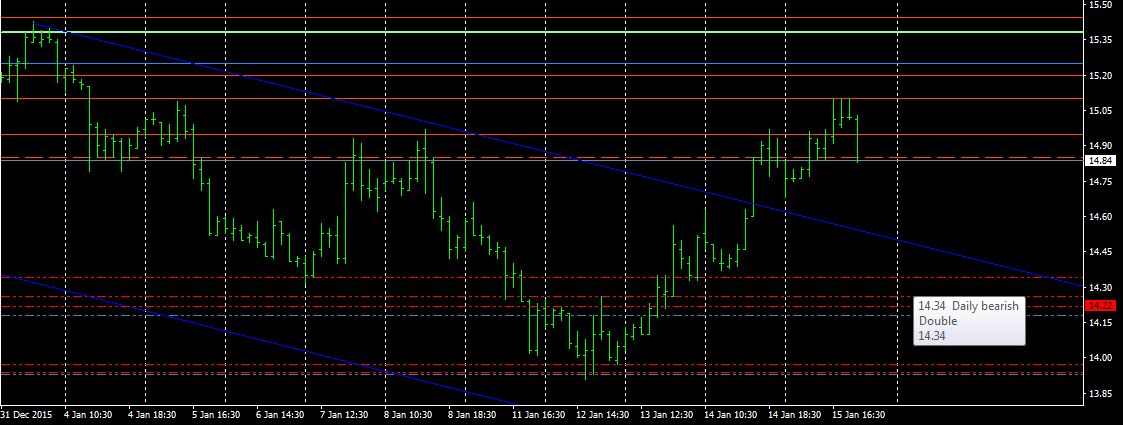
*"Line description" should have the same text  as "Description" value of the excel spreadsheet. If there is no text, then there is no extra text in this box. (attaching screenshot)

Requirements for upload and adjustments:

When uploading support prices from template I want have 10 tick boxes to enable/disable prices and choose [line colors] and styles [dashed,pointed...] for these groups:


daily

Bearish

6

 daily

Bullish

2

 weekly

Bearish

7

 weekly

Bullish

3

 monthly

Bearish

8

 monthly

Bullish

4

 quarterly

Bearish

9

 quarterly

Bullish

5

 yearly

Bearish

10

 yearly

Bullish


[ On default all groups should be enabled]


Also I want to be able to choose [line width] based on "description" column value, for each one out of 6 different groups:

No value

|     2

      Major

    Major2

    Major3

    Double


[on default it should be thinnest to thickest, Left to Right]


When uploaded, I don't want to see any price tags for these price lines on the chart.

[on default draw object on background function should be enabled]


That's basically good for start, later I would ask for more work, but that's most important.

Appreciate people with skills and always give more work for the same person who can deliver more than I expect ;)

Thank you!
応答済み

1
開発者 1
評価
(2)
プロジェクト
2
0%
仲裁
13
8% / 92%
期限切れ
1
50%
2
開発者 2
評価
(271)
プロジェクト
553
50%
仲裁
57
40% / 37%
期限切れ
227
41%
仕事中
3
開発者 3
評価
(564)
プロジェクト
845
73%
仲裁
15
53% / 13%
期限切れ
193
23%
4
開発者 4
評価
(46)
プロジェクト
73
16%
仲裁
13
8% / 92%
期限切れ
37
51%
5
開発者 5
評価
(219)
プロジェクト
370
42%
仲裁
145
17% / 41%
期限切れ
124
34%
パブリッシュした人: 38 codes
類似した注文
Monthly Report: August 2026 World PEACE Multi FX Algo generated a total realized profit of approximately 31,966 JPY during August. The provider account is normally operated with approximately 200,000 JPY of capital. Compared with this standard operating amount, the realized profit for August was approximately 15.98%. Please note that this is not a compounded monthly return. Realized profits are withdrawn regularly
Is there anyone with an indicator that give signal after head and shoulder pattern is formed in Volatility indices? The indicator will wait for the second shoulder to be formed before giving an arrow of buy or sell
Hi, I want to develop a highly accurate, custom technical indicator for MetaTrader 5 (MT5) specifically tailored for 1-minute Binary Options trading (Quotex). I do NOT need an automated trading bot. I only need visual buy/sell arrows on the chart, an advanced alert system, and an on-chart performance statistics dashboard. The indicator must be 100% non-repainting. --- 1. STRATEGY CONFLUENCE LOGIC The indicator should
Create a bot that can trade and read indicators easy to read for first time users. Bot that can be used on a phone and connect to MT5. It should be easy to install or use on any device especially phone and laptop, preferably the bot that can run over night and controllable when needed
These are orderflow footprint indicator I would like to know if you can algorithmisie and build a stacked imbalance bot from them .. Kindlt let me know if you can do it and check the file before replying me
I have 2 trading view indicators by GainzAlgo that I want code to mt5 , could u advise? I need you to give me response if you can convert This
I DO NOT need any programming or strategy development. I already have a working NinjaTrader 8 automated strategy based on a 3/5 EMA crossover. I need you to run my existing strategy through NinjaTrader Strategy Analyzer/Optimizer, test the existing adjustable parameters, and find robust settings with the best profit factor and lowest reasonable drawdown. I will provide the existing NinjaScript ZIP. I do not want the
Platform: TradingView Programming Language: Pine Script v6 Type: Custom Indicator Project Name: Scalping Reaction Zones + Valid Order Blocks MAIN GOAL I need a custom TradingView indicator for scalping. The indicator must detect: 1. Reaction / Explosion Zones 2. Valid Order Blocks 3. Combined Reaction Zone + Order Block zones The indicator should NOT generate: Buy signals Sell signals TP SL Entry signals Trading
Project Description I am looking for an experienced MQL5/MT5 Expert Advisor developer to develop an automated trading EA for XAUUSD on the M3 timeframe , running on an Exness account . The EA will automate a manual strategy based on SNR/GAP zones , using two setup types: Price Rejection Price Correction The EA should identify valid BUY/SELL setups around predefined SNR/GAP areas, apply configurable RSI, SMA, EMA and
Indicador Maximas e Minimas + Super Trend O Indicador MAX/MIN é um indicador de análise técnica para o MetaTrader 5 , desenvolvido para ajudar você a identificar regiões importantes de preço e possíveis oportunidades de compra e venda. O que ele faz MAX/MIN: identifica máximas e mínimas relevantes do mercado e mostra os preços no gráfico. HH / HL / LH / LL: ajuda a visualizar a estrutura do mercado, mostrando quando

プロジェクト情報

予算
30 - 70 USD
締め切り
最低 1 最高 10 日