CREATE EA WITH TREND/ MARKET MONITOR AND BID CONTROL

Termos de Referência

Hi Programmers,

I want to create an EA that will make use of the average prices to determine the direction of the market and take bids accurately towards the direction until it reaches the maximum distance for taking bids.  It will also consider a profit to loss ratio which will be based on risk as a % of the account balance.

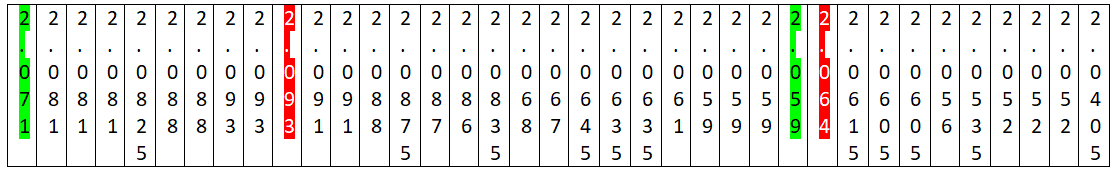
As you can see from the picture and the prices showed , the prices represent the manually computed average prices for the products for the Month of September 2025. I want the EA to use the movement and changes in the prices to determine if market is going up or coming down and then BUY if going up or SELL if coming down.

The below table shows some products with different average prices at intervals. The Average prices is obtained by using the Highest price and lowest price at specific time intervals to compute changes in the prices. The Green coloured showed that prices are going upwards and therefore a BUY and the Red shows price falling and a SELL.

Another condition to be used is to identify all BUY positions and all SELL positions if we have multiple positions of same direction, and the EA will then be able to compile All BUY opportunity prices together and SELL opportunity prices as well together.

EA will then ensure it monitors real time prices to determine the best action to take as a BUY or SELL. A SELL opportunity will occur if the current price falls below the Lowest RED position (which is based on the Extreme price of every trend move before changing direction ie DOWNWARDS), and also a BUY opportunity will occur if the current price goes above the Highest GREEN position (which is based on the Extreme price of every trend move before changing direction ie UPWARDS)

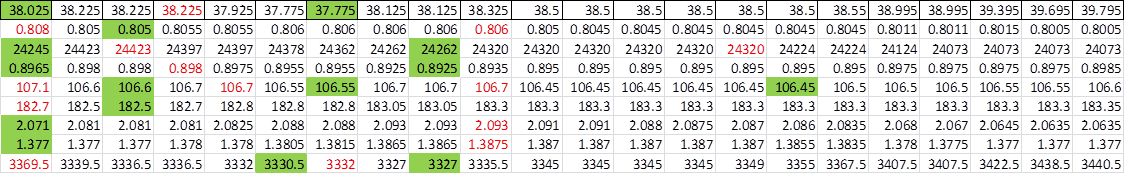
In the first example above, (SILVER) the GREEN colours have the Highest position as 38.025 and lowest at 37.775, it is expected that the market will surely go to one of the directions ie RED or GREEN. From the first sample, the market left the Green axis to go upwards to above 39.795 which is higher than the first red of 38.225, therefore indicating a BUY OPPORTUNITY. EA will then ensure it manages the trades for the BUY positions upwards.

In the second example above,(NZDCAD) the RED colours have the Highest position as 0.808 and lowest at 0.806, it is expected that the market will surely go to one of the directions ie RED or GREEN. From the first sample, the market left the RED axis to go downwards to below 0.8005 which is lower than the first Green of 0.805, therefore indicating a SELL OPPORTUNITY. EA will then ensure it manages the trades for the SELL positions downwards.

In the last example above, (GOLD) the RED colours have the Highest position as 3369 and lowest at 3332, And the GREEN colours have an Highest of 3330.5 and lowest of 3327. it is expected that the market will surely go to one of the directions ie RED or GREEN. From the first move of RED, the market left the RED axis to go downwards to below 3332 which is still Higher than the first Green of 3330.5, but then the GREEN also reached a lowest of 3327 and went upwards againg to above 3330.5 indicating a BUY OPPORTUNITY. EA will then ensure it manages the trades for the BUY positions upwards.


THE EA should also indicate as a variable the following information

Highest Price after installation with date and time

Lowest price after installation with date and time

Highest GREEN position/ price (BUY limit)

Lowest RED position/ price (SELL limit)

Current Market trend (BUY/SELL) based on UPWARDS/DOWNWARDS trend

Take profit/ Stop Loss.

Profit to Loss Ratio (Risk Management)

I will also have the source code after completion.

Please note that I will have up to 8 weeks to test the accuracy of the EA, but can approve the project for completion after testing for 5 days consistently.

Only professional and serious immediately available Programmers should apply.


Thanks


Respondido

1
Desenvolvedor 1
Classificação
(133)
Projetos
142
38%
Arbitragem
3
33% / 33%
Expirado
1
1%
Trabalhando
2
Desenvolvedor 2
Classificação
(24)
Projetos
30
13%
Arbitragem
12
0% / 67%
Expirado
8
27%
Trabalhando
3
Desenvolvedor 3
Classificação
(19)
Projetos
22
36%
Arbitragem
3
33% / 33%
Expirado
1
5%
Trabalhando
Publicou: 3 códigos
4
Desenvolvedor 4
Classificação
(12)
Projetos
16
13%
Arbitragem
4
50% / 25%
Expirado
4
25%
Trabalhando
5
Desenvolvedor 5
Classificação
(4)
Projetos
7
0%
Arbitragem
3
33% / 67%
Expirado
3
43%
Trabalhando
6
Desenvolvedor 6
Classificação
Projetos
0
0%
Arbitragem
0
Expirado
0
Livre
7
Desenvolvedor 7
Classificação
(322)
Projetos
499
67%
Arbitragem
5
40% / 0%
Expirado
4
1%
Livre
Publicou: 8 códigos
Pedidos semelhantes
Indicator Simple Moving Averages and Exponential Moving Average BUY SIGNALS SMA 7 High Crosses Above 20 EMA= LIME color Buy Signal at the low of next candle. SMA 7 High Crosses above 40 EMA= BLUE color Buy Signal at low of next candle. SMA 7 High Crossed above 200 EMA= YELLOW Color buy signal at the low of next candle. SELL SIGNALS SMA 7 Low Crosses below 20 Ema= LIME color Sell Signal at the high of next candle. SMA
I trade manually on M1 chart (XAUUSD) with fractals and alligator. When there is a price break on fractal (or some fractals that form a price level) or a price level created by multiple candles spikes, I enter 2 trades (0.02 lots), and 2 trades (0.04 lots). If I go in profit (5/10€), I close in profit. But if I go in loss with DD, at this point starts the management: every price level (important level) created by
Phahla fx boto 30+ USD
99.99% signal accuracy 10-15 trades distribution all currency trade and meta AI assistance on loss[advice] stop and start robot cyber security firewall protection activation code: 20060605TLP20 Please create a trading bot with any logo with the name elevation
Refine signal trigger execution . Optimize live chart performance . Ensure stable and clean code structure : Stable and clean code is important . Otherwise its a mess . Apply with as much accurate structure you foresee
RED DEVIL AI 30+ USD
50 EMA > 200 EMA → Uptrend confirmed Price pulls back to touch or cross below 50 EMA RSI > 50 ATR(14) > 20-period ATR average (volatility expanding) Current candle closes bullish ➡ Enter BUY at candle close50 EMA < 200 EMA → Downtrend Price pulls back to touch or cross above 50 EMA RSI < 50 ATR filter confirms volatility Current candle closes bearish ➡ Enter SELL at candle closeATR(14) Take Profit: 2.5 × ATR(14) This
My EA (Expert Advisor) is a powerhouse! 💪 With rock-solid 100% risk management, it lets you trade stress-free while maximizing gains. Free to manage manually, it's designed to boost profitability. 🚀
This post is subject to developers response . Edit the post as you like . May be with me you can make a come back . So , , , Shift calculations . More to the calculation then you can comprehend is known . What else comes to your mind
Here is an example of Requirements Specification for the development of the MACD Sample Expert Advisor, which is available in the MetaTrader 5 standard package. 1. The idea of the trading system is as follows: market entries are performed when MACD's main and signal lines intersect in the current trend direction. 2. Trend is determined based on the Exponential Moving Average with the specified period
Project Title Freedom ORB – Fully Automated MT5 Expert Advisor (ORB + Structure + Liquidity) (MT5) Project Description I require a fully automated MT5 Expert Advisor based on a structured Opening Range Breakout (ORB) model with market structure and liquidity confirmation. The EA must: Detect ORB session range Wait for breakout (close-based) Wait for retrace Confirm M1 structure + displacement Execute trade
I’m looking for a trading bot where I can use a balance of £1000 to make regular entries making £20-£40 per entry. obviously, I want to have minimum loss with a lot more profit being made

Informações sobre o projeto

Orçamento
30+ USD
Prazo
para 5 dias