 全部订单
全部订单
 规则
规则
指定
Hi Programmers,
I want to create an EA that will make use of the average prices to determine the direction of the market and take bids accurately towards the direction until it reaches the maximum distance for taking bids. It will also consider a profit to loss ratio which will be based on risk as a % of the account balance.
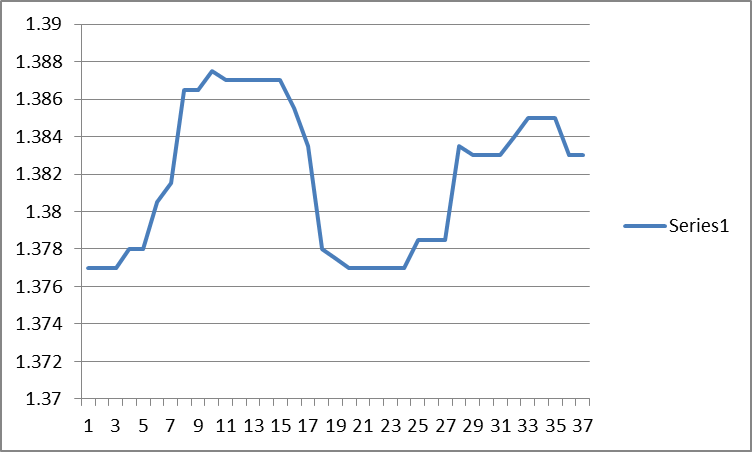
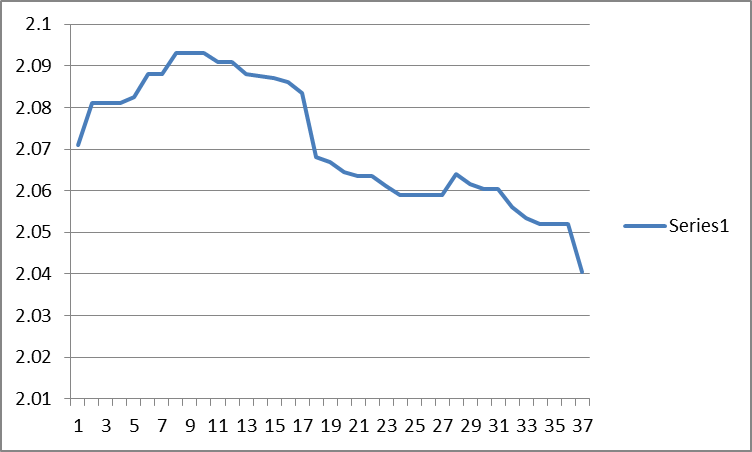
As you can see from the picture and the prices showed , the prices represent the manually computed average prices for the products for the Month of September 2025. I want the EA to use the movement and changes in the prices to determine if market is going up or coming down and then BUY if going up or SELL if coming down.
The below table shows some products with different average prices at intervals. The Average prices is obtained by using the Highest price and lowest price at specific time intervals to compute changes in the prices. The Green coloured showed that prices are going upwards and therefore a BUY and the Red shows price falling and a SELL.
Another condition to be used is to identify all BUY positions and all SELL positions if we have multiple positions of same direction, and the EA will then be able to compile All BUY opportunity prices together and SELL opportunity prices as well together.
EA will then ensure it monitors real time prices to determine the best action to take as a BUY or SELL. A SELL opportunity will occur if the current price falls below the Lowest RED position (which is based on the Extreme price of every trend move before changing direction ie DOWNWARDS), and also a BUY opportunity will occur if the current price goes above the Highest GREEN position (which is based on the Extreme price of every trend move before changing direction ie UPWARDS)

In the first example above, (SILVER) the GREEN colours have the Highest position as 38.025 and lowest at 37.775, it is expected that the market will surely go to one of the directions ie RED or GREEN. From the first sample, the market left the Green axis to go upwards to above 39.795 which is higher than the first red of 38.225, therefore indicating a BUY OPPORTUNITY. EA will then ensure it manages the trades for the BUY positions upwards.
In the second example above,(NZDCAD) the RED colours have the Highest position as 0.808 and lowest at 0.806, it is expected that the market will surely go to one of the directions ie RED or GREEN. From the first sample, the market left the RED axis to go downwards to below 0.8005 which is lower than the first Green of 0.805, therefore indicating a SELL OPPORTUNITY. EA will then ensure it manages the trades for the SELL positions downwards.
In the last example above, (GOLD) the RED colours have the Highest position as 3369 and lowest at 3332, And the GREEN colours have an Highest of 3330.5 and lowest of 3327. it is expected that the market will surely go to one of the directions ie RED or GREEN. From the first move of RED, the market left the RED axis to go downwards to below 3332 which is still Higher than the first Green of 3330.5, but then the GREEN also reached a lowest of 3327 and went upwards againg to above 3330.5 indicating a BUY OPPORTUNITY. EA will then ensure it manages the trades for the BUY positions upwards.


THE EA should also indicate as a variable the following information
Highest Price after installation with date and time
Lowest price after installation with date and time
Highest GREEN position/ price (BUY limit)
Lowest RED position/ price (SELL limit)
Current Market trend (BUY/SELL) based on UPWARDS/DOWNWARDS trend
Take profit/ Stop Loss.
Profit to Loss Ratio (Risk Management)
I will also have the source code after completion.
Please note that I will have up to 8 weeks to test the accuracy of the EA, but can approve the project for completion after testing for 5 days consistently.
Only professional and serious immediately available Programmers should apply.
Thanks