Live USA stock Pattern detector - description & pictures

MQL5 Indicadores Outros

Termos de Referência

per attached detailed job description  

source code to be provided, accuracy % to be detected of the indicator along with back testing to check indicator accuracy.


Hi , hope you are well.

i would like to know if the following live pattern scanner can be done. Kindly let me know your price and time & programming language you will use for MetaTrader5 (i am flexible on any other platform you may suggest if you think it will be cheaper or better) 

i just want to detect the following 3 patterns of ALL USA stocks (during the trading of 1 min & 5 min charts) and be alerted about them on spot /LIVE so i can trade them immediately.
Once altered (via visual charts display) about the stock that have the following 3 types pattern, i will be able to decide whether to take the move to buy or not after some confirmations i decide on it judgmentally.

First build (Yesterday USA scanner settings)- stocks parameters scan to detect the patterns from on the next trading day:

Features of the US stocks to be displayed  (which i can change its  parameters from the admin settings) :

1- to have  yesterday volume above 3 million & at  least 10%  (or specific %) higher th an its yesterday’s volume (or specific period)

2-  price of yesterday between $2-$200

3- Price increase or decrease of yesterday +/-5 % (meaning remove stocks that has -2% decrease .. but show if it has -5.2% or -20% or +5.5%)


Second  - detect the pattern visually during the live trading: 
after these criterias are met, i would like to see the following stocks appear during the 1min & 5min chart immediately (LIVE) in another viewing display page :

(type 1) - check type 1/2/3 picture file.pdf
1- see stocks that have 3 red bars at least ,
2- the red bar (no.2) lowest point is lower than the earlier red bar (no.1).. lower lows, lower highs
3- the last red bar (no.2) volume must be at least +70% of first market opening 1min (or 5min) volume bar
4- after the lowest red bar to detect the green bar and view it on the display ONLY if the green bar is staying green for 40th second of the (1min) and 3.5 minutes of the (5min). Meaning before the  bar completion of the 1min/5min being green the chart should appear.

(type 2) — in case the lowest red bar volume is not +70% then the volume shall be detected on the next following green bar meaning  —
1- similar to three red bars shapes in type 1 
2- three red bars to be followed by a green bar that its volume must be at least +70% of first market opening 1min (or 5min) volume bar.

3- After the FIRST green bar with the (+70% vol) it should view on the display ONLY if the SECOND green bar appeared after it and  staying green for 40th second of the (1min) and 3.5 minutes of the (5min). Meaning before the second green bar completion of the 1min/5min the chart should appear.

(type 3 - doji)
1- see stocks that have 3 red bars at least ,
2- the red bar (no.2) lowest point is lower than the earlier red bar (no.2).. lower lowers, lower highs
3- the last red bar (no.2) volume must be at least +90% of first market opening 1min (or 5min) volume bar
4- after the doji bar , is to detect the green bar that its last price higher than the doji 
and view it on the display ONLY if the green bar is staying green for 40th second of the (1min) and 3.5 minutes of the (5min). Meaning before the  bar completion of the 1min/5min being green the chart should appear.

Extras:
a) the 1min & 5min each to be viewed in separate pages 
b) the display box of each ticker symbol that match the signals to show: 
p.p1 {margin: 0.0px 0.0px 0.0px 0.0px; font: 12.0px 'Helvetica Neue'}

- ticker symbol & live price movement 

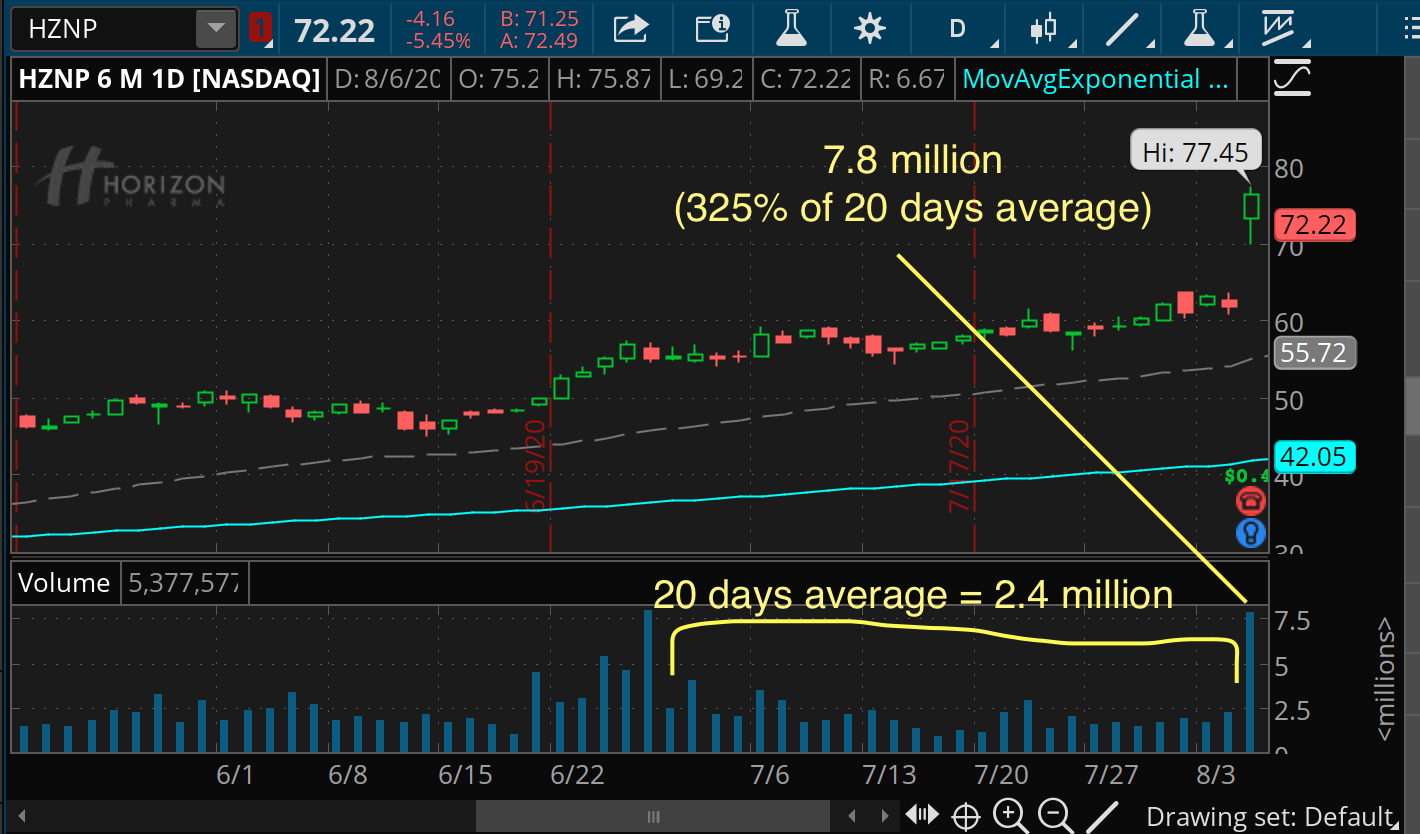
- Yesterday volume increase % compared to its average past 20 day volume "excluding yesterday vol"- attached example "20 day vol average" 

-can it detect the stock float from Yahoo Finance and put it in the display?

- show the % of the 3 red bars reduction .. for example first red bar (price fall from $100 to $99), second (price fall from $99 to $95) , third red bar (price fall from 95 to 92).. so it should show (3 red bar fall of 8%) 

- on the display of each ticker , it should have also the 1min & 5min chart box (in all cases)

on the display of each ticker, to show what % is the vol size of first 1min/5min bar (example  73%, 120% ...) compared to the igniting bar (point no.3 in above all 3 types)

 c) all the above is for the buy signals... also the same for the sell (meaning revers the above to for the shorting signal) 

**  i may buy the stock from DAS Traders / TD , not from MT5. MT5 only for viewing signals. 


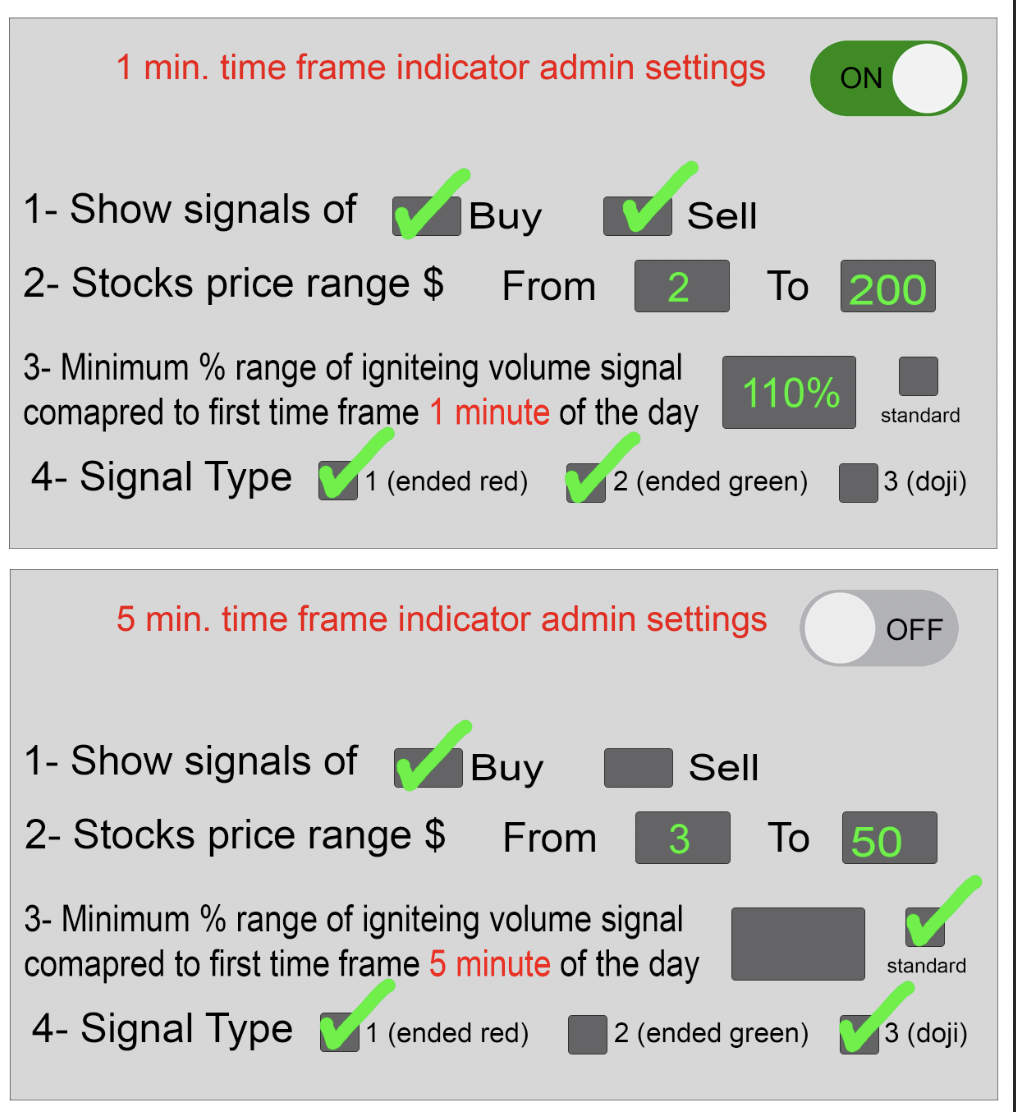
Second build the admin panel of the indicator settings: 

per the attached picture. 

note that in no. 3 in the picture, standard means that volume will be as per the above standard % volume of each type. but if we entered a % figure, then it should override the above % volume. Example in type 2, the volume must be 70% (this is standard) but if we have written 110%, then it should only show type 2 with 110% volume above the first 1min vol/ 5min vol of the day.

Questions:

1- suggested price & time to complete this project

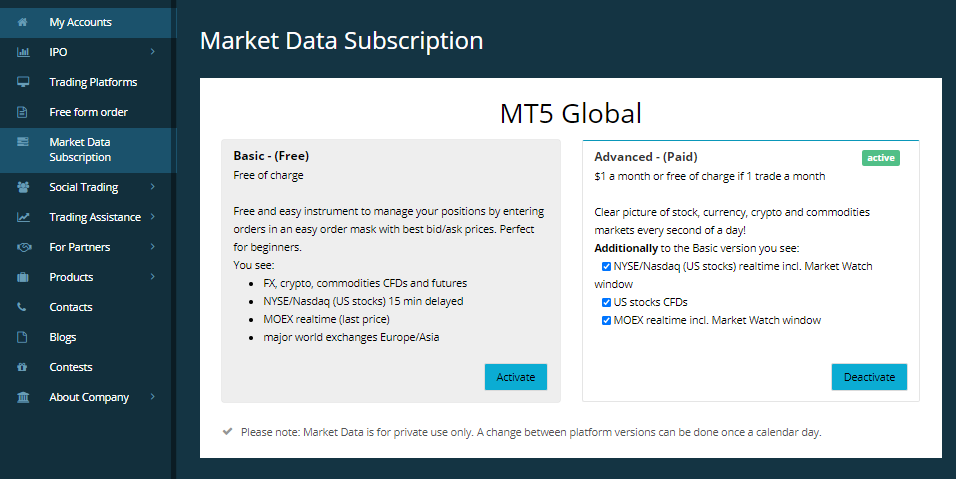
2- I will be using for MT5 from (https://just2trade.online/) which will have all the USA stock market live... is it enough to feed it by building the scanner ? attached "subscription_market_depth" from the website.

3- will you be able to view the stocks (with the chart) automatically that match the singles during the 1min & 5min chart immediately (LIVE) in another viewing display page in MT5?  

4- What are the risks/challenges/ limitations/ what is not possible in the above requirements ?


Thanks
Ahmed 


Respondido

1
Desenvolvedor 1
Classificação
(277)
Projetos
334
55%
Arbitragem
14
36% / 29%
Expirado
1
0%
Livre
2
Desenvolvedor 2
Classificação
(45)
Projetos
59
14%
Arbitragem
31
26% / 52%
Expirado
35
59%
Livre
3
Desenvolvedor 3
Classificação
(250)
Projetos
400
38%
Arbitragem
82
41% / 20%
Expirado
69
17%
Carregado
Pedidos semelhantes
Hello, i am looking for developer who can create custom price alert indicator or EA for MT5. Basically either or is fine, prefered indicator if possible. The function of alerts in MT5 is fine but it does not allow setting custom sounds for specific charts with ease. For example, one can attach custom sound to new price alert, but if you use a lot of alerts daily (which i do) and want to have each ticker/pair to have
Angelshark 30 - 35 USD
Hello i want an indicator for drawing lines of resistance and support as shown in the picture below it will be from combining two mt 5 indicators simple MA and Exponential moving average. I will give the parameters and all the values required anyone willing to do it in the chepest price possible also i need to test the indicator before payment
I need a indicator that will be based on RSI combined with MACD and algorithm, when I plug the indicator it must be able to give me signal of buy or sell and entry point and take profit 1 2 3 and stop loss if is a buy it must be blue arrow if is a sellthe arrow must be red
Hello i need a Pinescript indicator for Tradingview, please read in attached the requirements apply only if you can work with my budget and you have knowledge of pinescript (ex. you have already work with pinescript) the indicator to be able to predict D point Based on XABC Points, some times it will fails and it will be cancelled
If auto trading disabled and trades closed (like to avoid news), then when auto trading enabled, EA needs to start trading again right away, but it doesn't. If the terminal is restarted with active EA, the EA should pick up where it left off, not make new trades because terminal restart. EA has terminal GVs. If EA is re initialized with same set file it overwrites the GVs, it should not overwrite the GV values, but
I need assistance setting up both manual and automated trading strategies. I want the flexibility to add multiple strategies in the same order as needed. Additionally, I need any profits made to automatically convert to USDT (Tether) rather than remaining in the same coin. The setup should be compatible for both PC and mobile use, and across platforms including Binance, Bybit, Bitget, Gate.io, and TradingView. If you
I want to convert my tradingview indicator to MT4. I need a developer who can get it completed under the course of 24-48hrs. And I need some who is more experience at this level and possibly if you have experience with NinjaTrader too, we can collaborate and work on it as well
I am currently seeking the expertise of a skilled MQL5 developer to assist with a custom trading bot project tailored to specific requirements. The project entails the development of a versatile trading bot capable of implementing both manual and automated strategies, with flexibility to switch between strategies seamlessly. Additionally, the bot should be designed to convert profits automatically into USDT, allowing
Index chart Liteforex 30 - 35 USD
Currency Index MT4 Indicator for USD, EUR, GBP, CHF, JPY, CAD, AUD & NZD (to function exactly like LiteForex's LFX Currency Indexes). I need the chart to be used in any time frame and be able to add other indicators to it too
I have an EA with the sourse code but instead of using an FX blue copier to invert the trades i want the EA to reverse its Strategy. For example if the EA wants to buy it will sell. And the stop loss and take profit will be inverted also

Informações sobre o projeto

Orçamento
50 - 80 USD
Desenvolvedor
45 - 72 USD