Hello I need someone to develop my trading strategy into an indicator, below are the details as I can best describe.
SETTING UP THE STRATEGY
The strategy is set up using the default Bollinger settings on the MT4 or MT5 software.
The trend indicator is entered thrice, with slightly different tweaks to the each as below;
Period 20 Deviations 1, Period 20 Deviation 2, and lastly Period 20 Deviation 3
All Shift 0
and all Apply to close.
It is preferable to have different colours for each deviation as it aids for easier recognition.
Additional settings to be added are the Oscillators settings which for convenience, we would prefer to use the Relative
Strength Index and the MACD.
The RSI would be at period 14, should be overbought and above 70 for a sell signal, and oversold below 30 for a buy signal
MACD settings are Fast EMA 12, Slow EMA 26 and MACD SMA 9 all applied to close. Regular MACD Sell and Buy Signals apply
UNDERSTANDING THE BOLLINGER STRATEGY SETUP
As you will notice, there will be 7 strands on the screen they all serve as support and resistance levels. The most important strands
for the strategy will be the the mean (the 4
thstrand counting anyway), and the top and the bottom strand.
Now when a trend is forming, you want to observe at what divide of the mean it is. A stronger Sell signal is usually underneath the mean
while a stronger buy signal is usually above the mean.
Also, you would notice the width between the strands of the Bollinger strategy at different points on the chart, that is a result of strong
trend movement. When the trend is strong, the strands are directed against themselves stretching outwards and when the trend is weak or
ranging the bands squeeze in.
So, worthy of note for emphasis are;
The 7 strands of the Bollinger acting as support and resistance levels.
The Top Strand, the Mean and the Bottom Strand.
The size of the Bollinger when a trend is strong and weak.
The direction of the tip of the strands.
USING THE BOLLINGER STRATEGY
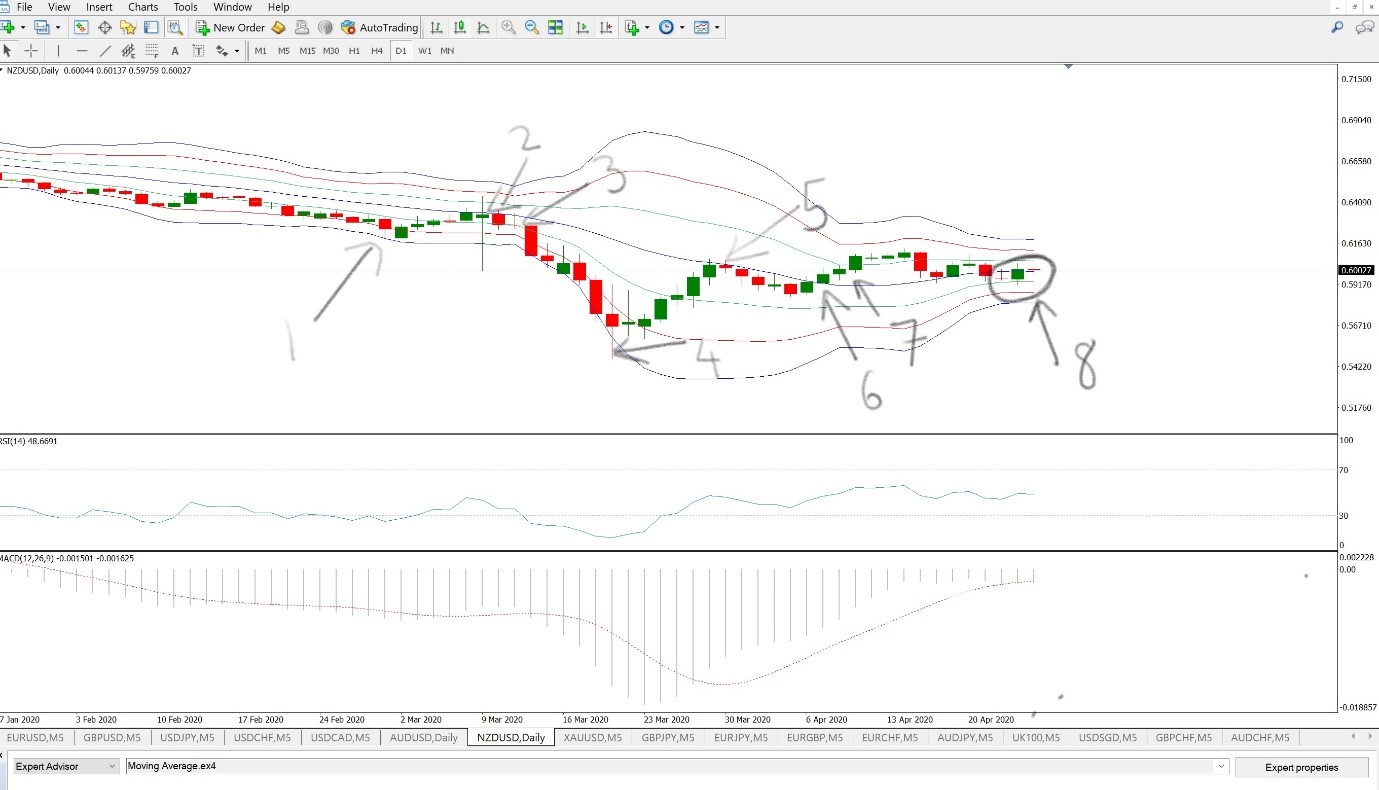
The attached diagram on a daily TF of the NZDUSD and following the markings using the numbered arrows;
NUMBER DESCRIPTIONS AS SEEN ON THE ATTACHED IMAGE
1. Overall, the Bollinger bands are squeezed which signifies a ranging market and a NO Signal. It touches the bottom strand which is a
strong support indication and is reversed to a buy.
2.) A sudden news event triggers a sharp move in both directions. Always set SL and TP on all trades. The next candle that forms is a sell
candle under the mean as the mean has not yet been broken.
3.) This candle is your confirmation candle and entry is at the close of that candle. Stop Loss is the high of the previous candle or if you
have pivot levels, 5-6 pips above the next resistance. As you notice, the doji formed is followed by a strong sell candle which you would ride.
4.) The Bollinger bands have expanded, and you have gotten to a strong support level which is the bottom. On the reversal, you jump out.
5.) Notice that the trend could not break the mean of the Bollinger bands and ignites a sell.
6.) The first candle to form above the mean.
7.) Your entry point following the previous candle as signal.
8.) An indecisive market which you should stay out of.
OTHER INFORMATION
Indicator should be able to scan through the market watch with emphasis on the H1 and H4 timeframe for entries whilst using the Daily time frame
to spot setups.
AUTOMATIC SL: Below or above previous structure levels or use of ATR. TP: Based on Fibonacci expansion levels or Fibonnacci 38.2 or 61.8 levels
Should come with push notifications, on chart alert, when setup criteria is met and a dashboard to show completed strategy over different
pairs, indices, metals etc.
Pedidos semelhantes
I want to create an EA that will take trades according to a trading zone condition. The logic will start with the identification of a trading zone for BUY and SELL in the EA. After the trading zone has been identified, then the EA will use the current time frame prices to determine if the market will be a BUY or SELL. The market will be a BUY if the low price range goes above the lowest price after the installation
I am looking for a highly skilled trading strategist and MQL5 developer with genuine experience in researching, designing, testing, and implementing systematic trading strategies. My primary interest is XAUUSD (Gold), although proven experience with other financial markets is also welcome. I am not looking for someone who simply converts trading rules into code. I want to identify a professional who understands
Project: XAUUSD Gold Trading Robot for MetaTrader 5 I want to develop a fully automated Expert Advisor (EA) for MetaTrader 5, designed exclusively for Gold (XAUUSD) and compatible with the Exness broker. Trading Strategy: Liquidity + CHOCH + Retest Identify important buy-side and sell-side liquidity zones using previous highs and lows, equal highs/lows, and confirmed swing points. Wait for a clear liquidity sweep
i want to fix my gold martingale bot MT5. RSI 14 ENTRY 30 BUY 70 SELL Lot 0.02 0.04 0.07 TP 150 for all SL 90 30 30 once total daily profit is 200$ stop trading stop trading once 2 consecutives total losses stop trading if spread exceeded 30 and between hour 15 & 17 PM Move SL to breakeven point once the profit exceeded 50 from from breakeven thanks
MarketMind Breakout Pro XAUUSD H1 — Donchian Breakout EA Project type: Personal EA development and backtesting Platform: MetaTrader 5 Instrument: XAUUSD Timeframe: H1 Strategy: Donchian Channel breakout with EMA 200 Project overview This project evaluates a Donchian breakout trading strategy for XAUUSD on the H1 timeframe. The system uses channel-based breakout conditions and an EMA 200 trend filter. Historical
Title: Fully Automatic MT5 Trading Bot (Expert Advisor) with Risk Management I want a fully automated trading robot (Expert Advisor) for MetaTrader 5, written in MQL5. The bot must automatically analyse market data, identify trading opportunities, execute BUY and SELL orders, manage open positions, and close trades according to predefined rules without requiring manual confirmation for each trade. Requirements
I have three indicators that operate independently. I want to combine them into one indicator with custom expert programming that automatically enters trades when a signal is generated by one of the indicators. I will pay for this service Thanks you
Existing EA: NEW_CORE_ORB_M5_v021 | MT5 | XAUUSD M5 Early-stage research prototype, not a new EA from scratch. Need an experienced MQL5 developer to audit, complete, repair, improve and test BOTH independent strategies equally: Opening Range Breakout (ORB) and Scalp. Keep code lightweight and preserve an untouched baseline. No unnecessary rewrite or complex filters. 1. ORB Strategy Verify opening-range construction
Hello International Developer, I need LIFETIME MT5 EA for XAUUSD Gold. REQUIREMENTS: 1. Lifetime bot - No expiry date, unlimited accounts, unlimited installations 2. Must include source code .mq5 file - This makes it lifetime 3. Every trade MUST have Stop Loss 300 points and Take Profit 600 points 4. No martingale, No grid, No averaging - Clean safe strategy 5. Auto lot size = 1% risk per trade for good margin growth
Hiring: Forex Strategist & MQL5 Developer for Long-Term EA Development I am looking for an experienced Forex Strategist and MT5 (MQL5) Developer to work with me on an ongoing project to develop, test, improve, and optimize a profitable Forex Expert Advisor (EA). My Message to the Developer My budget is $150 . However, this is not intended to be a one-time payment for a finished product. I want an ongoing working
 Todas as encomendas
 Regras