Hello I need someone to develop my trading strategy into an indicator, below are the details as I can best describe.
SETTING UP THE STRATEGY
The strategy is set up using the default Bollinger settings on the MT4 or MT5 software.
The trend indicator is entered thrice, with slightly different tweaks to the each as below;
Period 20 Deviations 1, Period 20 Deviation 2, and lastly Period 20 Deviation 3
All Shift 0
and all Apply to close.
It is preferable to have different colours for each deviation as it aids for easier recognition.
Additional settings to be added are the Oscillators settings which for convenience, we would prefer to use the Relative
Strength Index and the MACD.
The RSI would be at period 14, should be overbought and above 70 for a sell signal, and oversold below 30 for a buy signal
MACD settings are Fast EMA 12, Slow EMA 26 and MACD SMA 9 all applied to close. Regular MACD Sell and Buy Signals apply
UNDERSTANDING THE BOLLINGER STRATEGY SETUP
As you will notice, there will be 7 strands on the screen they all serve as support and resistance levels. The most important strands
for the strategy will be the the mean (the 4
thstrand counting anyway), and the top and the bottom strand.
Now when a trend is forming, you want to observe at what divide of the mean it is. A stronger Sell signal is usually underneath the mean
while a stronger buy signal is usually above the mean.
Also, you would notice the width between the strands of the Bollinger strategy at different points on the chart, that is a result of strong
trend movement. When the trend is strong, the strands are directed against themselves stretching outwards and when the trend is weak or
ranging the bands squeeze in.
So, worthy of note for emphasis are;
The 7 strands of the Bollinger acting as support and resistance levels.
The Top Strand, the Mean and the Bottom Strand.
The size of the Bollinger when a trend is strong and weak.
The direction of the tip of the strands.
USING THE BOLLINGER STRATEGY
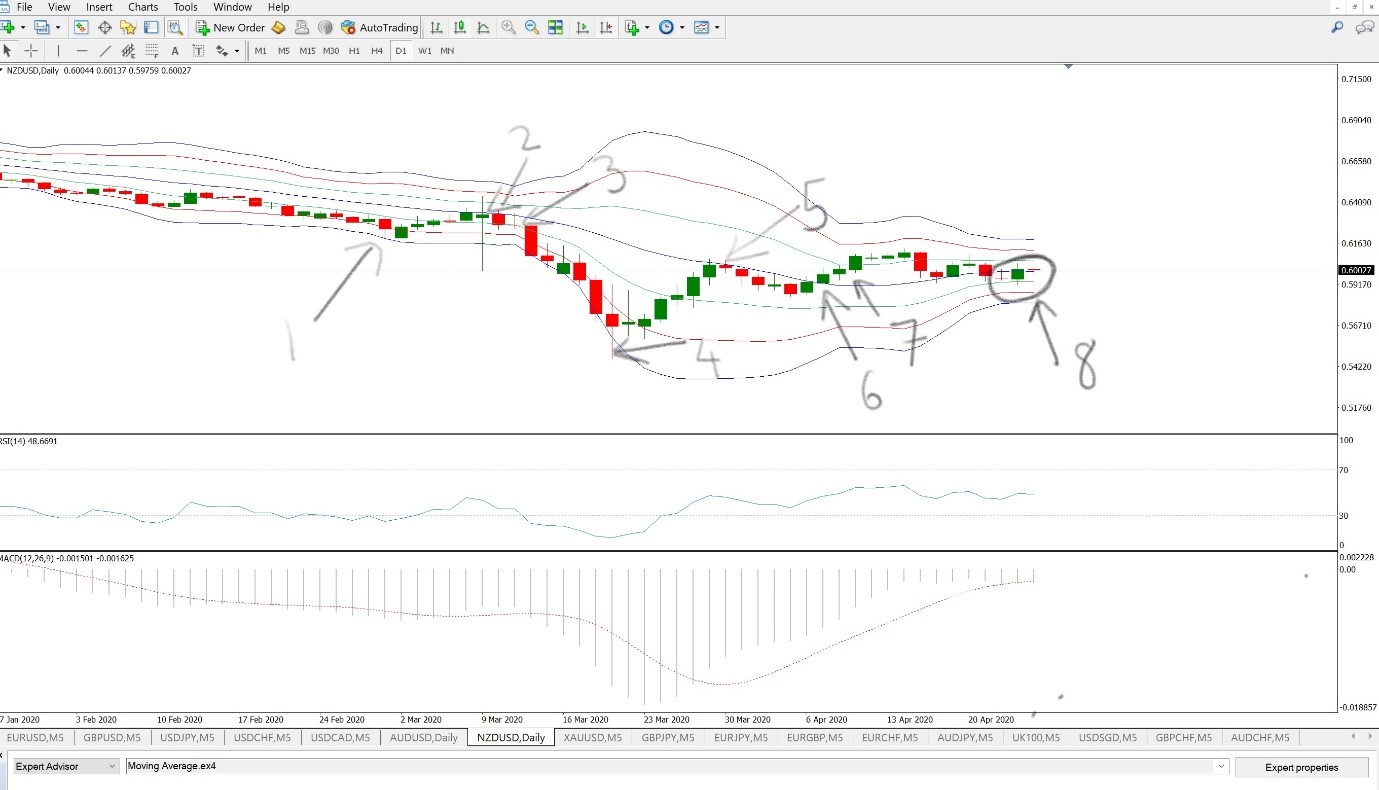
The attached diagram on a daily TF of the NZDUSD and following the markings using the numbered arrows;
NUMBER DESCRIPTIONS AS SEEN ON THE ATTACHED IMAGE
1. Overall, the Bollinger bands are squeezed which signifies a ranging market and a NO Signal. It touches the bottom strand which is a
strong support indication and is reversed to a buy.
2.) A sudden news event triggers a sharp move in both directions. Always set SL and TP on all trades. The next candle that forms is a sell
candle under the mean as the mean has not yet been broken.
3.) This candle is your confirmation candle and entry is at the close of that candle. Stop Loss is the high of the previous candle or if you
have pivot levels, 5-6 pips above the next resistance. As you notice, the doji formed is followed by a strong sell candle which you would ride.
4.) The Bollinger bands have expanded, and you have gotten to a strong support level which is the bottom. On the reversal, you jump out.
5.) Notice that the trend could not break the mean of the Bollinger bands and ignites a sell.
6.) The first candle to form above the mean.
7.) Your entry point following the previous candle as signal.
8.) An indecisive market which you should stay out of.
OTHER INFORMATION
Indicator should be able to scan through the market watch with emphasis on the H1 and H4 timeframe for entries whilst using the Daily time frame
to spot setups.
AUTOMATIC SL: Below or above previous structure levels or use of ATR. TP: Based on Fibonacci expansion levels or Fibonnacci 38.2 or 61.8 levels
Should come with push notifications, on chart alert, when setup criteria is met and a dashboard to show completed strategy over different
pairs, indices, metals etc.
비슷한 주문
Bonjour, je recherche un développeur MQL5 expérimenté pour créer un Expert Advisor pour MetaTrader 5 basé sur une stratégie de trading intégrant des principes de gestion des risques rigoureux et d'intelligence financière. Le robot doit être capable de gérer plusieurs paires de devises et d'optimiser automatiquement les entrées et sorties en fonction de conditions de marché prédéfinies."
Hello everybody, I'm looking for an experienced MQL4/MQL5 developer to optimize a High-Frequency Trading (HFT) Expert Advisor for both MT4 and MT5. The EA performs consistently and profitably on demo accounts, but when it is run on Raw and Standard live accounts under what appear to be the same trading conditions, it begins generating losses. I do not have the original source code (.mq4/.mq5); I only have the
I'm looking for an experienced NinjaTrader 8 (C#) developer to build a fully automated futures trading strategy. Please apply only if you have proven experience developing and testing NinjaTrader strategies. Project Overview Develop a fully automated NinjaTrader 8 strategy. Designed for Apex funded and evaluation accounts. Primary instruments: NQ/MNQ Futures (with flexibility to support other futures later). Trading
I need an Expert Advisor for MT5 on XAUUSD 1min timeframe using SMC concepts. STRATEGY RULES: SELL: 1. Identify previous day High/Low as liquidity 2. Entry only during London-NY session: 15:00-19:00 GMT+3 or broker clock. 3. If price sweeps previous day High and closes back below it 4. Check for bearish 1min FVG below sweep candle 5. Wait for BOS - lower low 6. Entry: Sell/buy at 50% of the FVG 7. SL: 10 pips above
Code An Loss Rate 90-100% MT5 EA , that can blow a 100 USD account a day ,with fixed TP of 3000 points and SL of 3000 For better Rate Calculations get an strategy that can lead to so
I am looking for an experienced MQL4/MQL5 HFT developer to build or optimize a High-Frequency Trading (HFT) Expert Advisor that can successfully pass proprietary trading firm challenges and perform consistently under live trading conditions with brokers such as 8cap or BlackBull Markets . The developer should have proven experience with HFT execution, ultra-low-latency trading, broker execution, slippage, spreads
Hello, I am looking for an existing, fully backtestable MT5 Expert Advisor or EA portfolio designed specifically for passing an FTMO-style prop-firm evaluation. I am not looking for unrealistic profit claims or a visually perfect backtest. My priority is a statistically defensible probability of passing the challenge while respecting all risk limits. Primary objective The system should be designed for the current
I have a High-Frequency Trading (HFT) Expert Advisor for both MT4 and MT5 designed primarily for US30 (Dow Jones Index) . The EA performs consistently and profitably on demo accounts, but when I run it on an IC Markets Raw or Standard live account, it starts generating losses under what appear to be the same trading conditions. At this time, I cannot provide the source code (.mq4/.mq5). I can only provide the
Hello looking for someone to convert an indicator from tradingview to Thinkorswim I have attached the codes from trading view Also, I like make it trigger (alert) a one-time alert when the trend changes, and can also create a custom watchlist column that flags symbols currently in a new trend so you can scan multiple stocks easily. And like the watchlist to show only fresh trend changes or the current trend direction
Specification : 1. Goal I am commissioning a mean-reversion grid Expert Advisor for XAUUSD on MT5. The deliverable is the complete, commented .mq5 source (strictly personal usel). Offers limited to compiled .ex5 will not be considered. 2. Required framework (non-negotiable) 2.1. Works natively on M5; signals evaluated on closed bars; symmetric long/short. 2.2. Entry logic built on Bollinger Bands + Moving Average