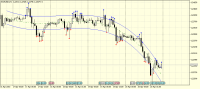
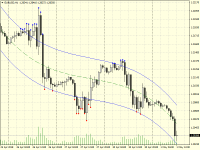
Ehlers Nonlinear FilterEhlers Nonlinear Filter provides extraordinary smoothing in sideways markets and aggressively follow major price movements with minimal lag.
Zone Trade - HistogramThis version of Zone Trade indicator is made to show as histogram in separate window.
Zone TradeThe indicator was described by B. Williams as fourth dimension - Trading Zone.
Heiken Ashi Zone Trade - SeparateThis version of Heiken Ashi Zone Trade indicator is made to display values in a separate window - that way it will not interfere with the other on-chart indicators and can be easier to read the states in some cases.
Heiken Ashi Zone TradeHeiken Ashi Zone Trade indicator is based on 3 indicators: Heiken Ashi, Accelerator Oscillator, and Awesome Oscillator.
Trend Intensity IndexTrend Intensity Index as described by M.H.Pee in his article "Trend Intensity Index".
TradePanelSimple one click trade panel, typically useful for scalpers and day traders.
Daily Pivot Points shifted for different day start timeThis indicator is another implementation of daily pivot points that allows the time for pivot point calculation to be advanced or delayed from the server time. It considers any Saturday trading to be Friday and any Sunday trading to be Monday.
Hedging_Zone_Recovery_AreaThis is my version of Zone Recovery Hedging Strategy Ea with two moving averages. It works on any time frame, you should try it on demo account.
Leader of the MACD - ExtendedThis version extends the basic version of Leader of the MACD with some options that are adding more flexibility to the usage of the indicator.
Trend Strength AverageTrend Strength Average uses some of the 4 regular types of averages for trend strength assessment.
ADXVMA HistogramADXVMA Histogram is a binary version of ADXVMA indicator: instead of showing the values of ADXVMA on chart, it displays only the state of the slope of the ADXVMA in a form of a histogram.
ADXVMAADXVMA uses modified ADX calculation for adapting Moving Average calculation.
Trend Continuation FactorTrend Continuation Factor (TCF) indicator identifies the trend and its direction.
Daily Pivot Points shifted for different day start timeThis indicator is another implementation of daily pivot points that allows the time for pivot point calculation to be advanced or delayed from the server time. It considers any Saturday trading to be Friday and any Sunday trading to be Monday.
Martingale Bone CrusherThis Martingale EA trades with one moving average, it is considered relatively safe because it takes a single trade at a time.
RSISignalThis indicator is based on original RSI, but more features are added to general signals and watch the strength of the price movement. The main purpose is to general buy/sell signals using smoothed RSI and its MA.
T3 bandsVariation of the well known Bollinger Bands indicator.
T3 DeviationT3 Deviation uses intermediate steps of T3 calculation to get the deviation based on T3. As expected the deviation calculated this way is much smoother than the Standard Deviation (as a result of using T3 which on its own is smoother than the simple moving average), and is "faster" in response to market changes.
Zero lag T3Zero lag T3 uses the "zero lagging" method to make it even faster and to keep the smoothness.
Zero lag Hull AverageThis version of Hull Moving Average makes the lag even lesser and still keeps the smoothing of the Hull Average thus making it even "faster".
TradePanelSimple one click trade panel, typically useful for scalpers and day traders.
Daily Pivot Points shifted for different day start timeThis indicator is another implementation of daily pivot points that allows the time for pivot point calculation to be advanced or delayed from the server time. It considers any Saturday trading to be Friday and any Sunday trading to be Monday.
Elliott Waves IndicatorThe indicator helps to use the Elliott waves, as described in the book "Trade Chaos" by Bill Williams.
QQEThe QQE (Quantitative Qualitative Estimator) indicator consists of a smoothed Relative Strength Index (RSI) indicator and two volatility-based trailing levels (fast and slow).
TradePanelSimple one click trade panel, typically useful for scalpers and day traders.
RSISignalThis indicator is based on original RSI, but more features are added to general signals and watch the strength of the price movement. The main purpose is to general buy/sell signals using smoothed RSI and its MA.
Hedging_Zone_Recovery_AreaThis is my version of Zone Recovery Hedging Strategy Ea with two moving averages. It works on any time frame, you should try it on demo account.
Triple Jurik SmoothJurik smoothing is very responsive to price changes, is very smooth and it makes it a very good candidate for this type of trend assessment.
Ultra TrendUltra Trend is one of the well known indicators made for MetaTrader 5 now.
Vortex - smoothedVortex indicator (based on the article that was published in the January 2010 issue of TASC) with a smoothing option.
Dynamic PivotsBased on the Austin Passamonte's idea, this indicator calculates intra-day pivots.
WPR with Bollinger bandsThis version of Williams Percent Range has an addition of Bollinger bands to help identify possible overbought and oversold levels breaks.
Count Back LinesIndicator based on the Daryl Guppy's original strategy.
Volatility Bands PercentThis is the version that David Rooke proposes as a solution to Bollinger Bands issues in a percent representation.
Volatilty BandsThis is the version that David Rooke proposes as a solution to Bollinger Bands issues.
Linear Regression StudyLinear regression line with an addition of standard error channel projection.
WSO & WRO ChannelThis version of WSO (Widner Support Oscillator) and WRO (Widner Resistance Oscillator) shows channel on chart instead of displaying oscillator values in a separate window.
WSP & WROWSO (Widner Support Oscillator) and WRO (Widner Resistance Oscillator).