Traders Dynamic Index Indicator v1 With Alerts

Please read the comment section for more introduction about indicator. ( i cant put all lines in here their is limit )

Entry conditions  

    ----------------                                                 

     Scalping  - Long = Green over Red, Short = Red over Green       

     Active - Long = Green over Red & Yellow lines                   

              Short = Red over Green & Yellow lines                      

     Moderate - Long = Green over Red, Yellow, & 50 lines            

                Short= Red over Green, Green below Yellow & 50 line  


    Exit conditions*                                                 

    ----------------                                                    

     Long = Green crosses below Red                                  

     Short = Green crosses above Red                                 

     * If Green crosses either Blue lines, consider exiting when     

       when the Green line crosses back over the Blue line.          


    IMPORTANT: The default settings are well tested and proven.      

    ---------- But, you can change the settings to fit your          

               trading style.                                        


    Price & Line Type settings:                                                      

     RSI Price settings                                                             

     0 = Close price     [DEFAULT]                                                  

     1 = Open price.                                                                

     2 = High price.                                                                

     3 = Low price.                                                                 

     4 = Median price, (high+low)/2.                                                

     5 = Typical price, (high+low+close)/3.                                         

     6 = Weighted close price, (high+low+close+close)/4.                            


     RSI Price Line & Signal Line Type settings                                     

     0 = Simple moving average       [DEFAULT]                                      

     1 = Exponential moving average                                                 

     2 = Smoothed moving average                                                    

     3 = Linear weighted moving average


SIGNAL GENERATION:

  ------------------
  
  The TDI (Traders Dynamic Index)
  ===============================

  Volatility Band High (VB HIGH), color: SkyBlue, buffer: UpZone
  Volatility Band Low (VB LOW),   color: SkyBlue, buffer: DnZone
  RSI PRICE LINE (RSI),           color: Green,   buffer: MaBuf
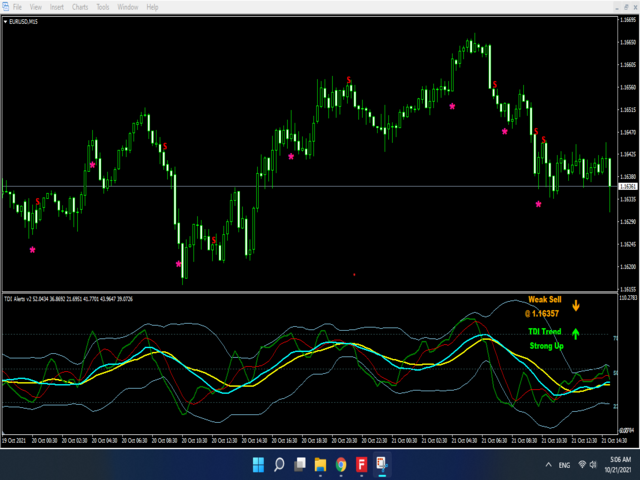
  MARKET BASE LINE,               color: Yellow,  buffer: MdZone
  TRADE SIGNAL LINE,              color: Red,     buffer: MbBuf
  TRADE SIGNAL2 LINE,             color: Aqua,    buffer: McBuf, -> has no function for signal generation!

  Indicator SignalLevels:
  RSI_OversoldLevel     : 23 (default: 32)
  RSI_OverboughtLevel   : 78 (default: 68)
  VB_ConsolidationLevel : 20 (default: 20)

  Conditions:
  ===========

  Strong Buy:  RSI>TRADE SIGNAL LINE && TRADE SIGNAL LINE> MARKET BASE LINE && RSI>RSI_OversoldLevel && RSI<RSI_OverboughtLevel

  Medium Buy:  RSI>TRADE SIGNAL LINE && RSI> MARKET BASE LINE && TRADE SIGNAL LINE< MARKET BASE LINE && RSI>RSI_OversoldLevel && RSI<RSI_OverboughtLevel

  Weak Buy:    RSI>TRADE SIGNAL LINE && TRADE SIGNAL LINE<MARKET BASE LINE && RSI< MARKET BASE LINE && RSI>RSI_OversoldLevel && RSI<RSI_OverboughtLevel

  Strong Sell: RSI<TRADE SIGNAL LINE && TRADE SIGNAL LINE< MARKET BASE LINE && RSI>RSI_OversoldLevel && RSI<RSI_OverboughtLevel

  Medium Sell: RSI<TRADE SIGNAL LINE && RSI< MARKET BASE LINE && TRADE SIGNAL LINE> MARKET BASE LINE && RSI>RSI_OversoldLevel && RSI<RSI_OverboughtLevel

  Weak Sell:   RSI<TRADE SIGNAL LINE && TRADE SIGNAL LINE> MARKET BASE LINE && RSI> MARKET BASE LINE && RSI>RSI_OversoldLevel && RSI<RSI_OverboughtLevel

  HIGH LEVEL CAUTION (Overbought): RSI>=RSI_OverboughtLevel

  LOW LEVEL CAUTION (Oversold): RSI<=RSI_OversoldLevel


  TrendSignals:
  =============               

  Strong Up:     TRADE SIGNAL LINE>MARKET BASE LINE

  Weak Up:       TRADE SIGNAL LINE>MARKET BASE LINE && RSI<MARKET BASE LINE

  Strong Down:   TRADE SIGNAL LINE<=MARKET BASE LINE

  Weak Down:     TRADE SIGNAL LINE<=MARKET BASE LINE && RSI>=MARKET BASE LINE

  Consolidation: VB HIGH-VB LOW<VB_ConsolidationLevel
추천 제품
Please contact me at telegram  https://t.me/smartforex7 After purchasing SmartForex Indicator then Use This Indicator...................... SMART EXIT PROFIT LINE Indicator is very Helpful with SmartForex Indicator ........................................ SMART EXIT PROFIT LINE Indicator Attach with SmartForex Indicator after then Red Line Show Exit buy Profit , Green Line show Exit Sell Profit................
FREE
Fibonacci BB Breakout Indicator is a powerful MT4 tool that automatically detects Bollinger Bands breakouts and draws Fibonacci extension levels as trend lines on your chart. It simplifies trading by highlighting potential support, resistance, and target zones after strong moves, with customizable alerts and an info panel for quick status checks.  Key Features - Automatic Breakout Detection: Spots bullish (price closes above upper BB) or bearish (below lower BB) breakouts on the previous close
Introduction This indicator detects volume spread patterns for buy and sell opportunity. The patterns include demand and supply patterns. You might use each pattern for trading. However, these patterns are best used to detect the demand zone (=accumulation area) and supply zone (=distribution area). Demand pattern indicates generally potential buying opportunity. Supply pattern indicates generally potential selling opportunity. These are the underlying patterns rather than direct price action. T
This is based on Demark's TD Sequential and TD Combo set of indicators. It mostly has the TD Sequential features. It contains the Arrows Indicator showing Buy/Sell signals and the scanner dashboard. Both are for MT4 (Metatrader 4) Platform. Read in detail in this blog post. And get extra indicators here: https://www.mql5.com/en/blogs/post/749596 and commentary about signals and how to wait for right time: https://www.mql5.com/en/blogs/post/759157 Feature List: - Set TD Setup (9), Countdown (13
Vrc Updated
Vimal Chudasama
This is an indicator that has been updated from the previous VRC indicator, which has both buy and sell arrows now, and it is optimised from the previous one. You can try it out, the version is upgraded and might suit your trading style. You can also use this indicator as a confluence, or you can use it as a main signal provider; it can be used along with your strategy or top-down approach analysis. Past performance does not guarantee future performance; kindly do a top-down analysis and keep yo
Sense
Ivan Stefanov
5 (2)
SENSE는 선택된 GANN 방식과 프랙탈 계산을 결합한 자동화된 시스템입니다. 이 시스템은 거래를 개시하고 청산할 위치를 알려줍니다. 더 이상 복잡한 계산에 시간을 낭비할 필요가 없습니다. SENSE가 모든 것을 알아서 해줍니다. 인디케이터를 설치하기만 하면 됩니다. 기본 원칙: 가격이 흰색 선 위에 있으면 시장은 강세입니다. 흰색 선 위에서 매수, 아래에서 손절 녹색 선은 상승 목표 가격이 흰색 선 아래에 있으면 시장은 약세입니다. 흰색 선 아래에서 매도, 그 위에 스톱 빨간색 선은 하락 목표 녹색 또는 빨간색 이중선은 강세 구간을 나타냅니다. 왜 센스인가? 수익 목표: SENSE는 자동으로 이익 실현 목표를 설정하여 트레이딩 성공을 극대화할 수 있도록 도와줍니다. 자동 적응: 인디케이터는 모든 차트주기에 대해 자동으로 다시 계산하여 수동으로 조정할 필요 없이 정확하고 신뢰할 수 있는 신호를 제공합니다. 스캘핑에도 좋습니다. 데모를 확인해 보세요!
DayLevelsSignalPro
Vladimir Chebonenko
The MT4 " DayLevelsSignalPro " indicator . Signal Indicator – generates the most accurate buy / sell signals . Noise filtering indicator  – reduces false signals . Signal information with a clear , understandable and visually convenient view . User- friendly graphical interface ( colors , sound notifications , customization options ) . - Generation of a breakdown signal for significant peaks of the Current day . - Generation of a signal for the breakdown of the previous Day 's Level - Generation
Proinsta78
Mikhail Bilan
3.5 (4)
점은 강한 움직임 방향을 나타냅니다. 자동으로 작동하지 않으며 수동으로 거래를 열고 닫아야 합니다. 포인트에서 직접 이익을 확인하십시오. 스크린 샷에서 파악할 수 있다고 생각합니다. 150-200핍마다 닫습니다. 지표 구독은 예측으로 별도로 협상할 수 있습니다. 개인 메시지 또는 프로필에 표시된 연락처에 씁니다. 나는 외환 주식으로 만 거래하고 다른 것들도 허용됩니다. 이익이나 손실은 그것을 어떻게 사용하느냐에 달려 있습니다. 일단 임대로 시작하세요. 표시기는 신호만 제공하고 추세의 강도를 보여주기 때문에 테스터에 대한 보고서는 없습니다. 2번째 파란색 원이 출현한 후 노란색 2개 이후에 매수 또는 매도 주문을 열 수 있습니다. 변경되었습니다!!! 2021년 7월 23일 좋은 오후입니다 친구들! 이제 구매자의 요청에 따라 구매 또는 판매 조건이 충족되면 표시기가 경고 및 푸시 알림을 보냅니다. MQL 애플리케이션이 설치되어 있으면 푸시 알림이 전화로 옵니다. 애플리케이션에 M
MA7 Flax MT4
Andrey Minaev
Description of work The MA7 Flax indicator is based on the standard Average True Range indicator and candle data. Shows candles that are larger in size relative to the ATR indicator value. Detailed information about the MA7 Flax indicator. Indicator settings General settings: Period ; Multiplier ; Remove subsequent arrows – removes subsequent arrows in one direction. Message settings: Send message to the terminal (Alert) – permission to send messages to the terminal using the Alert function; S
Vantage
Waseem Raza
5 (1)
Vantage is a one-click semi-automated tool which works with the user interface. The EA's base strategy is grid trading. The user can start first trade from chart buttons and the EA will do rest of the work. User can open grid to loss side, profit side or both sides same time, or can do a simple trade without the grid. Use low risk against balance and apply EA on VPS. With this, the EA can work properly without any interruption. To understand all functions watch the video below. Input parameters
Floating peaks oscillator - it the manual trading system. It's based on Stochastik/RSI type of oscillator with dynamic/floating  overbought and oversold levels. When main line is green - market is under bullish pressure, when main line is red - market is under bearish pressure. Buy arrow appears at the floating bottom and sell arrow appears at floating top. Indicator allows to reverse signal types. Main indicator's adjustable inputs : mainTrendPeriod; signalTrendPeriod; smoothedTrendPeriod; tre
Magneto Weekly Pro
Vladimir Blednov
Индикатор Magneto Weekly Pro отображает: Недельные важные линии поддержки и сопротивления (выделены желтым, красным и синим цветами). Основные недельные цели (выделены белым цветом). Недельные паттерны возврата цены (обозначаются красными флажками). Применение индикатора Magneto Pro можно использовать и как дополнение к существующей стратегии, и как самодостаточную торговую стратегию. Данный продукт состоит из двух индикаторов, работающих на разных временных промежутках, и предназначен для скаль
The SPV Volatility indicator is one of the most effective filters. Volatility filter. Shows three volatility options. The so-called limit, real, and the last most effective filter for the filter is the percentage filter. Percentage display of folatility shows the ratio of limit to real volatility. And thus, if we trade in the middle of the channel, then it is necessary to set a condition that the percentage is less than a certain indicator value. If we trade on the channel breakout - following t
Trend Monitor VZ
Sergey Ermolov
3.67 (3)
MT5 버전  | Valable ZigZag표시 |  FAQ 엘리엇 파동 이론은 가격 차트의 시각적 파동 모델을 기반으로 한 금융 시장의 프로세스에 대한 해석입니다. 이이론에 따르면 현재 시장에서 어떤 추세가 우세한지, 즉 상승 또는 하락 추세를 정확히 알 수 있습니다. Valable ZigZag 표시 기는 시장의 파동 구조를 보여줄 뿐만 아니라 현재 시간대에서 현재 주요 추세의 방향을 나타냅니다. 편의를 위해 Trend Monitor VZ 표시기는 거래하는 전체 통화 쌍 목록에 대한 모든 시간대의 추세 방향을 차트에표시합니다. 단일 차트에서 모든 상품에 대한 전반적인 시장 상황을 파악하여 올바른 거래 결정을 내릴 수 있습니다! Valable ZigZag 표시기는 매우 안정적이며 고전적인 지그재그처럼 방향을 자주 바꾸지 않아 트레이더에게 혼란을주지 않습니다. 이는 지표의 파동을 플로팅하기 위해 프랙탈을 사용하여 달성됩니다. Valable ZigZag 표시기는 무엇보다도 추세 표시기
MQLTrend
Mohammad Reza Aghaei
This tool helps you to control the situation at other times and include them in your trades when analyzing the market  This tool scans the market and reports the movement of the market at different times With the help of this tool, you can prevent many wrong analyzes With the help of this tool, you can have an overview of the market in the shortest time and save your time
FREE
Trading Sesions MT4
William Oswaldo Mayorga Urduy
COMMERCIAL SESSIONS This indicator shows in the selected graph divided by tables each of the sessions ASIA, JAPAN, LONDON, NEW YORK: Allows you to configure: Session Color  ASIA, JAPON, LONDRES, NEW YORK Hide and show each session It works in the lowest timeframes on the market, among which H4, H1, M15, M5 and M1 are recommended. (Don't forget to check out our other indicators)
OVERVIEW The Vector Candle Zones Render indicator automatically renders boxes for vector candle zones that are yet to be recovered. The indicator is an implementation of an existing PVA candles indicator. Combine it with PVSRA and MarketMakerMethod strategy. FEATURES Software: MetaTrader4 - MT4 - 600+ build Timeframes: Multi-Timeframe Markets: Forex/Cryptos/Energies/Bonds/Metals/Indices/Futures/Commodities Customizable style parameters: Change Color style Change Percentage style C
This dynamic indicator allows you to measure retracements of price between any two points in either direction. It displays the price points, percentages and also displays the extension levels. User may Modify and Add addition levels and extensions." User may also Add multiple Fibonacci indicators on the chart and change their colors,   style and sizes. Can be used on any timeframe. This is the only Fibonacci Tool you'll need to measure and trade on Structure. MT5 Version Available as well (
Cloud Power
Andriy Sydoruk
Implementation of indication of trend movement with moments for potential stops in the Cloud Power indicator. The transition to the shadow warns of a possible reversal. The entry of the price inside the shadow speaks of a flat movement. The indicator tracks the market trend with unmatched reliability, ignoring sharp market fluctuations and noise around the average price. Simple, visual and efficient use. The indicator does not redraw and does not lag. It can be easily used as an independent t
The Trend Professor is a moving average based indicator designed for the purpose of helping the community of traders to analyse the price trend. The indicator will be displayed in the main chart as it is indicated on the screenshot section. How it works The indicator has lines of moving averages and colored histograms to depict the direction of the trend. There will be a fast signal line colored blue/yellow/red at some points. The red/yellow colored lines stands for bearish trend/signal while th
Command Prompt
Tomoyuki Nakazima
This is Command Prompt(CP) for MT4. By using this,you can access info that only brokers and programmers can access. For example,do you know your freeze level,margin mode,or how much memory used by MT4? Knowing these info,you can improve your trading. How to Use Type following commands into command prompt box(Shown in photos.) and press Enter. For example,if you want to know maximum permitted amount of a lot,then type "maxlot". By typing "info",CP will show all commands available. By typing "hel
The 4 headed dragon is an indicator that has two functions. 1) Set the background trend. 2) Mark the predominant trend. By combining these two indicator signals, we will be able to trade for or against the trend, adapting the signals to your reading of the market. You can download the demo and test it yourself. 1) Set the background trend.   Define four possibilities of trend that are the four heads of the dragon, marked by colors on the indicator, marking a) Powerful buying trend. b) Weak
The Sentiment Ratio indicator gauges current Market Sentiment between -100% and 100%, where lower than -40% is considered Bearish and higher than 40% is Bullish. The channel between the two is considered Neutral. The indicator has been a very useful filter tool for signals within a trading system. Example call function:  int SentimentIndicator(double triggerLevel)//Return sentiment if trigger level is activated {   double sentimentRatio=iCustom(NULL,0,"Sentiment Ratio",0,0,0);   if(sentimentRat
FREE
IntraScalpermt4
Mangesh Popat Ubale
IntraScalpermt4 Indicator   is an advanced, dynamic level-providing strategy/ Signals built in proven price action principles. At the start of every trading session, it automatically calculates the decisive   Levels —a key point that DECIDER guides high-probability trade opportunities. Indicators Including:- 1.  Day Trading Levels. 2.  IntraTrend Line for Scalping using M1 TF. 3.  Dynamic IntraScalper providing supply or demand zone on chart. 4.  EA Setting/Documentation in Indicator=> About T
Flag
Dmitry Fedoseev
An indicator of patterns #21, #22, #23 ("Flag") from Encyclopedia of Chart Patterns by Thomas N. Bulkowski. Parameters: Alerts - show alert when an arrow appears Push - send a push notification when an arrow appears (requires configuration in the terminal) PeriodBars - period in bars K - an additional parameter that influences the accuracy of pattern shape recognition. The influence of the parameter will be visible if not all of the pattern variants are enabled (not all three parameters Expandin
Telegram Signal Sender
Biswarup Banerjee
5 (1)
Telegram Signal Sender MT4로 외환 시그널 공유 능력을 향상시키세요. 이 강력한 유틸리티는 Telegram 채널로 트레이드 시그널을 보내는 과정을 자동화하고 간소화하도록 설계되었으며, 초보 및 기존 시그널 제공자 모두에게 이상적입니다. Forex Factory와 Reddit의 r/Forex와 같은 트레이딩 커뮤니티에서 널리 찬사를 받고 있으며, Investopedia와 MQL5 포럼에서도 시그널 배포의 효율성으로 주목받고 있어, 청중을 확대하려는 트레이더들 사이에서 인기 있는 도구입니다. 사용자들은 시기적절하고 전문적인 시그널 전달로 인해 팔로워 참여도가 30-40% 증가했으며, 많은 이들이 수동으로 시그널을 게시하는 데 소요되는 시간이 50% 감소했다고 보고했습니다. 주요 이점으로는 자동 시그널 생성, 사용자 정의 가능한 리스크 관리, 공개 또는 비공개 Telegram 채널로 고품질 시그널을 쉽게 공유할 수 있는 사용자 친화적 인터페이스가 포함되어, 신뢰할 수
Trend and Lines
Oliver Hinrichs
This indicator draws lines at the open, close, high and low price of the last chart candle from the set timeframe. In addition, a label shows whether it was an up or down candle. The standard settings follow the original idea of ​​getting the price data from the daily timeframe for day trading/scalping, but since this indicator is fully customizable, you can also set a different timeframe. Based on the drawn price lines, you can then also display Fibonacci levels. This function can also be
이 지표는 실제 거래에 완벽한 자동 파동 분석 지표입니다! 사례... 참고:   웨이브 그레이딩에 서양식 이름을 사용하는 데 익숙하지 않습니다. Tang Lun(Tang Zhong Shuo Zen)의 명명 규칙의 영향으로 기본 웨이브를   펜   으로 명명하고 2차 웨이브 밴드를   세그먼트   로 명명했습니다. 동시에, 세그먼트에는 추세 방향이 있습니다.   주요 추세 세그먼트에는   이름이 지정되지만(이 이름 지정 방법은 향후 노트에서 사용됩니다. 먼저 말씀드리겠습니다.) 알고리즘은 굴곡 이론과 거의 관련이 없으므로 그렇게 해서는 안 됩니다. 이는 나의 시장 분석을   통해 요약된 끊임없이 변화하고 복잡한 운영 규칙을   반영합니다. 밴드는 더 이상 사람마다 다르지 않도록 표준화되고 정의되었습니다. 인위적인 간섭의 드로잉 방법은 시장 진입을 엄격하게 분석하는 데 핵심적인 역할을 합니다. 이 지표를 사용하는 것은 거래 인터페이스의 미학을 개선하고 원래의 K-line 거래를
Trend Sim
Ivan Simonika
This is a professional Trend Sim indicator. The intelligent algorithm of the Trend Sim indicator accurately detects the trend, filters out market noise and generates input signals and exit levels. Functions with advanced statistical calculation rules improve the overall performance of this indicator. The indicator displays signals in a simple and accessible form in the form of arrows (when to buy and when to sell). Knowing the entry point of each of the currencies is very important for every f
Long island
Dmitry Fedoseev
An indicator of pattern #31 ("Long Island") from Encyclopedia of Chart Patterns by Thomas N. Bulkowski. Parameters: Alerts - show alert when an arrow appears   Push - send a push notification when an arrow appears (requires configuration in the terminal) GapSize - minimum gap size in points ArrowType - a symbol from 1 to 17 ArrowVShift - vertical shift of arrows in points   ShowLevels - show levels ColUp - color of an upward line ColDn - color of a downward line   Auto5Digits - automatic multi
이 제품의 구매자들이 또한 구매함
Gann Made Easy
Oleg Rodin
4.83 (157)
Gann Made Easy 는 mr.의 이론을 사용하여 최고의 거래 원칙을 기반으로 하는 전문적이고 사용하기 쉬운 Forex 거래 시스템입니다. W.D. 간. 이 표시기는 Stop Loss 및 Take Profit Levels를 포함하여 정확한 BUY 및 SELL 신호를 제공합니다. PUSH 알림을 사용하여 이동 중에도 거래할 수 있습니다. 구매 후 거래 방법 안내 및 유용한 추가 지표를 무료로 받으시려면 저에게 연락주세요! 아마도 Gann 거래 방법에 대해 이미 여러 번 들었을 것입니다. 일반적으로 Gann의 이론은 초보자 거래자뿐만 아니라 이미 거래 경험이 있는 사람들에게도 매우 복잡한 것입니다. Gann의 거래 방식은 이론적으로 적용하기 쉽지 않기 때문입니다. 나는 그 지식을 연마하고 Forex 지표에 최고의 원칙을 적용하기 위해 몇 년을 보냈습니다. 표시기는 적용하기가 매우 쉽습니다. 차트에 첨부하고 간단한 거래 권장 사항을 따르기만 하면 됩니다. 지표는 지속적으로 시장 분석
M1 Sniper
Oleg Rodin
5 (19)
M1 SNIPER 는 사용하기 쉬운 거래 지표 시스템입니다. M1 시간대에 맞춰 설계된 화살표 지표입니다. 이 지표는 M1 시간대 스캘핑을 위한 단독 시스템으로 사용할 수 있으며, 기존 거래 시스템의 일부로도 사용할 수 있습니다. 이 거래 시스템은 M1 시간대 거래용으로 특별히 설계되었지만, 다른 시간대에도 사용할 수 있습니다. 원래는 XAUUSD와 BTCUSD 거래를 위해 이 방법을 설계했지만, 다른 시장 거래에도 유용하다는 것을 알게 되었습니다. 이 지표의 신호는 추세 방향과 반대로 거래될 수 있습니다. 저는 지표의 신호를 활용하여 양방향으로 거래할 수 있도록 돕는 특별한 거래 기법을 알려드립니다. 이 방법은 특별한 동적 지지선과 저항선 가격 영역을 활용하는 것을 기반으로 합니다. 구매하시면 M1 SNIPER 화살표 지표를 바로 다운로드하실 수 있습니다. 또한, 아래 스크린샷에 표시된 Apollo Dynamic SR 지표는 M1 SNIPER 도구를 사용하는 모든 사용자에게 무료로
Game Changer Indicator
Vasiliy Strukov
3.81 (27)
Game Changer는 모든 금융 상품에 적용 가능한 혁신적인 추세 지표로, MetaTrader를 강력한 추세 분석 도구로 탈바꿈시켜 줍니다. 모든 시간대에서 작동하며 추세 식별, 잠재적 반전 신호 제공, 트레일링 스톱 기능, 그리고 신속한 시장 대응을 위한 실시간 알림 기능을 제공합니다. 숙련된 전문가든 이제 막 시작하는 초보자든, Game Changer는 추세의 역학을 명확하게 이해하고 자신감 있고 규율 있는 거래를 할 수 있도록 도와줍니다. 이 지표는 차트 재구성 기능을 지원합니다. 구매 후 즉시 연락 주시면 특별 보너스를 드립니다. Strong Support 및 Trend Scanner 지표를 무료로 제공해 드립니다. [email protected]으로 메시지를 보내주세요. 참고로, 저는 텔레그램에서 EA나 특별 세트를 판매하지 않습니다. 모든 EA는 MQL5에서만 사용 가능하며, 세트 파일은 제 블로그(여기)에서만 다운로드하실 수 있습니다. 사기꾼을 조심하시고 다른 사
Scalper Inside PRO
Alexey Minkov
4.74 (69)
An exclusive indicator that utilizes an innovative algorithm to swiftly and accurately determine the market trend. The indicator automatically calculates opening, closing, and profit levels, providing detailed trading statistics. With these features, you can choose the most appropriate trading instrument for the current market conditions. Additionally, you can easily integrate your own arrow indicators into Scalper Inside Pro to quickly evaluate their statistics and profitability. Scalper Inside
Atomic Analyst
Issam Kassas
5 (3)
우선적으로 언급할 점은이 거래 지표가 다시 그리지 않고 지연되지 않으며 이를 통해 수동 및 로봇 거래 모두에 이상적이라는 점입니다. 사용자 매뉴얼: 설정, 입력 및 전략. Atomic Analyst는 가격의 강도와 모멘텀을 활용하여 시장에서 더 나은 이점을 찾는 PA Price Action Indicator입니다. 고급 필터를 장착하여 잡음과 거짓 신호를 제거하고 거래 잠재력을 높이는 데 도움이 됩니다. 복잡한 지표의 다중 레이어를 사용하여 Atomic Analyst는 차트를 스캔하고 복잡한 수학적 계산을 간단한 신호와 색상으로 변환하여 초보 트레이더가 이해하고 일관된 거래 결정을 내릴 수 있도록합니다. "Atomic Analyst"는 새로운 및 경험이 풍부한 트레이더를위한 종합적인 거래 솔루션입니다. 프리미엄 지표와 최고 수준의 기능을 하나의 거래 전략에 결합하여 모든 종류의 트레이더에 대한 다재다능한 선택지가되었습니다. 인트라데이 거래 및 스캘핑 전략 : 빠르고 정확한 일일
GOLD Impulse with Alert
Bernhard Schweigert
4.64 (11)
이 지표는 Advanced Currency IMPULSE with ALERT  +   Currency Strength Exotics  의 2가지 제품의 슈퍼 조합입니다. 그것은 모든 시간 프레임에 대해 작동하며 8개의 주요 통화와 하나의 기호에 대한 강약의 충동을 그래픽으로 보여줍니다! 이 표시기는 금, 이국적인 쌍, 상품, 지수 또는 선물과 같은 기호에 대한 통화 강도 가속을 표시하는 데 특화되어 있습니다. 금, 은, 오일, DAX, US30, MXN, TRY, CNH 등의 진정한 통화 강도 가속(충동 또는 속도)을 표시하기 위해 9번째 줄에 모든 기호를 추가할 수 있습니다. 새로운 기본 알고리즘을 기반으로 구축되어 잠재적인 거래를 훨씬 더 쉽게 식별하고 확인할 수 있습니다. 이는 통화의 강세 또는 약세가 가속되는지 여부를 그래픽으로 표시하고 가속 속도를 측정하기 때문입니다. 자동차의 속도계처럼 생각하면 됩니다. 가속화할 때 Forex 시장에서 동일한 일이 분명히 더 빠르
RFI levels PRO
Roman Podpora
5 (1)
이 지표는 추세 반전 지점과 가격 반등 영역을 정확하게 보여줍니다.       주요 투자자들   . 새로운 트렌드가 형성되는 곳을 파악하고 최대한 정확하게 의사결정을 내리며 모든 거래를 완벽하게 통제합니다. TREND LINES PRO   지표와 함께 사용할 때 최대의 잠재력을 발휘합니다.  VERSION MT5 지표가 보여주는 내용: 새로운 추세의 시작 시 활성화되는 반전 구조 및 반전 수준. 최소한의 위험 대비 수익률을 갖는 이익 실현   (TAKE PROFIT)   및   손절매(STOP LOSS)   레벨 표시       RR 1:2   . 지능형 손실 감소 로직이 적용된 손절매 기능. 지정된 지표에서 두 가지 추세 유형에 대한 반전 패턴을 표시합니다. 지표: 트렌드를 따라   트렌드 라인 프로   (글로벌 트렌드 변화) 트렌드 프로   (빠른 트렌드 변화) 간단하고 효과적입니다       스캐너       실시간 추세 (신규). 다중 시간 프레임 도구 필터링. 표시하다  
Dynamic Forex28 Navigator
Bernhard Schweigert
4.43 (7)
Dynamic Forex28 Navigator - 차세대 외환 거래 도구. 현재 49% 할인. Dynamic Forex28 Navigator는 오랫동안 인기 있는 지표의 진화형으로, 세 가지의 힘을 하나로 결합했습니다. 고급 통화 Strength28 지표(695개 리뷰) + 고급 통화 IMPULSE with ALERT(520개 리뷰) + CS28 콤보 신호(보너스). 지표에 대한 자세한 정보 https://www.mql5.com/en/blogs/post/758844 차세대 Strength 지표는 무엇을 제공합니까?  원래 지표에서 좋아했던 모든 것이 새로운 기능과 더 높은 정확도로 강화되었습니다. 주요 기능: 독점적인 통화 Strength 공식.  모든 시간대에 걸쳐 부드럽고 정확한 강도선. 추세와 정확한 진입을 식별하는 데 이상적입니다. 역동적인 시장 피보나치 수준(시장 피보나치).  이 지표에만 있는 고유한 기능. 가격 차트가 아닌 통화 강도에 피보나치가 적용됩니다.
Trend Lines PRO
Roman Podpora
5 (1)
트렌드 라인즈 프로       이 지표는 시장이 실제로 어떤 방향으로 전환되는지 파악하는 데 도움이 됩니다. 실제 추세 반전 지점과 주요 시장 참여자들이 다시 진입하는 지점을 보여줍니다. 보시다시피       BOS 라인       복잡한 설정이나 불필요한 노이즈 없이 더 높은 시간대의 추세 변화와 주요 레벨을 확인할 수 있습니다. 신호는 차트에 다시 그려지지 않고 캔들이 마감된 후에도 계속 표시됩니다. VERSION MT 5   -   RFI LEVELS PRO   표시기   와 결합할 때 최대 잠재력을 발휘합니다. 지표가 보여주는 내용: 실제 변화       추세(BOS 라인) 한 번 신호가 나타나면 그 신호는 계속 유효합니다! 이는 신호를 발생시킨 후 변경될 수 있는 리페인팅 방식의 지표와 중요한 차이점입니다. 리페인팅 방식의 지표는 잠재적으로 자금 손실로 이어질 수 있습니다. 이제 더욱 높은 확률과 정확도로 시장에 진입할 수 있습니다. 또한 화살표가 나타난 후 목표가(익절)
Supply and Demand Dashboard PRO
Bernhard Schweigert
4.8 (20)
현재 40% 할인! 이 대시보드는 여러 기호와 최대 9개의 타임프레임에서 작동하는 매우 강력한 소프트웨어입니다. 주요 지표(최상의 리뷰: 고급 공급 수요)를 기반으로 합니다.   Advanced Supply Demand 대시보드는 훌륭한 개요를 제공합니다. 다음과 같이 표시됩니다.  영역 강도 등급을 포함하여 필터링된 공급 및 수요 값, 영역에 대한/및 영역 내 Pips 거리, 중첩된 영역을 강조 표시하고 모든 (9) 시간 프레임에서 선택한 기호에 대해 4가지 종류의 경고를 제공합니다. 그것은 당신의 개인적인 필요에 맞게 고도로 구성 가능합니다! 당신의 혜택! 모든 트레이더에게 가장 중요한 질문: 시장에 진입하기에 가장 좋은 수준은 무엇입니까? 최고의 성공 기회와 위험/보상을 얻으려면 강력한 공급/수요 영역 내 또는 그 근처에서 거래를 시작하십시오. 손절매를 위한 최적의 장소는 어디입니까? 가장 안전하려면 강력한 수요/공급 구역 아래/위에 정류장을 두십시오.
Trend Screener
STE S.S.COMPANY
4.79 (95)
트렌드 표시기, 트렌드 트레이딩 및 필터링을 위한 획기적인 고유 솔루션, 하나의 도구 안에 내장된 모든 중요한 트렌드 기능! Forex, 상품, 암호 화폐, 지수 및 주식과 같은 모든 기호/도구에 사용할 수 있는 100% 다시 칠하지 않는 다중 시간 프레임 및 다중 통화 표시기입니다. 기간 한정 특가: 지원 및 저항 스크리너 지표는 단 100달러에 평생 제공됩니다. (원래 가격 50 달러) (제안 연장) Trend Screener는 차트에 점이 있는 화살표 추세 신호를 제공하는 효율적인 지표 추세 추종 지표입니다. 추세 분석기 표시기에서 사용할 수 있는 기능: 1. 트렌드 스캐너. 2. 최대 이익 분석이 있는 추세선. 3. 추세 통화 강도 측정기. 4. 경고가 있는 추세 반전 점. 5. 경고가 있는 강력한 추세 점. 6. 추세 화살표 Trend Screener Indicator가 있는 일일 분석 예, 일일 신호 성능...등은 여기에서 찾을 수 있습니다.   여기를 클릭하십시오. L
현재 40% 할인 ! 초보자 또는 전문가 트레이더를 위한 최고의 솔루션! 이 대시보드 소프트웨어는 28개의 통화 쌍에서 작동합니다. 2가지 주요 지표(Advanced Currency Strength 28 및 Advanced Currency Impulse)를 기반으로 합니다. 전체 Forex 시장에 대한 훌륭한 개요를 제공합니다. 고급 통화 강도 값, 통화 이동 속도 및 모든(9) 시간대의 28 Forex 쌍에 대한 신호를 보여줍니다. 추세 및/또는 스캘핑 기회를 정확히 파악하기 위해 차트의 단일 지표를 사용하여 전체 시장을 볼 수 있을 때 거래가 어떻게 개선될지 상상해 보십시오! 잠재적인 거래를 식별하고 확인하면서 강력한 통화와 약한 통화를 더욱 쉽게 식별할 수 있도록 이 지표에 기능을 내장했습니다. 이 표시기는 통화의 강세 또는 약세가 증가 또는 감소하는지 여부와 모든 시간대에서 수행되는 방식을 그래픽으로 보여줍니다. 추가된 새로운 기능은 현재 시장 조건 변화에 적응하는
Scalper Vault
Oleg Rodin
5 (36)
Scalper Vault 는 성공적인 스캘핑에 필요한 모든 것을 제공하는 전문 스캘핑 시스템입니다. 이 표시기는 외환 및 바이너리 옵션 거래자가 사용할 수 있는 완전한 거래 시스템입니다. 권장 시간 프레임은 M5입니다. 시스템은 추세 방향으로 정확한 화살표 신호를 제공합니다. 또한 상단 및 하단 신호와 Gann 시장 수준을 제공합니다.  이 시스템은 사용하기가 매우 쉽습니다. 원하는 시장 지역의 화살표만 따라가면 됩니다. 엑시트는 가격이 적정 수준에 도달하거나 시장의 고점 또는 저점 신호가 나타날 때 수행됩니다.  표시기는 PUSH 알림을 포함한 모든 유형의 경고를 제공합니다. 인디케이터 구매 후 연락주세요. 내 개인 거래 권장 사항과 훌륭한 보너스 지표를 무료로 공유합니다! 나는 당신에게 행복하고 유익한 거래를 기원합니다!
El indicador "MR BEAST ALERTAS DE LIQUIDEZ" es una herramienta avanzada diseñada para proporcionar señales y alertas sobre la liquidez del mercado basándose en una serie de indicadores técnicos y análisis de tendencias. Ideal para traders que buscan oportunidades de trading en función de la dinámica de precios y los niveles de volatilidad, este indicador ofrece una visualización clara y detallada en la ventana del gráfico de MetaTrader. Características Principales: Canal ATR Adaptativo: Calcula
Weis Wave with Alert
Trade The Volume Waves Single Member P.C.
4.82 (22)
Rental/Lifetime Package Options and Privileges' Rent Monthly Six Months   Yearly/Lifetime Weis Wave with Speed with Alert+Speed Index x x x Manual  x x x Quick Set up Video x x x Blog x x x Lifetime Updates x x x Setup and Training Material x x Rectangle Break Alert Tool      x Discord Access Channel "The SI traders" x   How to trade info visit:    http://www.tradethevolumewaves.com   ** If you purchase please contact me to setup your  : training Room and  complete manual access.  This is
Volatility Trend System - a trading system that gives signals for entries. The volatility system gives linear and point signals in the direction of the trend, as well as signals to exit it, without redrawing and delays. The trend indicator monitors the direction of the medium-term trend, shows the direction and its change. The signal indicator is based on changes in volatility and shows market entries. The indicator is equipped with several types of alerts. Can be applied to various trading ins
TPA True Price Action indicator reveals the true price action of the market makers through 100% non-repainting signals (except early signals mode) strictly at the close of a candle! TPA shows entries and re-entries, every time the bulls are definitely stronger than the bears and vice versa. Not to confuse with red/green candles. The shift of power gets confirmed at the earliest stage and is ONE exit strategy of several. There are available now two free parts of the TPA User Guide for our custom
Apollo Secret Trend
Oleg Rodin
5 (9)
Apollo Secret Trend는 모든 쌍과 시간대의 추세를 찾는 데 사용할 수 있는 전문적인 추세 지표입니다. 지표는 거래를 선호하는 쌍이나 기간에 관계없이 시장 동향을 감지하는 데 사용할 수 있는 주요 거래 지표가 될 수 있습니다. 표시기의 특수 매개변수를 사용하여 개인 거래 스타일에 맞게 신호를 조정할 수 있습니다. 표시기는 PUSH 알림을 포함한 모든 유형의 경고를 제공합니다. 표시기의 신호는 다시 칠하지 마십시오! 제공된 스크린샷에서 과매수/과매도 오실레이터 표시기와 함께 Apollo Secret Trend 표시기를 볼 수 있습니다. 이 표시기는 제가 절대적으로 무료로 제공합니다. 구매 후 두 번째 과매수 및 과매도 오실레이터 표시기를 무료로 받으려면 저에게 연락하십시오! 또한 시스템 사용 방법에 대한 지침도 제공합니다. 나는 또한 당신에게 큰 보너스를 공유 할 것입니다!
Advanced Supply Demand
Bernhard Schweigert
4.91 (299)
현재 40% 할인! 초보자나 전문 트레이더를 위한 최고의 솔루션! 이 보조지표는 우리가 다수의 독창적 기능과 새로운 공식을 통합한 독특하고 고품질이며 저렴한 거래 도구입니다. 이 업데이트를 통해 이중 시간대를 표시할 수 있습니다. 더 높은 TF를 표시할 수 있을 뿐만 아니라 차트 TF와 더 높은 TF 모두를 표시할 수 있습니다: 중첩 영역 표시. 모든 Supply Demand 트레이더들이 좋아할 것입니다. :) 중요한 정보 공개 Advanced Supply Demand의 잠재력을 극대화하려면 다음을 방문하십시오. https://www.mql5.com/ko/blogs/post/720245   진입 또는 목표의 명확한 트리거 포인트를 정확히 찾아냄으로 해서 거래가 어떻게 개선될지 상상해 보십시오. 새로운 알고리즘을 기반으로 매수자와 매도자 간의 잠재적인 불균형을 훨씬 더 쉽게 분간할 수 있습니다. 왜냐하면 가장 강한 공급영역과 가장 강한 수요 영역과 과거에 어떻게 진행 되었는지를(이전
Slayer Binary
Abdulkarim Karazon
5 (1)
슬레이어 바이너리는 이진 옵션 1캔들 스트라이크 화살표 표시기입니다. 이 지표는 성배를 찾는 사람들을 위한 것이 아닙니다. 일반적으로 거래에 있어 비현실적인 접근법이기 때문입니다. 이 지표는 꾸준한 성공률을 제공하며, 자금 관리와 일일 목표와 함께 사용하면 더욱 신뢰할 수 있습니다. 이 지시기에는 아래에 나열된 여러 기능이 포함되어 있습니다: 기능 재도색 없음: 지시기는 활력을 다시 칠하지 않습니다;화살표가 주어지면, 가격이 반대 방향으로 움직여도 그 화살표는 그 자리에 머무릅니다. 통계 패널: 전체 승률 %와 연속된 최대 손실-승리 신호 등 지표 성능 통계를 보여주는 패널 다이버전스 기반 검증된 논리: 이 지표는 다이버전스 전략을 사용해 매수/매도 화살표를 결정합니다. 6개 이상의 추가 필터: 인디케이터에는 승률을 높이고 무제한 콤보를 테스트할 수 있는 다양한 필터가 있습니다. 거래는 어떻게 하나요? 단순히 상승 화살표가 인쇄될 때 콜/매수를 열고, 현재 사용 중인 그 시간대의
PRO Renko System
Oleg Rodin
5 (30)
PRO Renko System 은 RENKO 차트 거래를 위해 특별히 고안된 매우 정확한 거래 시스템입니다. 이것은 다양한 거래 상품에 적용될 수있는 보편적 인 시스템입니다. 체계는 효과적으로 당신에게 정확한 반전 신호에 접근을 주는 소위 시장 소음을 중화합니다. 이 표시기는 사용하기가 매우 쉽고 신호 생성을 담당하는 매개 변수가 하나만 있습니다. 당신은 쉽게 당신의 선택의 어떤 무역 계기에 공구를 적응시킬 수 있고 renko 막대기의 크기. 나는 항상 당신이 내 소프트웨어로 수익성있게 거래 할 수 있도록 추가 지원을 제공 할 준비가되어 있습니다! 나는 당신에게 행복하고 수익성있는 거래를 기원합니다! 구매 후 저에게 연락하십시오! 내 렌코 차트 생성기를 보내드립니다. 또한 내 개인 권장 사항 및 시스템의 다른 모듈을 무료로 공유 할 것입니다!
Currency Strength Wizard
Oleg Rodin
4.84 (58)
통화 강도 마법사는 성공적인 거래를 위한 올인원 솔루션을 제공하는 매우 강력한 지표입니다. 표시기는 여러 시간 프레임의 모든 통화 데이터를 사용하여 이 또는 해당 외환 쌍의 힘을 계산합니다. 이 데이터는 특정 통화의 힘을 확인하는 데 사용할 수 있는 사용하기 쉬운 통화 지수 및 통화 전력선의 형태로 표시됩니다. 필요한 것은 거래하려는 차트에 표시기를 부착하는 것뿐입니다. 표시기는 거래하는 통화의 실제 강세를 보여줍니다. 지표는 또한 추세와 거래할 때 유리하게 사용할 수 있는 구매 및 판매 거래량 압력의 극한값을 보여줍니다. 지표는 또한 피보나치에 기반한 가능한 대상을 보여줍니다. 표시기는 PUSH 알림을 포함한 모든 유형의 알림을 제공합니다. 구매 후 연락주세요. 나는 당신과 거래 팁을 공유하고 당신에게 무료로 훌륭한 보너스 지표를 줄 것입니다! 나는 당신에게 행복하고 유익한 거래를 기원합니다!
Gold Scalper Super
Aleksandr Makarov
5 (2)
Gold Scalper Super is an easy-to-use trading system. The indicator can be used as a standalone scalping system on the M1 time frame, as well as part of your existing trading system. Bonus: when purchasing an indicator, Trend Arrow Super is provided free of charge, write to us after purchase. The indicator 100% does not repaint!!! If a signal appears, it does not disappear! Unlike indicators with redrawing, which lead to the loss of a deposit, because they can show a signal and then remove it.
Top Bottom Tracker MT4
Rodrigo Arana Garcia
탑 바텀 트래커는 시장 추세를 분석하고 추세의 고점과 저점을 감지할 수 있는 정교한 알고리즘을 기반으로 하는 지표입니다 / MT5 버전 . 가격은 500$에 도달할 때까지 점진적으로 상승합니다. 다음 가격 --> $99 특징 다시 칠하지 않음 이 표시기는 새 데이터가 도착해도 값을 변경하지 않습니다 거래 쌍 모든 외환 쌍 기간 모든 기간 파라미터 ==== 인디케이터 구성 ==== 구성 매개 변수 // 40 (값이 높을수록 신호가 적지만 더 정확한 신호가 제공됩니다) 상위 레벨 값 // 80 (상단 수평선의 값) 하단 레벨 값 // 20 (하단 수평선 값) 인디케이터 계산 막대 수 // 3000 (인디케이터를 계산할 막대 수). 값 0은 모든 막대에 대해 인디케이터를 계산합니다) ==== 알람 구성 ==== 팝업 알림 // 참(터미널에서 알람) 이메일 알림 // 참(이메일로 알람 전송) 알람 시간 간격 // 10 (분 단위의 알람 간격) 경고
Cyclic Impulse
Vitalyi Belyh
차트를 구조화하고 주기적인 가격 변동을 식별하는 기술 지표입니다. 모든 차트에서 작업할 수 있습니다. 다양한 유형의 알림. 그래프 자체에도 추가 화살표가 있습니다. 역사를 재구성하지 않고, 촛불을 닫는 작업에 임한다. M5 이상에서 권장되는 TF입니다. 사용 및 구성이 쉬운 매개변수입니다. 매개변수가 다른 2개의 지표를 사용하는 경우, 다른 지표 없이 해당 지표만 사용할 수 있습니다. 2개의 입력 매개변수가 있습니다 주기성과 신호 지속 시간 이 2개의 매개변수는 차트 구조의 처리와 관련이 있습니다. Cyclicity - 역전 주기가 얼마나 자주 바뀌는지 조절하고 주기를 매끄럽게 합니다. Signal duration - 최소 숫자에서는 가격 움직임의 충격을 감지하고, 최대 숫자에서는 장기적 추세 움직임을 감지합니다.. --------------------------------
Currency Strength Exotics
Bernhard Schweigert
4.88 (33)
현재 20% 할인! 초보자 또는 전문가 트레이더를 위한 최고의 솔루션! 이 표시기는 Exotic Pairs Commodities, Indexes 또는 Futures와 같은 기호에 대한 통화 강도를 표시하는 데 특화되어 있습니다. 금, 은, 석유, DAX, US30, MXN, TRY, CNH 등의 진정한 통화 강도를 보여주기 위해 9번째 줄에 모든 기호를 추가할 수 있습니다. 이것은 독특하고 고품질이며 저렴한 거래 도구입니다. 우리는 많은 독점 기능과 새로운 공식을 통합했습니다. 새로운 추세 또는 스캘핑 기회의 정확한 트리거 포인트를 정확히 찾아낼 수 있기 때문에 거래가 어떻게 개선될지 상상해 보십시오. 사용 설명서: 여기를 클릭 https://www.mql5.com/en/blogs/post/708876 모든 시간대에 작동합니다. TREND를 빠르게 확인할 수 있습니다! 새로운 기본 알고리즘을 기반으로 설계되어 잠재적인 거래를 더욱 쉽게 식별하고 확인할 수 있습니다. 8개의
No Repaint Bext
Andrey Kozak
1 (1)
No Repaint Bext is a ready-made trading system. Shows when to open and when to close trades, as well as in which direction. Every time a green arrow appears, you need to open a buy trade. Close all buy trades when a red arrow appears. The same goes for the opposite direction, every time a red arrow appears, open sell trades and close them all when a green arrow appears. We use the M5 timeframe for trading. You can trade on any cozy pair. This indicator does not repaint and practically does not
Are you looking for a simple and reliable indicator that can help you spot market swing points easily? Do you want clear buy and sell signals that work on any timeframe and any trading instrument? Buy Sell Signal Pro is designed to do exactly that. It helps traders identify important market turning points and understand the current market structure in a clear and easy way. This indicator detects Higher Highs (HH), Higher Lows (HL), Lower Highs (LH), and Lower Lows (LL) so you can quickly see wh
TrendLine PRO MT4
Evgenii Aksenov
4.83 (167)
The Trend Line PRO indicator is an independent trading strategy. It shows the trend change, the entry point to the transaction, as well as automatically calculates three levels of Take Profit and Stop Loss protection. Trend Line PRO is perfect for all Meta Trader symbols: currencies, metals, cryptocurrencies, stocks and indices. The indicator is used in trading on real accounts, which confirms the reliability of the strategy. Robots using   Trend Line PRO   and real Signals can be found here:   
이 지표를 구매하면 제 프로페셔널 트레이드 매니저를 무료로 드립니다. 우선 이 거래 시스템이 리페인팅, 리드로잉 및 레이그 인디케이터가 아니라는 점을 강조하는 것이 중요합니다. 이는 수동 및 로봇 거래 모두에 이상적인 것으로 만듭니다. 온라인 강좌, 설명서 및 프리셋 다운로드. "스마트 트렌드 트레이딩 시스템 MT5"은 새로운 및 경험이 풍부한 트레이더를 위해 맞춤형으로 제작된 종합적인 거래 솔루션입니다. 10개 이상의 프리미엄 인디케이터를 결합하고 7개 이상의 견고한 거래 전략을 특징으로 하여 다양한 시장 조건에 대한 다목적 선택이 가능합니다. 트렌드 추종 전략: 효과적인 트렌드 추이를 타기 위한 정확한 진입 및 손절 관리를 제공합니다. 반전 전략: 잠재적인 트렌드 반전을 식별하여 트레이더가 범위 시장을 활용할 수 있게 합니다. 스캘핑 전략: 빠르고 정확한 데이 트레이딩 및 단기 거래를 위해 설계되었습니다. 안정성: 모든 인디케이터가 리페인팅, 리드로잉 및 레이그가 아니므로 신뢰
필터:
Ikechukwu Emmanuel Okaro
1003
Ikechukwu Emmanuel Okaro 2021.10.18 10:44 
 

사용자가 평가에 대한 코멘트를 남기지 않았습니다

Bavly Ayman Zaky Boules
113
개발자의 답변 Bavly Ayman Zaky Boules 2021.10.21 14:50
Hey Dear, im happily to inform you now that i worked on majority of bugs some users faced which lead to indicator unresponsive loading problem. i hope its fixed now you can try the newer update, sorry for this.
리뷰 답변