Super Volume

this indicator is the way to get success entery point it give you the movement of market  this indicator build base on Artificial intelligent of mix algorithms  

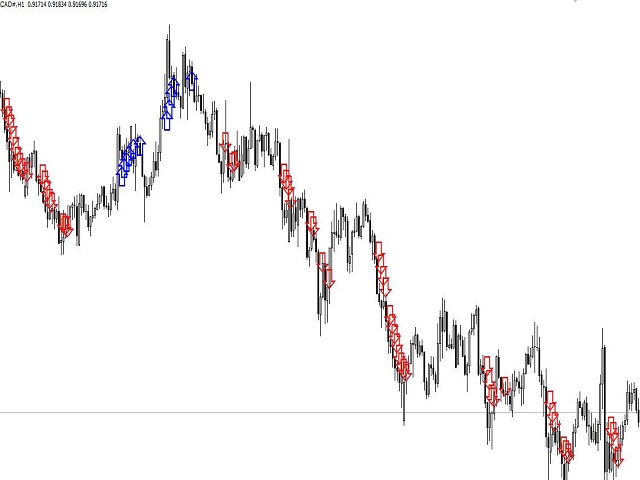
work on all time frames and all pairs important thing you need to take alook  on the signals on high time frame then apply the signals of lowest time frame (always take the first Arrow after close the candle on the chart  )

example if you want enter order on H1 time frame go take alook on D1 time frame and see the signalsit will tell you the direction down or up then return to the H1 and make order base on the signal  and it must the same direction with D1 signals

you can depend on this Indicator to make profit and you will see amazing results

TP and SL yo can use fibo Level or your looking to the chart and you can do it with this indicator by see the first arrow signals and put stoploss above it and put the take profit X2


추천 제품
BinaryScalping
Andrey Spiridonov
BinaryScalping is a professional indicator for trading binary options and scalping. The algorithm of the indicator is based on the calculation of pivot points for each time period separately, the location of the price of the trading instrument relative to the pivot points is analyzed and the probability of a trading operation is calculated. The indicator has a built-in filter of trading signals based on the global trend. The indicator is installed in the usual way and works with any trading inst
BinaryUniversal
Andrey Spiridonov
BinaryUniversal is a signal indicator for binary options and Forex. In its work, the indicator uses a complex algorithm for generating signals. Before forming a signal, the indicator analyzes volatility, candlestick patterns, important support and resistance levels. The indicator has the ability to adjust the accuracy of the signals, which makes it possible to apply this indicator for both aggressive and conservative trading. The indicator is set in the usual way, it works on any time period and
The Hurricane Cave Indicator shows different trade areas based on price action. It looks in the past and works out patterns that can enforce support and resistance as targets. When price breaks out of a trade area you can target just inside the next trade area. If you can't see the target just go to a slower time frame, it means the price hasn't been there for a long time. The Hurricane Cave Indicator is designed to be an add on to The Hurricane Forex Indicator also available in the Meta Trader
FREE
User Manual Download link: https://ontrd.com/our-books/ For all who are asking about indicator  ON Trade Numerology Station It obtain about 16 numerology strategies it make together completed unit control your trading . Basic strategies to work with it are 3 strategies statistics about them are the following : 1. RBA levels success rate more then 95%. 2. FF more then 96%  3.RBA SUN 98% We will not say 100 % as they are .. Ratio rates as following :  1.Rba levels more then 1/3 to 1/6 . 2.FF MORE
Clidro FX
Mahmood Abdur Rafey Siddiqui
Clidro FX is a complete trading system designed and developed by Auxrum Analytics targeting the EURUSD, USDJPY, and GBPUSD FX pairs. It is currently available to MetaTrader 4 users. The Clidro FX algorithm, along with the optimized money-management and order-management rules sets up the basis for excellent trading results consistently over an extended period of time. The fundamental premise of the system is that each FX pair displays its unique quantitative characteristics while oscillating thro
This indicator works on MT4 and is very easy to use. When you receive a signal from it, you wait for that candle with the signal to close and you enter your trade at the beginning of the next new candle . A red arrow means sell and a green arrow means buy. All arrows comes with Alert  like for easy identification of trade signal. Are you okay with that? 1 minute candle 1 minute expire
Towers
Yvan Musatov
Towers - Trend indicator, shows signals, can be used with optimal risk ratio. It uses reliable algorithms in its calculations. Shows favorable moments for entering the market with arrows, that is, using the indicator is quite simple. It combines several filters to display market entry arrows on the chart. Given this circumstance, a speculator can study the history of the instrument's signals and evaluate its effectiveness. As you can see, trading with such an indicator is easy. I waited for an a
Trend Flasher
Amarnath K M
Trend Flasher Trend is your friend is the age old saying quote in trading arena, there are though many ways to gauge the trend and its direction, more scientific measure and logically meaningful will be an ATR break outs to identify and spot the trend and its acceleration, so we created this easy to use trend identification panel and optimized super trend based multi time frame panel entry system to aid and help the traders to make their trading decision. Unique Features of Trend Flasher 1. H
Powerfull Scalper
Ellan Dirgantara Tholkhah
This product is optimally used for scalping. It is a trend following system, it understands that the trend is your friend. It takes advantage of the buying/selling after the pullback in continuation of the current trend wave.  It works by analyzing dynamic support and resistance, and is based on the Ichimoku Indicator variables which is know to be the most consistent & holistic indicator out there.  Settings can also be adjusted to suite the market conditions. -> can be adjusted for longer term
HFT Golden
Geethika Rasnayake Mudiyanselage
HFT Golden EA: Advanced Precision Trading System Welcome to the next generation of algorithmic trading excellence HFT Golden EA represents a sophisticated approach to modern trading, executing precision trades with exceptional profit potential, fixed stop-loss protection, and remarkably low drawdown.  Does not rely on any indicators — purely based on price and market mechanics. DOWNLOAD SETFILES     |   Setfile 1     The special price of $750 is available for the first 10 buyers only. Buy HFT G
MacdTrade
Evgeniy Zhdan
The Expert Advisor uses the dissonance analysis strategy between the wave formation of the price movement of the lower level and the fractals of two consecutive upper levels. The data of the MACD indicator are confirmatory and decisive when making a decision to enter a transaction. Each trading position has a stop loss and take profit. Dangerous trading methods are not used. The Expert Advisor has a non-linear trailing stop system. Recommended trading tools for default settings: 5M: EURGBP,
Milch Cow Extra
Mohamed Nasseem
EA is primarily a Hedging and Multiples Strategy. It support to seize every opportunity in any direction as MILCH COW MIX but with multiple profit results without increasing the risk. Milch Cow Mix EA starts to open Hedge at first level only But EA opens Hedge at every level Not just opens the deals, but chooses the right time to close the open positions to begin trading again. We recommend the use of an expert with a pair of high volatility for the currency, such as GBPAUD, AUDCAD Experts inter
Scalping Entry Points - is a manual trading system that can adjust to price movements and give signals to open trades without redrawing. The indicator determines the direction of the trend by the central level of support and resistance. The dot indicator provides signals for entries and exits.  Suitable for manual intraday trading, scalping and binary options. Works on all time frames and trading instruments. The indicator gives several types of alerts. How to use the product The blue line det
BSA Indicator
Ahmet Metin Yilmaz
BSA indicator is a ZigZag based indicator. This indicator is used to find the reversal level of the price. You can use the existing risk ratio and calculation timeframe in the entries by optimizing them according to your usage preference.  In lower time frames, the indicator can repaint. For healthier results, you can detect the least repainting by observing for a while according to the graphic you will apply.
Limitless MT4
Dmitriy Kashevich
Limitless MT4 is a universal indicator suitable for every beginner and experienced trader. works on all currency pairs, cryptocurrencies, raw stocks Limitless MT4 - already configured and does not require additional configuration And now the main thing Why Limitless MT4? 1 complete lack of redrawing 2 two years of testing by the best specialists in trading 3 the accuracy of correct signals exceeds 80% 4 performed well in trading during news releases Trading rules 1 buy signal - the ap
브레이크아웃 프로 스캘퍼 솔루션 이 표시기는 RPTrade Pro 솔루션 시스템의 일부입니다. Breakout Pro Scalper Solution은 Price Action, Dynamic Support 및 Resistance를 사용하는 일일 추세 지표입니다. 누구나 사용할 수 있도록 설계되었으며 거래의 절대 초보자도 사용할 수 있습니다. 다시 칠하지 마십시오. 표시는 닫기에서 닫기로 제공됩니다. 단독으로 사용하도록 설계되어 다른 표시기가 필요하지 않습니다. 당신에게 하루의 시작에 추세와 잠재적인 이익실현을 제공합니다. 특정 그래프는 이력 데이터에 따른 잠재적 이익을 보여줍니다. 어떻게 작동합니까 Breakout Pro Scalper Solution은 가격 조치 및 동적 지원 및 저항과 결합된 브레이크아웃 전략을 사용합니다. 야간 추세와 변동성은 다음날에 사용할 것으로 분석됩니다. 이 분석에서 브레이크아웃 한계(파란색 및 진한 주황색 선)와 이익실현(Take Profit)이
Diamond Grail
Dmitriy Kashevich
The universal indicator Diamond Grail which received such a name is not so simple! The indicator has been tested for over a year by our experts! One of the best arrow indicators that is perfect for binary options and forex trading, If you trade on binary options, the best ragtime for it is from 3 minutes to a maximum of 5 minutes An arrow appears on the previous candle. If you trade forex, then the opening time from candle to candle Forex result From 40 To 1324 pips! Profitability of Diam
LDS Scalper
Justice Chinemelum Clement
PLEASE LEAVE US A 5-STAR REVIEW   LDS Scalper User Manual+ Extra LDS CSDIF INDICATOR + Training Videos   ABOUT LDS SCALPER INDICATOR STRATEGY Built on  15+ years of trading experience. LDS Scalper is a very powerful  trading indicator for scalping strategy, returns very high accuracy rate in forex, futures, cryptocurrencies, stocks and indices. This indicator displays arrow signals based on price action information with high accuracy. The LDS Scalper Indicator strategy when applied can turn a ne
NostradamusMT4
Andrey Spiridonov
1 (1)
NostradamusMT4 is a powerful indicator from the set of professional trader. The indicator is based on Andrei Spiridonov's original price calculation method (ESTIMATED PRICE) for the current candle price. Advantages The indicator does not redraw. It works on any timeframes. Works with any trading instruments. Perfectly suitable for scalping and trading binary options. Parameters Color - color of the ESTIMATED PRICE FUTURE line. How to work with the indicator The indicator forms the ESTIMATED P
Swing Master Indicator
Elias Mtwenge
5 (1)
Dear Traders this is my another tool called " Swing Master Indicator ". As the name above the indicator is designed to help you in swing trading by capturing the low and highs of the price. You may us this tool with any trading strategy and style from scalping to position trading. It is made for level of traders including newbies and advanced traders even prop-firms, hedge funds and banks to help them make sold market analysis. I create tools for serious traders who want to make a difference in
OtmScalpHedge
Otmane Achandir
OtmScalp EA V1 - EUR, 금, BTC를 위한 AI 스캘핑 로봇 OtmScalp EA V1 - EUR, 금, BTC를 위한 AI 스캘핑 로봇 한정 기간 특가: $499만 (정가 $1200 - 조만간 가격 인상 예정) OtmScalp EA V1을 선택해야 하는 이유 꾸준한 일일 수익 - 공격적이면서도 통제된 스캘핑 전략 3가지 전문 버전 - EUR 페어, 금(XAU/USD), 비트코인(BTC/USD) 최적화 완전 자동화 트레이딩 - 24시간/주5일 운영, 수동 개입 불필요 스마트 위험 관리 - 자동 손절매, 익절 및 동적 로트 크기 조정 수익 창출 원리 높은 승률 전략 - AI가 미세 추세를 밀리초 단위로 분석 및 실행 낮은 드로다운 - 고급 위험 관리로 자본 보호 모든 브로커 호환 - IC Markets, Pepperstone, RoboForex 등에서 테스트 완료 간편한 설정 - 2분 내 설치, 코딩 지식 불필요 실제 성능 (백테스트 & 실거래 결과) EUR/USD 버
Market Maestro: Your Ideal Partner for Automated Forex Trading If you're looking for a reliable assistant for trading in the currency market, Market Maestro is exactly what you need. This modern Forex bot is built using the latest technologies and algorithms, allowing it to effectively analyze market data and make informed trading decisions in real-time. Key Features of Market Maestro 1. Multicurrency Capability for Broad Opportunities Market Maestro can work with a wide range of currency pairs,
ReboltP
David Theodore Caro-greene
Rebalance Overlay Technology (Rebolt) enables the trader to visualize the flow of money from one chart to another chart. Rebolt Probability indicates the probability that money has flowed from one chart to another chart for a specified length of time over a number of intervals specified by the user. When Rebolt reads Cyan or Blue these are buying signs good for the length of time specified by the user or until a conflicting signal arises. When Rebolt reads Violet or Red there are selling signs g
This indicator is designed for scalping on low timeframes (M1-M15) in volatile markets like major forex pairs (e.g., EURUSD, GBPUSD). It generates non-repainting buy (green up arrow) and sell (red down arrow) signals based on EMA crossover confirmed by RSI momentum and MACD crossovers, minimizing false signals in ranging markets. How to Use: Attach the indicator to your MT4 chart. Look for arrows on the chart: Buy on green up arrow, Sell on red down arrow. Signals appear at the open of the new
This is a Dashboard Indicator based on Bruce's Price Predictor Indicator . This Dashboard will Give you a visual to see the trend direction without having to flip through timeframes, so you can always be trading in direction of the trend, with little effort.  I Recommend   www.CoinexxBroker.com  as a great broker and the one I personally use *Non-Repainting Dashboard Arrows *For Desktop MT4 Only *Great For Scalping *Great For Swing Trading *Dashboard Arrow Entry Alerts *Dashboard Arrow Signals
MT4 "독수리 눈 지표"로 바이너리 옵션 거래의 가능성을 극대화하세요 메타트레이더 4(MT4)용 "독수리 눈 지표"를 활용하여 바이너리 옵션 거래의 혁명적인 세계에 도약해 보세요. 이 혁신적인 도구는 수술적인 정확성과 비교할 수 없는 수익성을 제공하여 거래 경험을 변화시킬 준비가 되어 있습니다. 잠재력의 경계가 깨지고 수익이 극대화되는 세계로 뛰어들어 보세요. 독수리 눈 지표의 뛰어난 정확성과 흔들림 없는 신뢰성 덕분에 시장의 숨겨진 비밀을 해결할 수 있습니다. 세심한 세부 사항에 주의를 기울여 개발된 이 최첨단 지표는 고급 알고리즘, 철저한 기술적 분석, 실시간 시장 데이터를 결합하여 탁월한 거래 이점을 제공합니다. 독수리 눈 지표는 시장의 포인트를 정확하게 파악하여 통찰력 있는 신속한 결정을 돕습니다. 직관적인 인터페이스와 사용하기 쉬운 디자인을 통해 초보 트레이더도 쉽게 바이너리 옵션의 복잡성을 탐색하고 이 도구의 엄청난 힘을 최대한 활용할 수 있습니다. 추측과 감정에 기반한
PipStartex
Andrey Kozak
PipStartex is an indicator for scalping. It draws overbought/oversold price zones on the chart in the form of a channel. It also draws yellow dots on the chart when the price goes beyond the channel. When the price goes beyond this channel, it always tries to return back. Knowing this pattern, every trader can use it for trading. When the price in the oversold zone goes beyond the channel below the red zone, we open a buy deal. When the price in the overbought zone goes beyond the channel above
Forex Gump Trend is a universal indicator for highly effective determination of the trend direction. If you identify the trend correctly, this is 95% of trading success, because you will be able to open trades in the direction of the price movement and benefit from it. The Forex Gump Trend indicator helps traders with a high degree of efficiency to determine the current trend direction, as well as trend reversal points. The direction of the trend is shown by colored lines on the chart, and the
Msht Price Pattern MT4
Ngoc Hoai Thuong Doan
Instantly spot simple candlestick patterns with MSHT Price Pattern MSHT PRICE PATTERN can automatically detect more than 200 different candlestick patterns, including multi-candle patterns. This makes it easy for you to see if what you care about is present on a chart or not at a glance, and reduces the amount of time you have to stare at charts to check off items on your investment checklist. Candlestick Pattern Recognition is supported on charts, alerts, in scanners and smart checklists. All
Gann Price Level
Kirill Borovskii
The indicator is designed to work on any trading platform. The program is based on proprietary algorithms and W.D.Ganna's mathematics, allowing you to calculate target levels of price movement based on three points with the highest degree of certainty. It is a great tool for stock trading. The indicator has three buttons: NEW - call up a triangle for calculation. DEL - delete the selected triangle. DELS - completely remove all constructions. The probability of achieving the goals is more than 80
이 제품의 구매자들이 또한 구매함
Pulse Scalping Line - an indicator for identifying potential pivot points. Based on this indicator, you can build an effective Martingale system. According to our statistics, the indicator gives a maximum of 4 erroneous pivot points in a series. On average, these are 2 pivot points. That is, the indicator shows a reversal, it is erroneous. This means that the second signal of the indicator will be highly accurate. Based on this information, you can build a trading system based on the Martingale
Miraculous Indicator – Gann Square of Nine 기반 100% 비리페인트 Forex 및 바이너리 도구 이 영상은 Miraculous Indicator 를 소개합니다. 이 지표는 Forex 및 바이너리 옵션 트레이더를 위해 특별히 개발된 매우 정확하고 강력한 트레이딩 도구입니다. 이 지표가 독특한 이유는 전설적인 **Gann Square of Nine(Gann 9의 사각형)**과 **Gann's Law of Vibration(Gann 진동의 법칙)**에 기반을 두고 있기 때문입니다. 이는 현대 트레이딩에서 가장 정밀한 예측 도구 중 하나로 손꼽힙니다. Miraculous Indicator는 완전히 비리페인트(non-repaint) 됩니다. 즉, 캔들이 마감된 후에도 신호가 변경되거나 사라지지 않습니다. 보이는 것이 곧 결과입니다. 이는 트레이더가 자신감을 가지고 거래에 진입하고 청산할 수 있는 신뢰할 수 있고 일관된 기반을 제공합니다. 주요 특징: Gann
BinaryIndicator
Andrey Spiridonov
BinaryIndicator is a highly accurate indicator for trading binary options. It shows excellent results in scalping. This indicator is based in multifactor analysis of trend indicators, as well as confirmation oscillators, which in the end gives an increased accuracy of signals. Advantages of the indicator Increased accuracy of signals. Excellent results when trading binary options with a short expiration time from M30 to M1 . It works on any timeframes. Works with any trade symbols. Parameters
Rtc ML Ai Predictor MT4
Muhammad Faisal Sagala
Rtc ML Ai | Predictor CORE MACHINE LEARNING ENGINE Adaptive ML Market Predictor – Multi-Bar Trend & Candle Forecast What This Indicator Does This indicator is a  real-time market prediction engine  designed to analyze price behavior and estimate  future market tendencies . Unlike conventional indicators, this system  does not rely on static parameters or historical curve-fitting , but adapts its internal state dynamically during live market operation. Instead of using static rules, the indic
FFx Engulfing Setup Alerter gives trade suggestions with Entry, Target 1, Target 2 and StopLoss. Below are the different options available: Entry suggestion - pips to be added over the break for the entry 3 different options to calculate the SL - by pips, by ATR multiplier or at the pattern High/Low 3 different options to calculate the 2 TPs - by pips, by ATR multiplier or at Risk/Reward Offset the dashboard - any place on the chart Remove the suggestion once the price reached the SL line Lines
FFx InsideBar Setup Alerter gives trade suggestions with Entry, Target 1, Target 2 and StopLoss. Below are the different options available: Entry suggestion - pips to be added over the break for the entry Minimum candle size - to avoid too close buy/sell entry suggestions 3 different options to calculate the SL - by pips, by ATR multiplier or at the pattern High/Low 3 different options to calculate the 2 TPs - by pips, by ATR multiplier or at Risk/Reward Offset the dashboard - any place on the c
FFx OutsideBar Setup Alerter gives trade suggestions with Entry, Target 1, Target 2 and StopLoss. Below are the different options available: Entry suggestion - pips to be added over the break for the entry. 3 different options to calculate the SL - by pips, by ATR multiplier or at the pattern High/Low. 3 different options to calculate the 2 TPs - by pips, by ATR multiplier or at Risk/Reward. Offset the dashboard - any place on the chart. Remove the suggestion once the price reached the SL line.
FFx PinBar Setup Alerter gives trade suggestions with Entry, Target 1, Target 2 and StopLoss. Below are the different options available: Entry suggestion - pips to be added over the break for the entry Minimum candle size - to avoid too small candles 3 different options to calculate the SL - by pips, by ATR multiplier or at the pattern High/Low 3 different options to calculate the 2 TPs - by pips, by ATR multiplier or at Risk/Reward Offset the dashboard - any place on the chart Remove the sugges
FFx MACD Divergences
Eric Venturi-Bloxs
The purpose of this new version of the MT4 standard indicator provided in your platform is to display in a sub-window multiple timeframes of the same indicator with its divergences. See the example shown in the picture below. But the display isn't like a simple MTF indicator. This is the real display of the indicator on its timeframe. Here's the options available in the FFx divergences indicator: Select the timeframes to be displayed (M1 to Monthly) Define the width (number of bars) for each tim
FFx RSI Divergences
Eric Venturi-Bloxs
The purpose of this new version of the MT4 standard indicator provided in your platform is to display in a sub-window multiple timeframes of the same indicator with its divergences. See the example shown in the picture below. But the display isn't like a simple MTF indicator. This is the real display of the indicator on its timeframe. Here's the options available in the FFx divergences indicator: Select the timeframes to be displayed (M1 to Monthly) Define the width (number of bars) for each tim
FFx CCI Divergences
Eric Venturi-Bloxs
The purpose of this new version of the MT4 standard indicator provided in your platform is to display in a sub-window multiple timeframes of the same indicator with its divergences. See the example shown in the picture below. But the display isn't like a simple MTF indicator. This is the real display of the indicator on its timeframe. Here's the options available in the FFx divergences indicator: Select the timeframes to be displayed (M1 to Monthly). Define the width (number of bars) for each ti
The FFx Dashboard MTF alerter will show you on a single chart all the timeframes (M1 to Monthly) with their own status for the indicator. 2 Alert Options: Single timeframe: each selected timeframe alert separately when a signal occurs Multi timeframes: all selected timeframes must agree for an alert to be triggered Both options have an input to select the timeframes to be used for the alert(s). How to Understand the Status: Green/Red square: histogram above/below 0 line Green square + Red bord
The FFx Dashboard MTF alerter will show you on a single chart all the timeframes (M1 to Monthly) with their own status for the indicator. 2 Alert Options: Single timeframe: each selected timeframe alert separately when a signal occurs Multi timeframes: all selected timeframes must agree for an alert to be triggered Both options have an input to select the timeframes to be used for the alert(s). How to understand the status: Green/Red square: RSI above/below 50 line Green square + Red border: R
The FFx Dashboard MTF alerter will show you on a single chart all the timeframes (M1 to Monthly) with their own status for the indicator. 2 Alert Options: Single timeframe: each selected timeframe alert separately when a signal occurs Multi timeframes: all selected timeframes must agree for an alert to be triggered Both options have an input to select the timeframes to be used for the alert(s). How to understand the status: Green/Red square: Stoch above/below 50 line Green square + Red border:
The FFx Dashboard MTF alerter will show you on a single chart all the timeframes (M1 to Monthly) with their own status for the indicator. 2 Alert Options: Single timeframe: each selected timeframe alert separately when a signal occurs Multi timeframes: all selected timeframes must agree for an alert to be triggered Both options have an input to select the timeframes to be used for the alert(s). How to understand the status: Green/Red square: Price above/below Cloud (Kumo) Green square + Red bo
The FFx Dashboard MTF alerter will show you on a single chart all the timeframes (M1 to Monthly) with their own status for the indicator. 2 Alert Options: Single timeframe: each selected timeframe alert separately when a signal occurs Multi timeframes: all selected timeframes must agree for an alert to be triggered Both options have an input to select the timeframes to be used for the alert(s). How to understand the status: Green/Red square: MA pointing Up/Down Green square + Red border: MA po
The FFx Dashboard MTF alerter will show you on a single chart all the timeframes (M1 to Monthly) with their own status for the indicator. 2 Alert Options: Single timeframe: each selected timeframe alert separately when a signal occurs. Multi timeframes: all selected timeframes must agree for an alert to be triggered. Both options have an input to select the timeframes to be used for the alert(s). How to understand the status: Green square: Price above PSAR Red square: Price below PSAR Options
The FFx Dashboard MTF alerter will show you on a single chart all the timeframes (M1 to Monthly) with their own status for the indicator. 2 Alert Options: Single timeframe: each selected timeframe alert separately when a signal occurs Multi timeframes: all selected timeframes must agree for an alert to be triggered Both options have an input to select the timeframes to be used for the alert(s). How to understand the status: Green/Red square: CCI above/below levels (ie. 100/-100) Grey square: C
The FFx Dashboard MTF alerter will show you on a single chart all the timeframes (M1 to Monthly) with their own status for the indicator. 2 Alert Options: Single timeframe: each selected timeframe alert separately when a signal occurs Multi timeframes: all selected timeframes must agree for an alert to be triggered Both options have an input to select the timeframes to be used for the alert(s). How to understand the status: Green/Red square: ADX above level Grey square: ADX below level Red bor
The FFx Dashboard MTF alerter will show you on a single chart all the timeframes (M1 to Monthly) with their own status. 2 Alert Options: Single timeframe: each selected timeframe alert separately when a signal occurs Multi timeframes: all selected timeframes must agree for an alert to be triggered Both options have an input to select the timeframes to be used for the alert(s). How to understand the status: Green/Red square: bullish/bearish candle Options available in the FFx Dashboard Alerter
THE GRAFF III
Antonin Skaryd
The [GRAFF] III manual trading system is based on multiple MetaTrader (MT4) indicators. Together, the entire PACK of GRAFF III indicators makes an advanced trading tool. The system consists of over 20 different custom-built indicators which have been carefully selected and tested in the long term to produce strong and efficient trading signals. The particular indicators are based on different mathematical formulas, so the entire system is calibrated to remove false signals from its own indicator
FFx Universal Strength Meter PRO is more than a basic strength meter. Instead of limiting the calculation to price, it can be based on any of the 19 integrated strength modes + 9 timeframes. With the FFx USM, you are able to define any period for any combination of timeframes. For example, you can set the dashboard for the last 10 candles for M15-H1-H4… Full flexibility! Very easy to interpret... It gives a great idea about which currency is weak and which is strong, so you can find the best pai
Pan PrizMA CD Phase is an analogue of the МetaТrader 5 indicator , and is an option based on the Pan PrizMA indicator. Details . Averaging by a quadric-quartic polynomial increases the smoothness of lines, adds momentum and rhythm. Extrapolation by the sinusoid function near a constant allows adjusting the delay or lead of signals. The value of the phase - wave status parameter (which is close in meaning to the trigonometric phase or the angle of the radius-vector rotation in the trigonometric p
Ticks Size
Viktor Kolmakov
This indicator displays in a separate window the difference between the number of points which increased the price, and the number of points that decreased the price during the time interval specified in the settings. The time interval for calculation is expressed as the number of bars of the chart the indicator is attached to. This approach allows you to evaluate the movement direction (growth or fall) of the instrument's price, the strength of the movement and the size of the movement in point
FFx Basket Scanner
Eric Venturi-Bloxs
MetaTrader 5 version available here : https://www.mql5.com/en/market/product/24882 FFx Basket Scanner is a global tool scanning all pairs and all timeframes over up to five indicators among the 16 available. You will clearly see which currencies to avoid trading and which ones to focus on. Once a currency goes into an extreme zone (e.g. 20/80%), you can trade the whole basket with great confidence. Another way to use it is to look at two currencies (weak vs strong) to find the best single pairs
FFx Pivot SR Suite PRO
Eric Venturi-Bloxs
MetaTrader 5 version available here: https://www.mql5.com/en/market/product/25794 FFx Pivot SR Suite PRO is a complete suite for support and resistance levels. Support and Resistance are the most used levels in all kinds of trading. Can be used to find reversal trend, to set targets and stop, etc. The indicator is fully flexible directly from the chart 4 periods to choose for the calculation: 4Hours, Daily, Weekly and Monthly 4 formulas to choose for the calculation: Classic, Camarilla, Fibonac
REX complete 3in1
Christophe Godart
This is the complete REX package. It consists of the lite, pro and ULTRA version.  Perfect for beginners and intermediates. REX complete is 100% non repaint. The strategy is based on a mix of different strategies, statistics, including pivot points, oscillators and patterns.  As the trading idea consists of a variety of some classic indicators like Momentum, Williams Percent Range, CCI, Force Index, WPR, DeMarker, CCI, RSI and Stochastic, it is clear that the fundamental indicators have being u
Sweet Waffle
Christophe Godart
The arrows are calculated with: -     2 Parabolic  parameters -     2 ADX parameters -     4 Stochastic parameters We recommend to combine it with Parabolic, ZigZag or Elliot waves indicator. Always trade the trend! If you make sure to draw your trend lines and support/resistance zones you will just have to wait for the signal to appear. Take the trade. For Binary Options it is advisable to set the expiry time to 5-15 min in M1 chart. THIS INDICATOR IS ZERO REPAINT Best assets to trade: - EUR
제작자의 제품 더 보기
multi timeframe moving average indicator will give you the right Direction of the market on the higher time frame according to the setting of moving average  (Displays a higher timeframe moving average on a lower timeframe chart) MA Timeframe should be greater or equal to the chart timeframe working on all pairs and on all timeframe you can use it in scalping or intraday or swing
Candle Arrow
Jefr Alnafey
Candle Arrow indicator give you the power of the candle when you see the Arrow on Chart that mean a price Action will happen soon so important thing you must draw the supply and demand area on the chart and the wait the Signal Appear with Candle you must wait until candle close and i advice you take look on higher timefram then back to smaller timeframe it will give you a good entry point 
Trend Level
Jefr Alnafey
Forex Indicator Price Movement Level with Trend Alerts. This indicator will write value degrees of the latest position of price at the current Timeframes according to the Daily price movement, and when position and condition of trend status was changed the indicator will give an alerts. you can depend on this indicator to take order with strong entry point and good level of movement
Moving Wizard
Jefr Alnafey
Moving Wizard indicator will guide you to work with Trend and give pure Entry point depending on crossing on the chart it work on all currency and all Timeframe you can use it daily or scalping or swing its good with all and This indicator you can make it your strategy  i work on it on H1 Timframe and make a good money you can take alook on it and you see a great resault on chart  .Gold moving is to Know the Trend of price other moving below it mean we looking to sell orders . if above it we loo
JR Trend
Jefr Alnafey
with JR Trend you will able to enter and exit every trade with just a signals appear no need for any strategy just flow the indicator it work on all pairs and all Timeframe i usually take a look on higher timeframe and return to the lowest  timeframe and make an order with indicator signals you can see the amazing result so you can depend only on it intraday or swing as you wish   
Volume MTF
Jefr Alnafey
volume MTF is the way to give you the Volume of currency and you will Know the trend and reflection when happen it used on scalping and entraday trading strategy with (M1....H4) Timeframe i always going take a look on higher timeframe then back to small timeframe and wait an indicator signals the setting of indicator i usually used the default just remove the arrows from setting  this indicator recommended for scalping 
Moving Wizard indicator will guide you to work with Trend and give pure Entry point depending on crossing on the chart it work on all currency and all Timeframe you can use it daily or scalping or swing its good with all and This indicator you can make it your strategy  i work on it on H1 Timframe and make a good money you can take alook on it and you see a great resault on chart  .Gold moving is to Know the Trend of price other moving below it mean we looking to sell orders . if above it we loo
JR Trend Mt5
Jefr Alnafey
with JR Trend you will able to enter and exit every trade with just a signals appear no need for any strategy just flow the indicator it work on all pairs and all Timeframe i usually take a look on higher timeframe and return to the lowest  timeframe and make an order with indicator signals you can see the amazing result so you can depend only on it intraday or swing as you wish 
필터:
리뷰 없음
리뷰 답변