MWC Ratio
- 지표
- 버전: 2.1
- 업데이트됨: 7 8월 2021

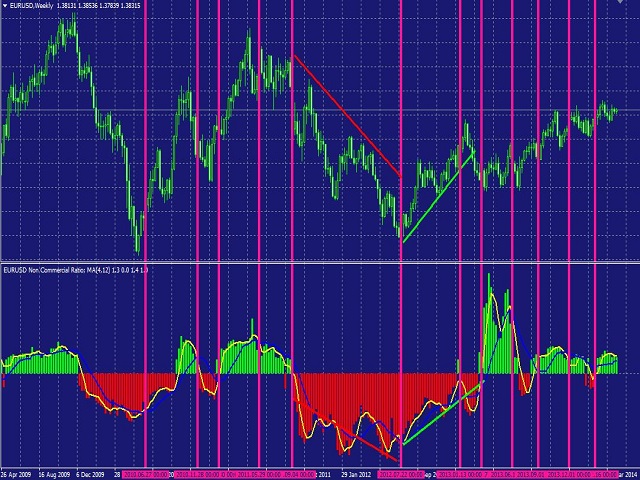
The Commitments of Traders Ratio Indicator is one of these things you never thought about it before you really see the magic behind it. The indicator shows the Ratio of long/short positions released by the CFTC once a week.
If you have a look on the Sreenshot you can see two (three) zones of interest.
- Zone 1: The Switches (Red -> Green, Green -> Red)
- Zone 2: MA cross
- Zone 3: If you combine this with the COX indicator an additional zone will appear. You also can experiment with Ratio crossing MA.
If one of theses things happens and some of your favorite Indicator set on H4/D1 ringing in the same way it's time to think about an entry point.
Obviously the MWC Ratio is also a very good big Trend Indicator!
Please make sure that you download the MWC_Demo.zip file and unpack it into [...]/MQL4/Files folder.
-> www.myweeklycot.com/teaser-demo
사용자가 평가에 대한 코멘트를 남기지 않았습니다