Hidden Cross Binary Options
- 지표
- 버전: 1.0
- 활성화: 20
The latest Binary Options arrow indicator in the Garuda Signals product line.
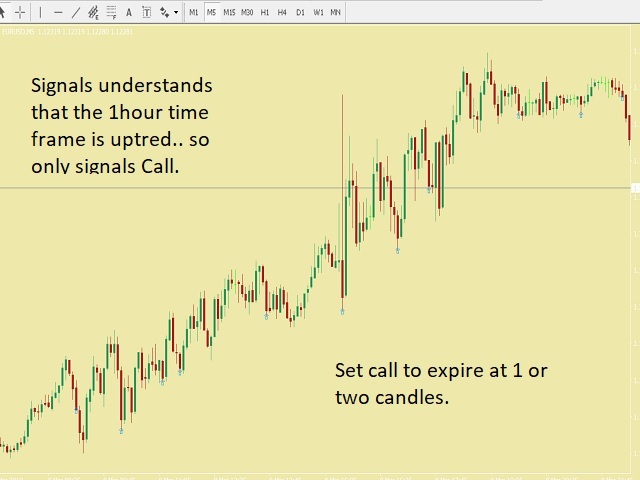
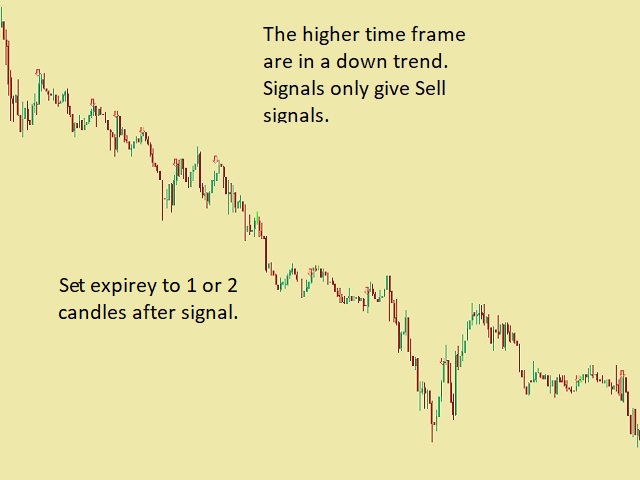
Binary options signal based on multiple time frame cross over analysis. Gets confirmation from the most consistent signals known to man; Ichimoku, SMA, Bollinger Bands; and also uses the 1 Hour time frame as trend confirmation , so you don't have to open up multiple chart and waste time.
- Can be used for all time frames up to 1 hour, but is most POWERFUL for 1 and 5 min options.
- Place your Call/PUT based on the Arrow signal direction.
- Comes with Alert. So you never miss the money trade. (once the alert pops up, get ready to place entry on the next candle)
- Be prepared for around at least 2 to 3 signals per hour.
- Be prepared to finally make money.
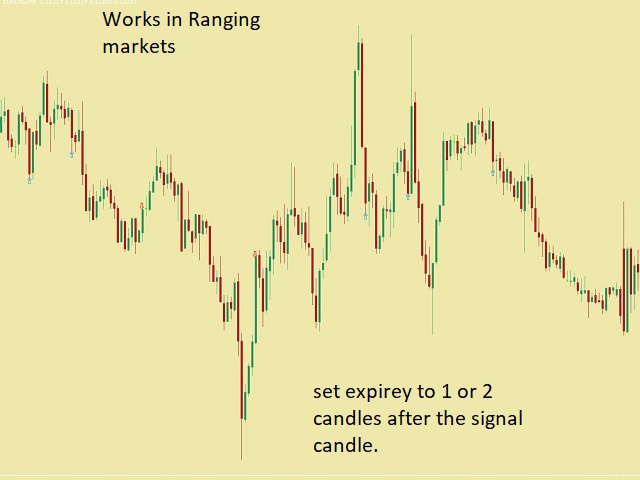
Set expiry for one or two candles after the signal candle.
Works well if you use an automated Binary Trading bot. Set the bot when markets are most likely to trend.
Lets go, join the flock!