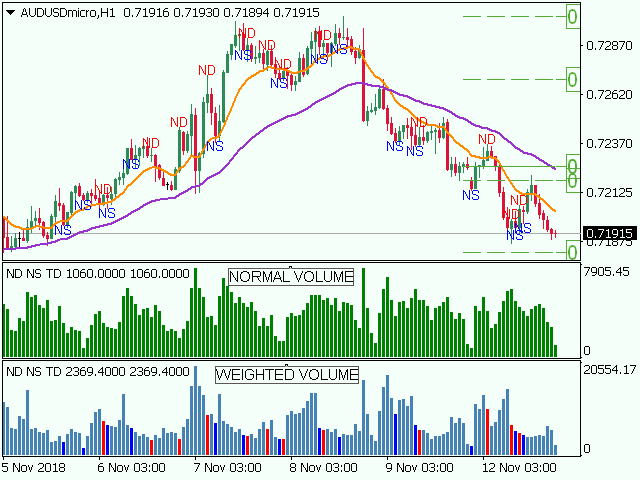
No Demand No Supply
- 지표
- 버전: 3.2
- 업데이트됨: 23 1월 2022
- 활성화: 10

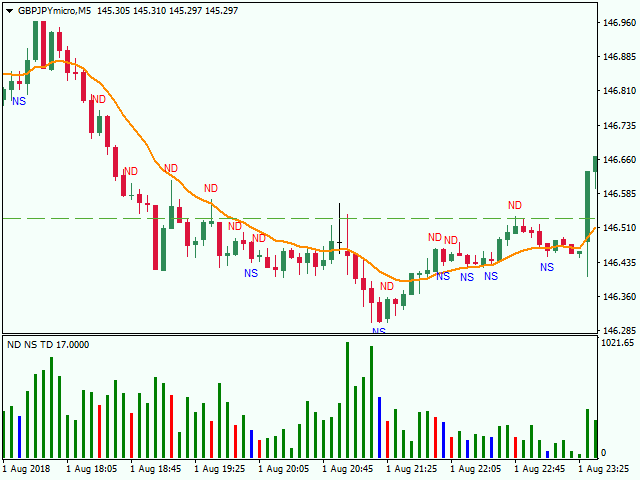
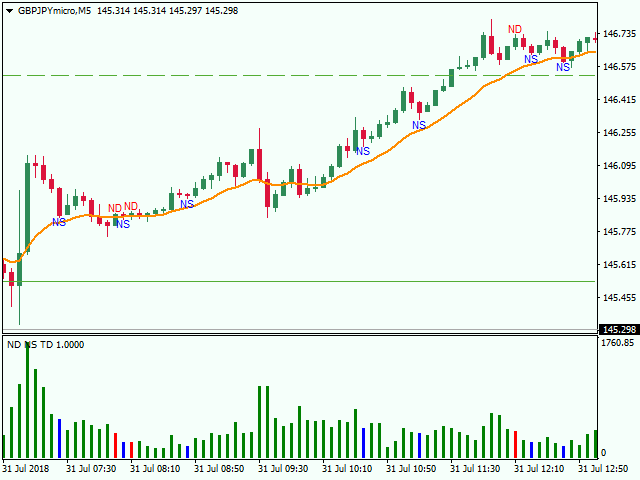
This indicator identifies No Demand –No Supply candles to your chart and plots volume bars colored according to the signal. It can be applied to all timeframes or to a specific one only. It can also be used as regular volume indicator but with exceptional future of WEIGHTED VOLUME.
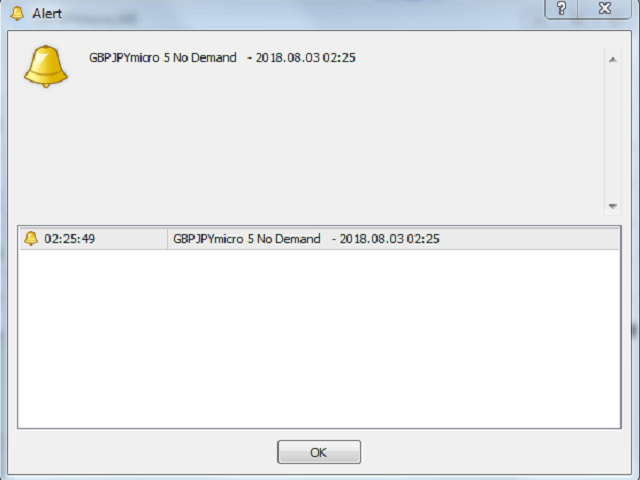
Furthermore is has an alert notification, sound and email when a signals occurs.
The indicator does not repaint but the alert will come on two candles back due to the definition of No Demand No Supply.
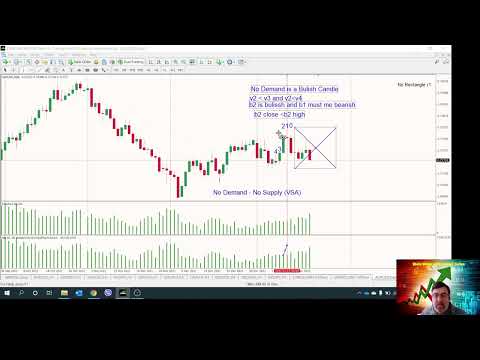
The VSA (Volume Spread Analysis) definition for No Demand and No supply is as follows:
No Demand (no buyers-potential short position):
The Volume within the candle formation again has to be lower than the volume of the previous 2 candles.
The candle has to close bullish (green body) and the next candle to be bearish.
There has to be some sort of rejection (pin or wick) at the high of the candle.
If the candle closed at the top it would not be a no demand candle.
No Supply (no sellers-potential long position):
The Volume within the candle formation has to be lower than the volume of the previous 2 candles.
The candle has to close bearish (red body) and the next candle bullish.
There has to be some sort of rejection (pin or wick) at the low of the candle.
If the candle closed at the bottom it would not be a no supply candle.
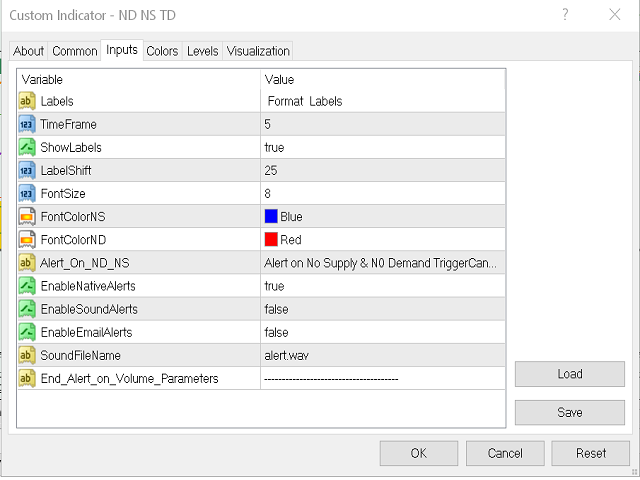
Parameters
Format Labels
- TimeFrame: Specify a specific timeframe in minutes (5,15,60, etc.) or 0 to be applied to all timeframes
- ShowLabels: Show NS and ND labels, true or false;
- Show_No_Demand: Shows No Demand label on price chart or not;
- Show_No_Supply: Shows No Supply label on price chart or not;
- Engulfing Filter: if true signals will be generate when engulfing candle pattern occur
- Wick: ND or NS candle can be filtered by the Wick (pin) size: 0 very small, 1 at least 25% pin and 2 at least 50% pin
- LabelShift: Label shift above and below bars in points
- FontSize: Font size of labels
- FontColorNS: Color of No Supply label
- FontColorND: Color of No Demand label
Weight Volume Parameters - Weight Volume According to Sessions London-US-Asia. Should be used only in Forex or any other Instrument that when EU+US sessions operating together has the Highest Volumes. (it operates on 1Hr charts or less)
- Weighted Volume: true/false - Weights volume of different sessions taking into consideration that when London and US are operating at same time the highest volume of all sessions occurs and adjusts the rest of the sessions. With this parameter it very easy visualize which volumes are significant even on Asian hours or non-significant on London-US hrs.
Alert Parameters
- EnableNativeAlerts: Popup window
- EnableSoundAlerts: Sound alert
- EnableEmailAlerts: Sends email
- EnablePushAlerts: Push Notification
- SoundFileName: The sound file for sound alert "alert.wav"

Very happy with this indicator. Offers several options to filter out signals. What a wonderful coder, also provides a good video explaining the features and filters of the indicator. It's a good complement to my existing Wyckoff software on MT4.