Adaptive SuperTrend
- 지표
- 버전: 1.20

Adaptive SuperTrend K-Means is an MT4 port of the open-source TradingView indicator "Machine Learning Adaptive SuperTrend" by AlgoAlpha (Mozilla Public License 2.0). All credit for the idea and the original code goes to AlgoAlpha.
At a glance
- What it is: a SuperTrend whose band width adapts to the current volatility level
- Volatility levels: K-means sorts recent ATR values into high, medium and low clusters
- Faithful port: same math and the same defaults as the original Pine Script code
- For EA developers: 7 buffers readable with iCustom
- Price: free and open source
How it works
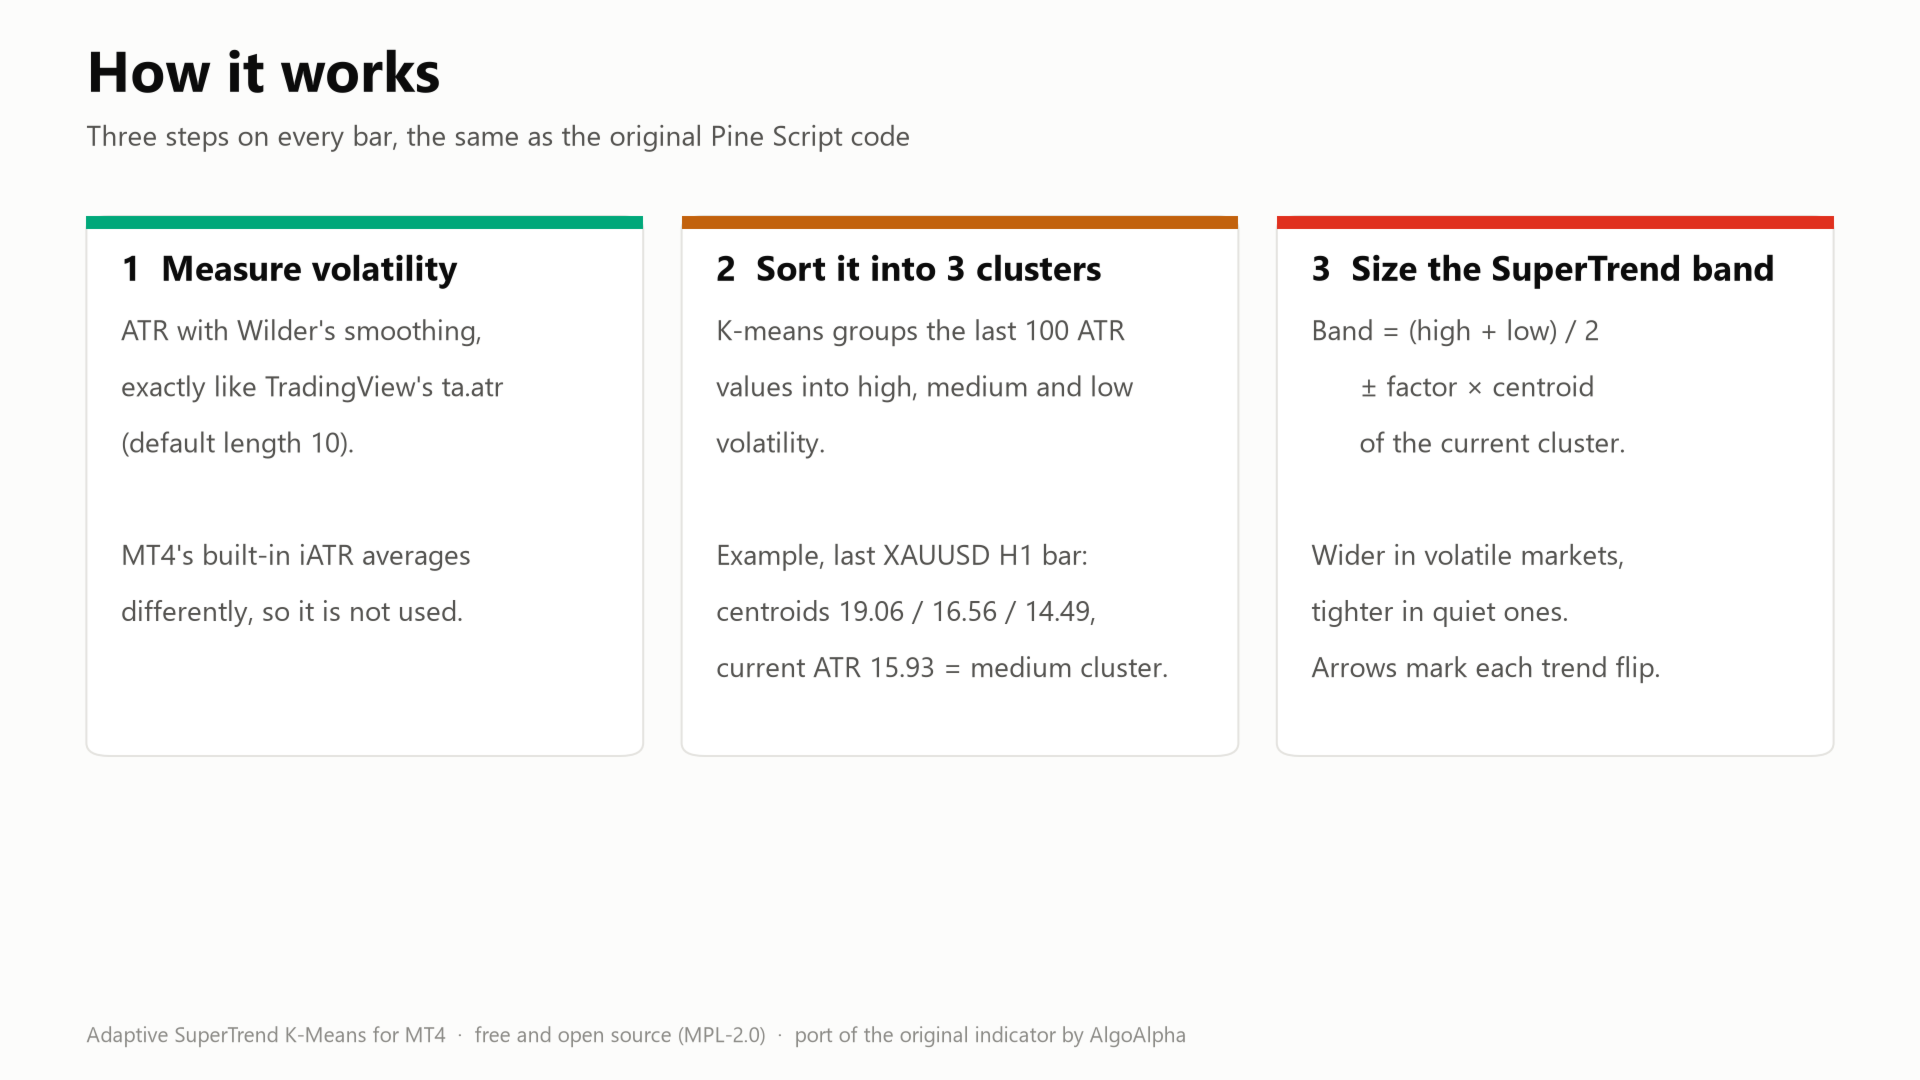
- Volatility: ATR with Wilder's smoothing, exactly like TradingView's ta.atr.
- Clusters: K-means groups the last 100 ATR values into high, medium and low volatility.
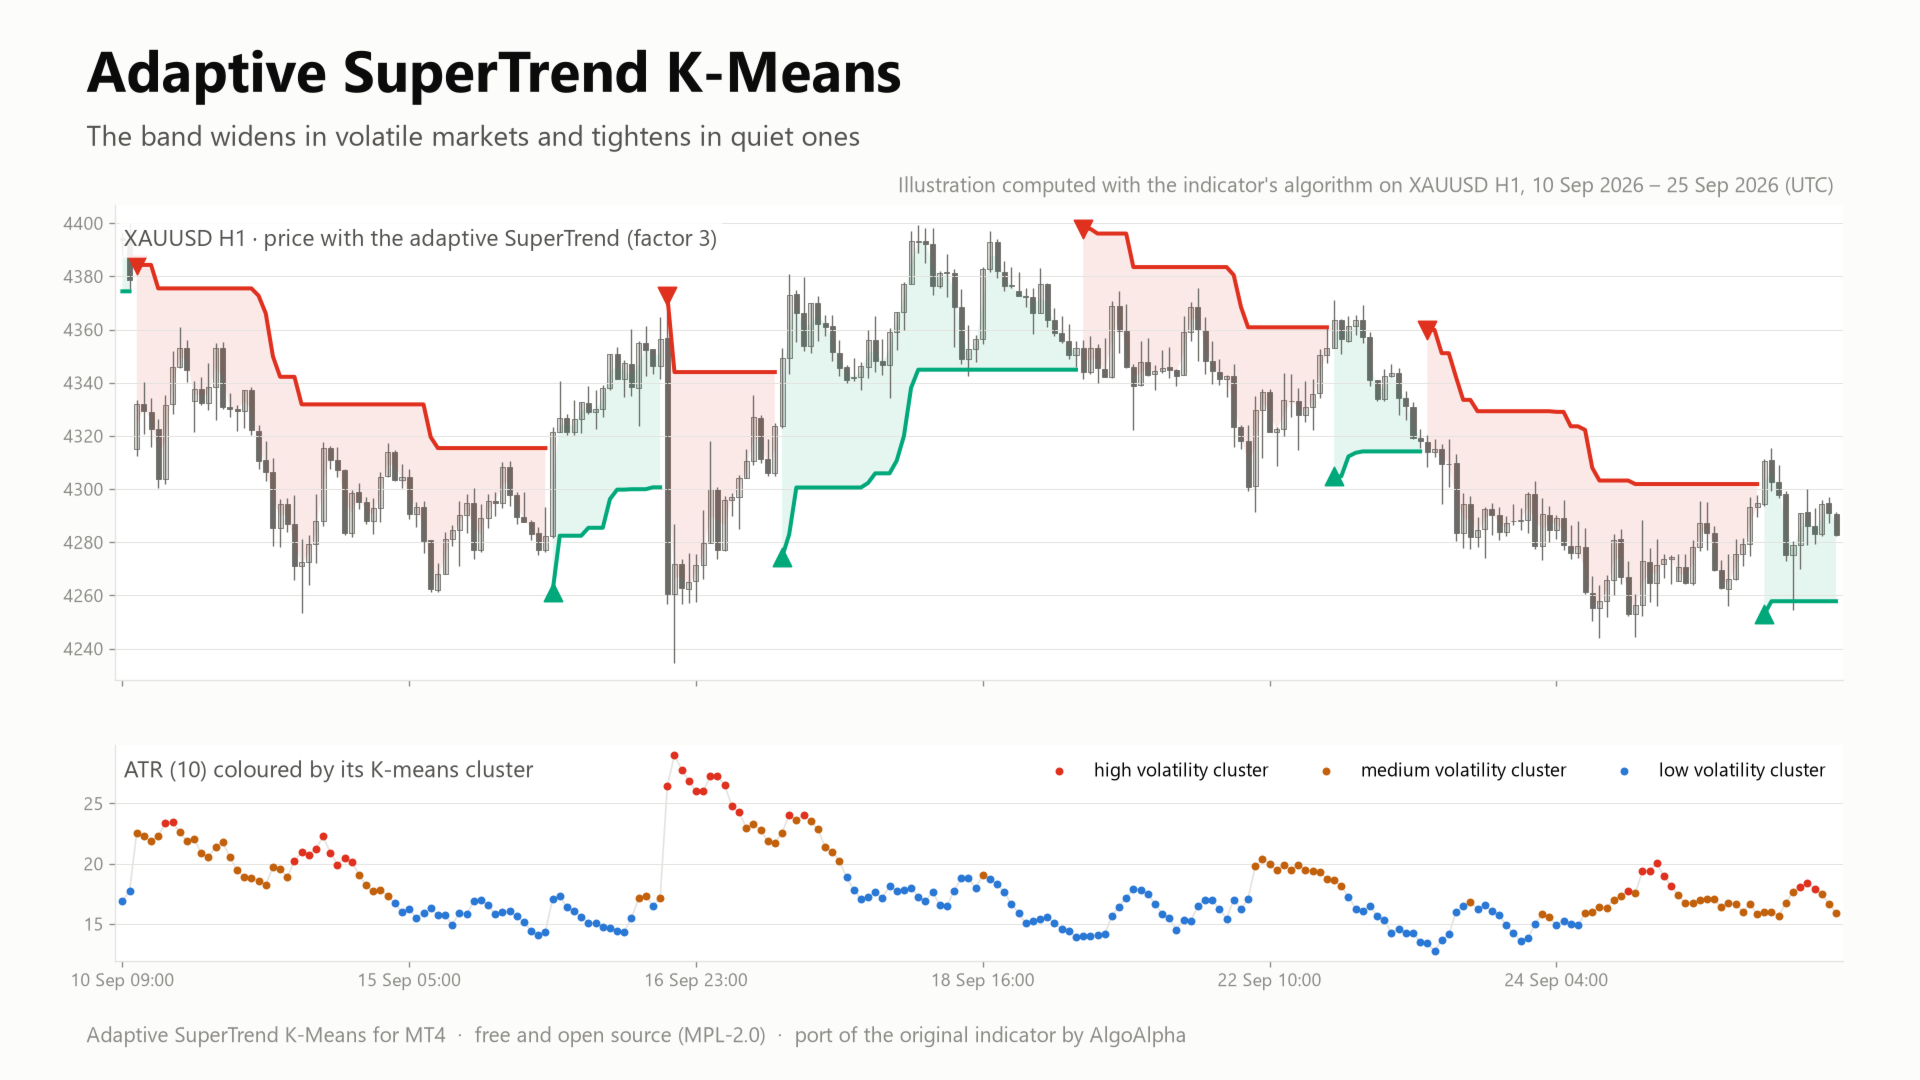
- Band: the SuperTrend uses (high + low) / 2 ± factor × the centroid of the current cluster, so the band widens in volatile markets and tightens in quiet ones.
On the chart
- Trend line that breaks when the trend flips (green up, red down)
- Gradient fill between the line and the candles
- Arrows at each trend flip
- Cluster numbers 3 / 2 / 1 on recent bars
- Statistics table: cluster centroids, cluster sizes, current volatility
Faithful port
- Same math as the original Pine Script code, including the strict K-means assignment and the original defaults.
- The statistics table keeps one quirk of the original: the "3 (High)" row shows the size of the low-volatility cluster.
- Values match TradingView when both use the same price feed. Different brokers give slightly different ATR values.
Parameters (default)
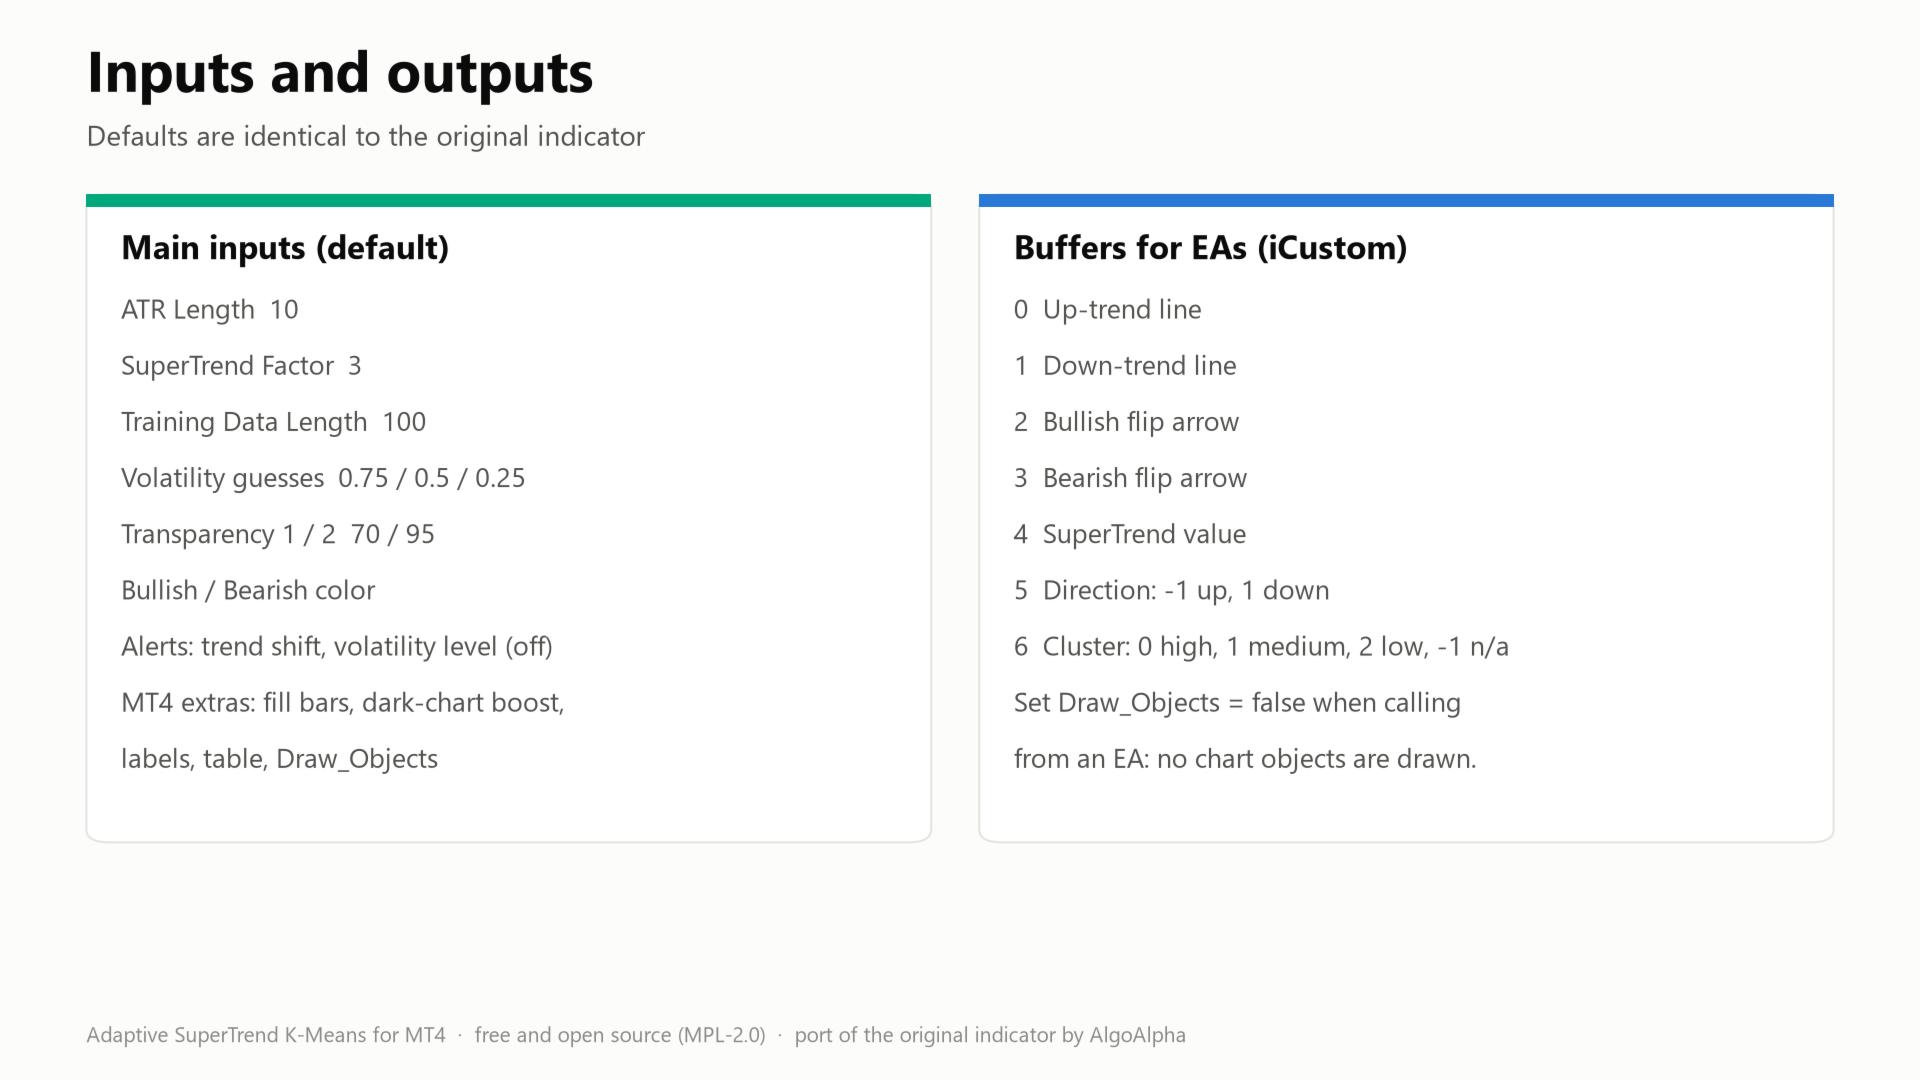
- ATR Length (10), SuperTrend Factor (3)
- Training Data Length (100): ATR values used by K-means
- Initial High / Medium / Low Volatility Percentile Guess (0.75 / 0.5 / 0.25): starting centroids inside the ATR range
- Transparency 1 / 2 (70 / 95): fill strength near the line / near the candles
- Bullish / Bearish Color
- Bars to calculate (5000, 0 = all), Line width (2)
- Show fill, Bars with fill (1000), Dark_Boost for dark charts
- Show arrows, cluster numbers (max 500) and the statistics table; font sizes
- Alerts for trend shifts and volatility levels (off)
- Draw_Objects (true): set false when you call it from an EA
Buffers for EAs (iCustom)
- 0: up-trend line
- 1: down-trend line
- 2: bullish arrow
- 3: bearish arrow
- 4: SuperTrend value
- 5: direction (-1 up, 1 down)
- 6: cluster (0 high, 1 medium, 2 low, -1 n/a)
MT4 notes
- MT4 has no transparency, so fill colors are blended with the chart background.
- The fill is drawn as background rectangles on the last Fill_Bars bars. Lower it on a slow computer.
- No chart objects are drawn in non-visual testing.
This is a visual tool. It does not place trades and does not predict prices.
License: Mozilla Public License 2.0, the same as the original. The source code is attached.