Trade Position Visualizer
- 유틸리티
- 버전: 1.2
- 활성화: 5

RR Tool — Visual Risk/Reward Backtesting Assistant
Backtest your risk/reward ideas manually, right on the chart, without opening a spreadsheet. RR Tool lets you draw risk and reward zones onto historical price action, automatically checks whether each setup would have hit take-profit or stop-loss, and tracks a simulated equity curve so you can see how your strategy would have performed over time.
Key Features:
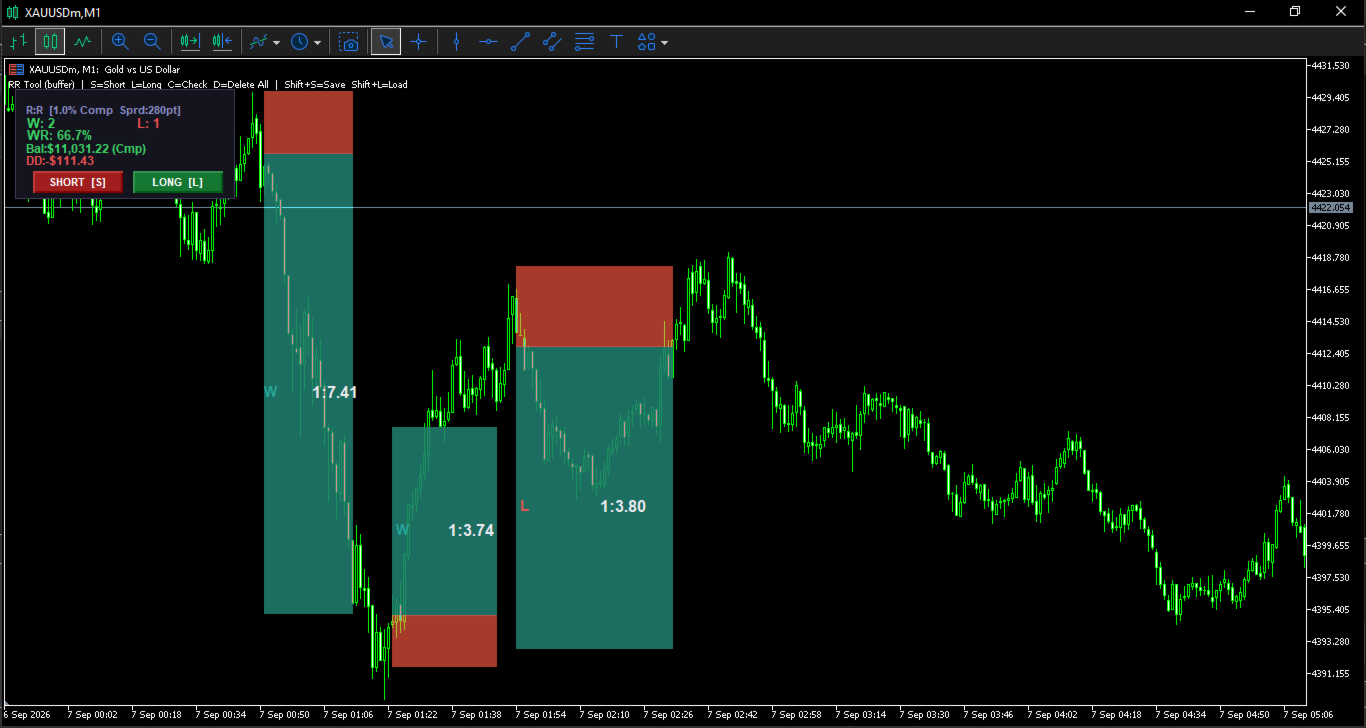
- Fast manual backtesting — Scroll back through history, press L or S, and click to drop a risk/reward zone at any historical entry point. No need to place real or demo orders — just visualize the setup and see what would have happened.
- Fully adjustable zones — Drag the take-profit edge to test different reward targets, drag the stop-loss edge to test different risk levels, or move the whole zone to fine-tune your entry — all without deleting and redrawing.
- Automatic outcome detection — Press C and the tool scans every zone on the chart against historical price data, marking each as a win or loss with a clear "W"/"L" badge — no manual judgment calls needed.
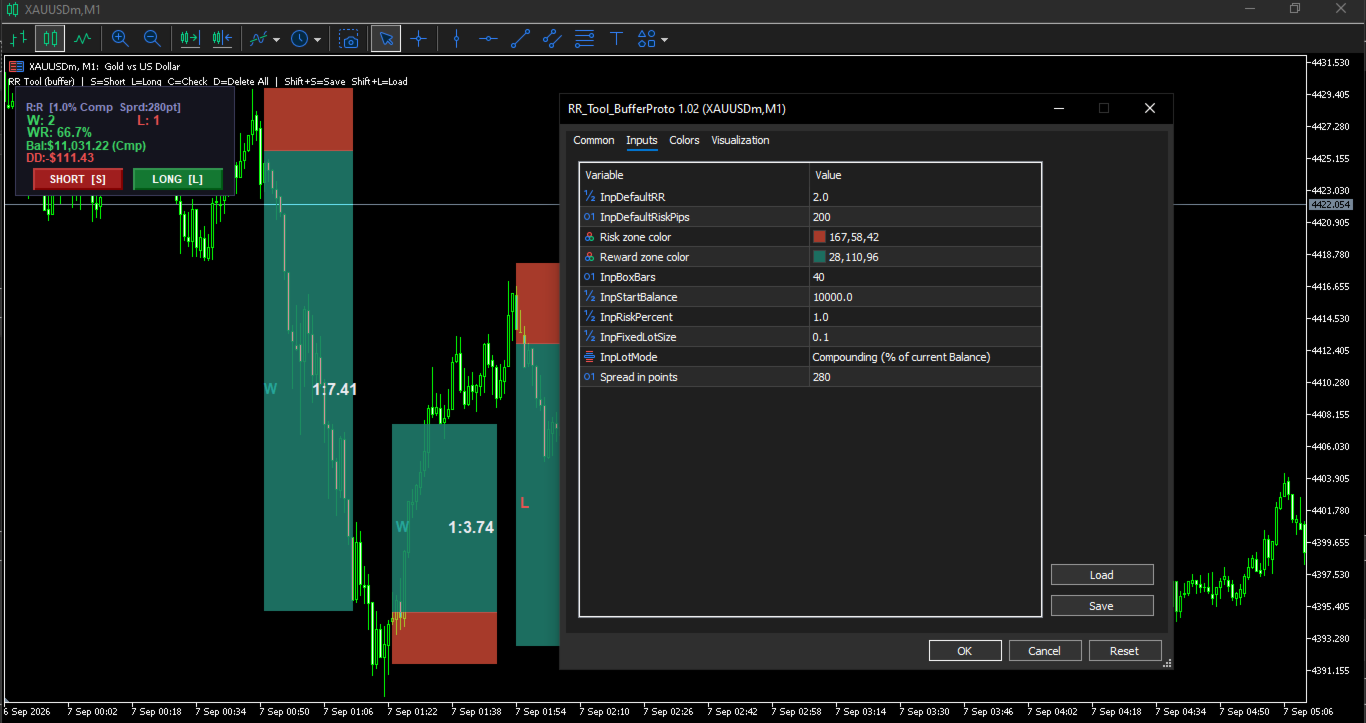
- Simulated equity tracking — A draggable on-chart panel updates your simulated balance, win rate, and max drawdown as each zone resolves, so you can immediately see whether a given R-multiple and position-sizing approach would have been profitable.
- Realistic position sizing — Choose fixed lot size or compounding (percentage-of-balance) sizing so your simulated equity curve reflects how your account would actually grow or shrink.
- Spread modeling — Configurable spread input factors real trading costs into each win/loss check, avoiding unrealistically optimistic results.
- Save & resume sessions — Shift+S saves all your test zones and Shift+L reloads them, so you can pick up a long backtesting session across multiple days without losing your work.
- Lightweight, chart-native design — Built on indicator buffers rather than heavy chart objects, so it stays fast even with many historical setups drawn at once (unlimited non-overlapping zones, up to 8 simultaneous overlapping zones).
Ideal for:
- Manually backtesting a strategy's risk/reward ratio across historical charts
- Testing different R-multiples (1:2, 1:3, etc.) to find what fits your edge
- Validating position-sizing rules (fixed vs. compounding) against past price action
- Building an intuitive feel for win rate and drawdown before risking real capital
Quick Controls:
| Action | Key |
|---|---|
| Place Short test zone | S |
| Place Long test zone | L |
| Check all zones (win/loss) | C |
| Delete all zones | D |
| Save test session | Shift+S |
| Load saved session | Shift+L |
| Delete zone under cursor | Hover + Delete |
| Cancel placement mode | Esc |
Fully customizable inputs: default risk/reward ratio, default risk in pips, risk/reward zone colors, zone width, starting balance, risk percent, lot size, lot mode, and spread.
Note: This tool is a visual planning and manual-backtesting aid — it does not place real trades. Historical outcomes are simulated for planning purposes and do not guarantee future results.