Control Points MT4
- 지표
-
Ilya Malev
 시스템 아키텍트, 금융 시장용 트레이딩 시스템 개발자
 - 버전: 1.3
- 업데이트됨: 12 3월 2026
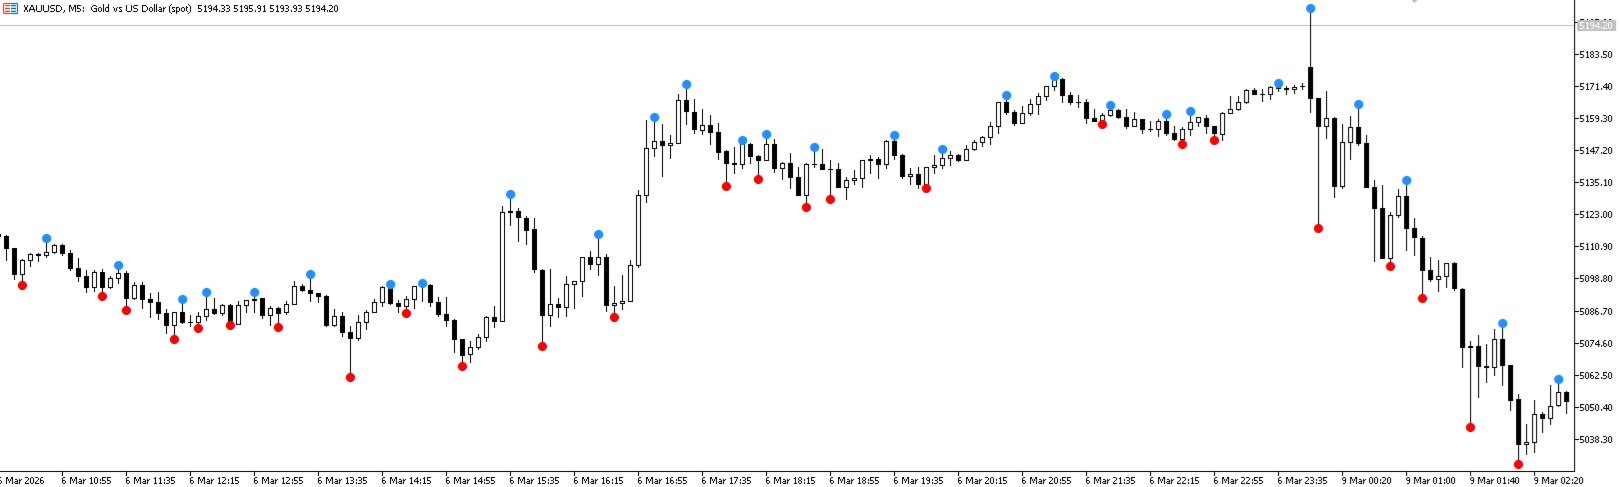
ControlPoints 지표
용도: 컨트롤 포인트(CP) — 차트상의 국소 극값(프랙탈)을 식별합니다. 상단 CP는 국소 고점(high 기준), 하단 CP는 국소 저점(low 기준)입니다. 차트에 마름모 모양으로 표시됩니다.
No-Repaint: 이 지표는 재계산하지 않습니다. 바 i의 CP는 윈도우 [i − 이전 바 수, i + 이후 바 수] 내의 모든 바가 마감되었을 때만 확정됩니다. 형성 중인(현재) 바는 절대 평가되지 않습니다. 확정된 후에는 값이 다시 계산되지 않습니다.
CP 판정 로직
상단 CP: 범위 [i − 이전 바 수 .. i + 이후 바 수](단, j ≠ i) 내의 모든 high[j]보다 high[i]가 엄격히 큽니다.
하단 CP: 같은 범위 내(단, j ≠ i)의 모든 low[j]보다 low[i]가 엄격히 작습니다.
동일한 바가 상단 CP와 하단 CP를 동시에 겸할 수 있습니다.
파라미터
| № | 파라미터 | 타입 | 기본값 | 설명 |
|---|---|---|---|---|
| 1 | 이전 바 수 | int | 2 | 후보 바 왼쪽에서 high가 더 낮아야(상단 CP) 또는 low가 더 높아야(하단 CP) 하는 마감된 바의 개수. 최소 1. |
| 2 | 이후 바 수 | int | 2 | 후보 바 오른쪽에서 극값을 확인해야 하는 마감된 바의 개수. CP 출현 지연을 결정합니다: 바 i의 점은 바 i + 이후 바 수가 마감된 후에야 나타납니다. 최소 1. |
| 3 | 상단 CP 색상 | color | clrDodgerBlue | 상단 CP 마름모의 색상. |
| 4 | 하단 CP 색상 | color | clrRed | 하단 CP 마름모의 색상. |
| 5 | 마름모 크기 | int | 2 | 표시되는 마름모의 크기(픽셀 단위 두께). 최소 1. |
버퍼
| 인덱스 | 이름 | 내용 |
|---|---|---|
| 0 | Upper CT | 바 i가 상단 CP이면 high[i], 그렇지 않으면 EMPTY_VALUE |
| 1 | Lower CT | 바 i가 하단 CP이면 low[i], 그렇지 않으면 EMPTY_VALUE |
참고
값이 같을 경우 ( high[i] == high[j] 또는 low[i] == low[j] ) CP는 형성되지 않습니다 — 엄격한 우위가 필요합니다.
「이전 바 수」/「이후 바 수」 파라미터를 늘리면 CP가 더 유의미해지지만(작은 변동을 걸러냄), 지연이 커지고 점의 개수가 줄어듭니다.


사용자가 평가에 대한 코멘트를 남기지 않았습니다