MetaTrader 4용 새 Expert Advisor 및 지표 - 248

This EA is created to work on all Time Frames and all Currency Pairs. The Robot is based on one standard Indicator.No other Indicator required. Different settings possible SL and TP Trailing Stop Martingale The Ea is very good for longterm Growth Works best on higher Time Frames as there will be more data collected. It works as well on cent accounts.
I wish everyone who purchases the EA maximum sucess and good trading results
Please trade carefully and responsibly. Thank you and Happy trading
The Robot is mostly based on the CCI Indicator.
Watch here how to set the bot https://www.youtube.com/watch?v=2wCzTFIGNp4&feature=youtu.be
This EA is created to work on all Time Frames and all Currency Pairs. The Robot is based on one standard Indicator.No other Indicator required. Different settings possible SL and TP Trailing Stop Martingale The Ea is very good for longterm Growth Works best on higher Time Frames as there will be more data collected. It works as well on cent accounts.
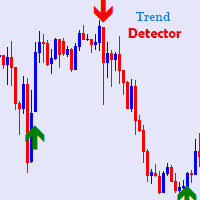
Trend Detector Trading Indicator is a trend following trading system based on the MT4 Platform that Detects the start of the Trend. Very simple and power indicator showing buy / sell arrows direction for trading currencies and commodities as well. one scan is done which generates certain trades, long and Short which takes 1 second to generate the entry/exit points,
Currency pair : EUR/CHF, EUR/GBP, EUR/JPY, EUR/USD, GBP/CAD, GBP/JPY, GBP/USD, NZD/USD, USD/CAD, USD/CHF . and All the Pairs you

MT 4 to MT 4 Copy Tool This is an easy to use FX Trade copy tool fo the Meta Trader 4. easy to use quick execution time unlimited slaves can be connected need to un one server Lot Multiplier option OR Equity based option This one is only made to copy from MT4 to MT 4.
I wish everyone who purchases the EA maximum sucess and good trading results
Please trade carefully and responsibly. Thank you and Happy trading everyone

Simple 3 Moving supports and resistance levels (Your Review /comment and feedback is important !! Thanks) Signal UP and Down possibilities created on crossing the multi supports/resistance levels supports all time frames Adjusted inputs for area covered for generating the levels and the shifts needed to cover 3 areas supports /resistances levels for example you may use main parameters in M30 time frames: extern int ShiftFromStart=20; extern int barsCount=20; extern int sequenceShifts=50; in
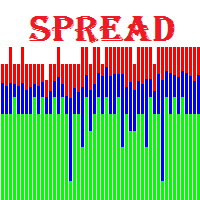
Spreads Monitoring MT4 - мощный инструмент для сбора значений спреда и записи их в файл. Позволяет "ловить" минимальные и максимальные значения спреда, рассчитывает реальное среднее значение спреда у брокера . Преимущества индикатора: Работает на всех таймфреймах; Восстанавливает ранее записанные данные для отображения на графике; Умеет запускать себя на графиках других символов по шаблону текущего графика; Имеет инструменты для удобной работы с данными; Не нагружает терминал. Параметры индикато
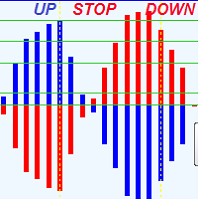
This indicator that shows precise price direction ,and force of this direction, reversals ,added it to any chart and you supress any confusion .
It calculs force of current direction and Predicts price reversals with high degree of accuracy withs its key levels and it is great for scalping , Or swing trading . For any time frame the following behavor is the same : Blue Histogram above 0.0 means that a buyers dominates price movement In other side , Red Histogram Above 0.0 means sellers d

Indicator Profitability Check Introduction: IPC means "Indicator Profitability Check". Some features will be locked in free version. Also you cannot check result more than 1 month. For paid version, please visit: https://www.mql5.com/en/market/product/45247 Here Indicator Profitability Check is a custom script which will check the profitability of a buy-sell arrow based custom indicator’s signal profitability. So traders who are very confusing for a buy-sell arrow based custom signal indicato
FREE

Принцип работы советника : В начале европейской сессии определяет нахождение цены относительно тренда по двум индикаторам MA (Moving Average). Устанавливает ордер с уровнями StopLoss и TakeProfit .Время существования ордера ограниченно 10 часами. Закрытие ордера происходит по StopLoss , TakeProfit или после истечения времени жизни ордера. Встроенный свечной фильтр уменьшит вероятность ложных сигналов на открытие ордеров . Входные параметры : Risk - величина процента к балансу свободных сред
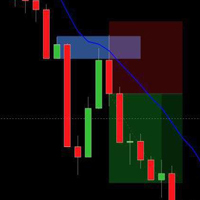
I spent two and a half months checking charts, looking for best variations for FTB trades and adjusting this indicator to get this final version. I think these are best rules to get as many FTB setups as you can. My aim was to make trading more comfortable as I cant imagine myself going through at least 36 tabs and search for FTRs and then again checking FTBs. FTB setup is pretty straight forward and easy to make indicator for so I said to myself why should I bother when I can have indicator to

Introduction: You can download free version from here: https://www.mql5.com/en/market/product/45252 Indicator Profitability Check is a custom script which will check the profitability of a buy-sell arrow based custom indicator’s signal profitability. So traders who are very confusing for a buy-sell arrow based custom signal indicator, should it test/use in live/demo account, then they now can make their decision very quickly by checking this profitability process with this script. This checking

The indicator of stop hunting shows the level zone of Day marketing. Zones are displayed as background rectangles. The length of the rectangle corresponds to the duration of the active trading, and the height to the trading range. For the current trading day, there is still the opportunity to show the extreme prices of each zone. The following parameters can be configured in the indicator: NumberOfDays = 200 - The number of days displayed.

Binary analyzer is a great opportunity to write your own indicators and trading strategies based on ready-made calculations based on binary code. The analyzer works on all currency pairs with 5 decimal places "0.00001" EUR / USD, GBP / USD ITD Recommended Session M1 Included in the Catalog. Indicator - "Binary reference" and 4 indicators measuring Bullish and Bearish market sentiment // ------------------------------------------------ ------------------- // Indicator "Binary reference" The algo
FREE

This Scanner Dashboard uses the Extreme TMA System Arrows Indicator to show good BUY/SELL signals. This Product contains dashboard only. It does not contain the Abiroid_Arrow_Extreme_TMA.ex4 indicator. Arrows indicator is not necessary for dashboard to work. To see arrows, you can buy the arrows indicator separately if you like: https://www.mql5.com/en/market/product/44822
Dash shows Slopes for current and Higher Timeframes. - 1st diamond is current TF. Next diamonds are higher TFs
(Please Not

A real rarity for scalpers.
Are you looking for TFs lower than M1 ?
Do you want to see the price dynamics inside the candle?
This is a tool for you.
Visual Ticks is an indicator that shows the tick chart in a separate window.
He does it in real time waiting for changing ticks.
Thanks to Visual Ticks, we can look inside the traditional candle and see the dynamics of the moving price.
By setting "period_of_model" we can shape a chart made of candles.
"period_of_model" defines how many consecuti

A very simple and convenient trend indicator based on price divergence. He showed himself well in scalping. Help in finding entry points for analysis. It can be used as a filter in trade. It has two parameters: Period and Level. The Level parameter helps to filter out excess signals. For example, for EURUSD, the Level parameter may be 0.0001. The indicator can work both for entry points and as a filter. The indicator reflects information in a visual form. We must not forget that the approach to
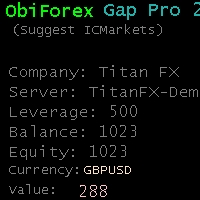
Obiforex Gap Pro Functions: Assists in identifying potential trading opportunities associated with weekend market gaps. Facilitates risk management and order adjustments based on your configured settings. Trades exclusively on the first market opening day (Monday) and only with the specified currency pairs. Please note: Trading involves risks. The Obiforex Gap Pro expert advisor provides tools for analysis; however, results may vary. Use at your own discretion.
FREE
The EA uses a combination of several different trading systems.
The unique trading expert algorithm allows you to choose the direction of positions with the highest probability of their profitable closing.
The risk control system allows profitable transactions to prevail over the total amount of loss.
Advisor is ready for full independent work without the intervention of a trader.
Recommended trading tools: TF 5m: EURUSD, GBPUSD, USDJPY, USDCAD, EURGBP. Settings:
MaxRisk - Percentage of ris

Select from up to 6 Strategies solo or Combine different strategies for signal generation (Combining more than 2 strategies may LIMIT a lot the number of signals)! ALL From Chart !!! Also Inputs editing from Chart !!! Push your strategy bottom (one strategy) OR Combine signal from as may strategies (up to 6) : Selected and enabled strategies will be in GREEN !!! 1- BUY SELL areas 2- Support resistance break signal 3- Elliot wave continuation /reversal signal 4- Advanced Moving averages 5- Tren

EasyFXTrade
Trading Utility
Tool Debeloped for Manual Trading in Forex and Crypto. EasyFXTrade provides a better way for trading, it's the ultimate tool:
Watch how works video: https://youtu.be/5nyJ77IHjUc
Parameters:
1. These first 2 parameters are the TP and SL of a tool that gives the risk of an operation(see screenshots for more info)
Benefit Tool Points: points of the TP of the blue rectangle, this rectangle can be resizable.
Loss Tool Points: points of the SL of the red rectangle thi

Индикатор отображает скользящие средние на заданном количестве баров ( Count bar for show MA ). Данный способ отображения упрощает анализ, так как график не загромождён лишними линиями. Так же имеется текстовая метка с отображением текущей цены скользящей средней и периода графика. Горячие клавиши служат для упрощения использования индикатора.
Настройки индикатора: Moving average #1 - скользящая средняя #1 Period - период усреднения Mode - метод сглаживания Price - используемая цена для расчё
FREE
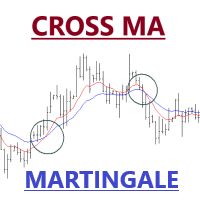
Expert Advisor of Cross two moving averages accompanied by stop loss, take profit, martingale and multi timeframes on each moving averages. You can change all the parameters contained in the moving averages
Please use as appropriate, hopefully can be useful and assist you in the transaction Don't forget to give a review if this product helps you
MA Method 0 = simple 1 = exponential 2 = smoothed 3 = LW
FREE
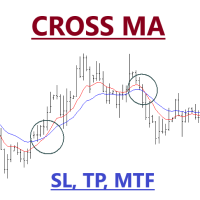
Expert Advisor of Cross two moving averages accompanied by stop loss, take profit and multi timeframes on each moving averages. You can change all the parameters contained in the moving averages
Please use as appropriate, hopefully can be useful and assist you in the transaction Don't forget to give a review if this product helps you
MA Method 0 = simple 1 = exponential 2 = smoothed 3 = LW
FREE

It's an expert to open and close orders on specific day and time. Expert open and close orders only with the same symbol it attached. Can set time open and close orders based day of year or day of week. Expert can send market orders and pending (stop or limit). Each order can placed with take profit and stop loss. There is option to use trailing stop loss and break even. Expert can manage only own orders or all orders of account.
Information about the expert's parameters can find on the blog .
FREE
Автоматический советник Unusual EA не предназначен для получения сверх прибыли.
Больше подойдет долгосрочным инвесторам, для которых трейдинг не игра, а работа.
Советник Unusual EA, также можно использовать в портфеле, совместно с другими советниками.
Размер прибыли и просадки зависит от выбранной валютной пары и таймфрейма.Наиболее эффективен на периодах M30,H1 и H4,
хотя может использоваться на любых таймфреймах и торговых инструментах.
Параметры советника:
MagicNumber- метка "своих" сделок

Open by Clik is a tool that allows you to open positions with two mouse clicks.
The place of the click and the direction of clicking decide what position will be opened.
Opening of positions is quick and intuitive.
If the second click is above the first click, opened are positions Long.
If the second click is belowe the first click, opened are positions Short.
By clicking in the chart area, opened are Market Order (BUY and SELL).
By clicking in the area in front of the chart, opened are Pendin
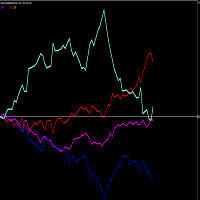
PLEASE NOTE THAT LIKE MANY SUCH INDICATORS ON THIS MARKET, THIS INDICATOR WILL NOT WORK AS A DEMO DOWNLOAD FOR STRATEGY TESTER. Therefore the 1 month option at the lowest cost allowed of $10 is available for you to test. One of the better ways to trade is to analyse individual currencies rather than currency pairs. This is impossible with standard chart indicators on MT4. This currency strength meter allows one to trade the USDZAR, EURZAR, GBPZAR. Each currency (not pair) is measured consta
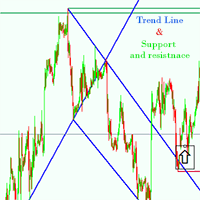
Support and resistance Strategy is one of the most widely used concepts in forex trading.
Strangely enough, everyone seems to have their own idea on how you should measure forex support and resistance. no more wasting time This Indicator is made to do it automatically for you, Features of support and resitance indicator * Automatically detection of the trend line and support & resistance * Works on any pair any time frame any time * Works on offline Chart Inputs : TrendLinePeriod=900 CycleSize
Beschreibung
Der Handelsautomat nutzt saisonale Muster. Es sind insgesamt sieben Strategien implementiert. Die Strategien A, B und AB und Christmas Run können mit verschiedenen Sets gefahren werden, für den Turnaround Tuesday lassen sich die gleitenden Durchschnitte variieren. Für die Witchcraft Wonder Strategie lassen sich Ein- und Ausstiegszeitpunkte anpassen. Weiterhin existiert ein variabler Filter, um Einstiege zu optimieren.
Unterstützte Märkte
AktienIndizes (bspw. S&P 500, DAX)
Gold (
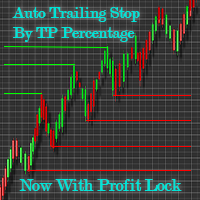
Automatic Trailing Stop Based on Take Profit Percentage with Profit Lock EA MT4 Lock in your profits and "let your winners run" past your 100% take profit target with this EA. This Expert Advisor automatically adjusts your Stop Loss based on up to 4 user-defined Take Profit Target Percentages, locking in your profit. If price pushes past your 100% take profit target, the EA will automatically trail the price by user-defined pips, so you won't miss that runaway train again. EA Features The

FLASH SALE!!!! 3 ACTIVATION LEFT!
Before you buy a Trend Buster please be aware of the risks involved: Past performance is no guarantee of future profitability (the EA could also make losses). The backtests shown (e.g. in screenshots) are highly optimized to find the best parameters but therefore results cannot be transferred to live trading. Any mean reversion can get caught on the wrong side of a fast movements due to unexpected news or flash crashes. This strategy will always use a stop


KT Power Pennant는 유명한 페넌트 패턴을 차트에서 자동으로 찾아 표시합니다. 페넌트는 하나의 방향으로 강한 가격 움직임이 발생한 후, 수렴하는 추세선으로 구성된 기간 동안의 조정을 특징으로 하는 추세 지속형 패턴입니다.
페넌트 패턴이 형성되면, 패턴 이후의 강세 또는 약세 돌파를 기반으로 매수 또는 매도 신호가 제공됩니다.
기능
페넌트 패턴은 조정 구간 이후의 돌파를 통해 낮은 리스크의 진입 기회를 제공합니다. 다른 기술적 분석 도구와 함께 사용할 경우, KT Power Pennant가 제공하는 신호는 높은 활용도를 가질 수 있습니다. 거래량이 감소한 조정 구간 뒤에 거래량이 증가하며 발생하는 돌파는, 기존 추세 방향으로의 지속 가능성을 높여줍니다. 모든 Metatrader 알림 기능이 구현되어 있습니다.
입력 파라미터
히스토리 바 수: 과거의 페넌트 패턴을 찾기 위한 캔들 수 패턴 크기: 페넌트 패턴의 크기와 강도를 결정하는 정수값 패턴 색상: 패턴을 구성

이것은 무료 제품이므로 필요에 따라 사용하시면 됩니다!
긍정적인 별 5개 평가를 남겨주시면 정말 감사하겠습니다! 감사합니다! 여기를 클릭하여 고품질 트레이딩 로봇과 지표를 확인하세요! ............................................................................. MT4용 외환 지표 스프레드 디스플레이, 훌륭한 보조 거래 도구. ............................................................................. - 스프레드 디스플레이 지표는 부착된 외환 쌍의 현재 스프레드를 표시합니다. - 차트의 어느 모서리에서나 스프레드 디스플레이 값을 찾을 수 있습니다. - 색상과 글꼴 크기도 설정할 수 있습니다. 이 MQL5 웹사이트에서만 제공되는 오리지널 제품입니다.
FREE
RSI Multi Timeframe Alert 기술 지표는 동시에 여러 시간대에 걸쳐 RSI(Relative Strength Index)에 대한 포괄적인 보기를 제공하도록 설계된 강력한 도구입니다. 트레이더는 이 지표를 사용하여 차트를 전환할 필요 없이 다양한 시간대에 걸쳐 과매도 및 과매도 조건을 쉽게 식별할 수 있습니다. 또한 RSI가 미리 정의된 과매도 또는 과매수 수준에 도달하면 모바일 및 팝업 알림을 보내는 빠른 경고 시스템이 포함되어 있습니다.
RSI Multi Timeframe Alert 지표의 주요 기능 중 하나는 빠른 액세스 버튼과 직관적인 컨트롤을 제공하는 사용자 친화적인 인터페이스입니다. 거래자는 설정과 매개변수를 쉽게 탐색할 수 있으므로 거래 기본 설정에 따라 지표를 편리하게 사용자 정의할 수 있습니다. 지표의 경고 시스템은 RSI가 과매도 또는 과매도 영역에 진입할 때 적시에 알림을 제공하는 또 다른 중요한 기능입니다. 트레이더는 자신의 선호도에 따라 특

Infinity Profit Scalper PRO a fully automated scalper adviser using a sophisticated algorithm for price breakdown at key price levels and a formula for calculating the price speed for the most accurate entry points into the market. Each market entry point is analyzed by an advanced selection algorithm. After identifying the optimal entry price, the advisor places a pending order, this allows you to open a transaction at the best price. Further orders are accompanied by an smart trailing stop. T

Cancer indicator is great for trend trading! An intelligent indicator algorithm with high probability shows the points of potential market reversal. If you are trading in a trend, then a trading strategy built on the basis of this indicator is perfect for you. The indicator filters out market noise, almost everything and all the necessary functions for working with a thread are built into one tool. It works on all currency pairs and on all timeframes, indicator setting - according to your desire

The Rise of Skywalker : It is an advanced trading system. This is a fully automatic Expert Advisor, which allows you to presize the trade according to the preferences of the trader. Is a revolution in the customization of the trading. The Rise of Skywalker is a expert advisor based in the indicator The Rise of Sky walker: ( https://www.mql5.com/es/market/product/44511 ) This system uses only one trade in each operation. Do not use Grip or martingale Low risk system since

Inspired from, Time is the most important factor in determining market movements and by studying past price records you will be able to prove to yourself history does repeat and by knowing the past you can tell the future. There is a definite relation between price and time. - William Delbert Gann
CITRA BOT is a Price Action/Price Pattern detection Indicator which uses historical data to validate a current pattern or profile to predict the probability of hitting future resistance or support le

I present to your attention a comprehensive indicator based on mathematical, historical and price calculations. The indicator will be very useful in building your own trading strategies and systems. What the indicator is capable of: 1. Builds channels based on price levels. It determines the strength of the channel and reflects it visually (the thicker the line, the more significant the channel. The dashed line is the weakest channel) 2. Builds waves based on the channels (the red line i

A new trend determination algorithm has been developed for this indicator. The algorithm with acceptable accuracy generates input signals and output levels. Strategy for trend trading, filtering and all the necessary functions built into one tool! The principle of the indicator’s operation is to automatically determine the current state of the market when placing it on a chart, analyze historical data based on historical data and display instructions for further actions on the screen to the trad

The art of Forex is a new complex Expert Advisor that continuously trades in both directions. A series of orders will be opened to get the best average price until the take profit is hit. It is optimal for making profits in an unpredictable market. A loss coverage system is integrated to allow the recovery of orders that are too distant from the current price. The best results are on EUR/USD H1 but you can use it on any forex pair and timeframe .
Live results : https://myx.gg/mql5
S
FREE

A trading adviser using an algorithm based on the ability to adapt to the current market situation. Signals: https://www.mql5.com/en/signals/author/old_padre Sets are in the "Comments" section comments #47-52. Key Advantages The EA does not use Martingale (Default sets); The minimum starting deposit is $100; No need to close the robot during news releases; It works with 4 and 5-digit quotes; A constructor of unique strategies; All orders are opened with a strictly fixed Stop Loss;
Adaptive alg

This Expert Advisor is recommended for newbies.
Bott is a Scalper Expert Advisor.
The expert advisor is running on price action on entry analysis and winning trades use trail stop to maximize the profit and uses stop-loss on reversing trade to minimize losses. The entry plan is to catch the general trend and catch some pips on that trend. In case the entry is not in favor and price reverses, it uses a Stop-Loss Lotsizing is specifically based on the parameter "Money Management". Very Importa

The indicator combines several types of calculation: calculation of price channels and determining the direction of the trend. The green line is a buy signal ; The magenta line is a signal for sales . Two yellow lines of the "small" channel above the middle green line - getting ready for sales; Two yellow lines below the magenta line - getting ready to shop. Blue channel lines - the higher the distance between the lines, the closer the price rollback or trend reversal. The indicator can be used

Extreme TMA System with Arrows Indicator And Buy/Sell Boxes with Take Profit & Stop Loss
This is a Non-Repainting Arrows Indicator based on the Extreme TMA System. It shows TMA cross signals and the best BUY/SELL signals. Along with the most predicted TakeProfit. And StopLoss based on TakeProfit ratio.
Please note: This is an Arrows only Indicator. Dashboard is sold separately here: https://www.mql5.com/en/market/product/44825
About Indicator: This indicator shows BUY/SELL Signal Arrows and

Condors TMA ( Triangular Moving Average ) is a channel indicator without redrawing, built on the basis of moving averages. The key difference between the Condor TMA indicator and other channel indicators (for example, from the same Bollinger indicator) is that Condor TMA takes into account not simple moving averages, but twice smoothed ones, which allows one to more clearly determine the market movement, and on the other hand makes the indicator less sensitive.
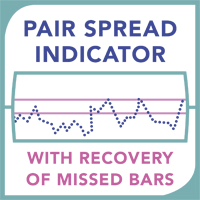
Pair Spread Indicator with recovery of missed bars. This indicator will automatically restore missed bars in the history at average prices of neighboring bars. A histogram chart shows the price difference between the two instruments in a separate window. Ideal for related instruments, for example: BRN - WTI, GOLD - 50 * Silver, DJ - 14 * S & P500, etc .; Calculation method: the difference in closing prices (opening / maximum / minimum) between two current bars and sequentially N-bars back; Hist
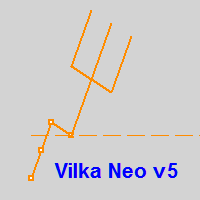
Вилка Нео v5, разрабатывалась для торговой системы "Оракул", но постепенно дополнялась, например - углами Ганна и другими опциями...
Можно создавать графические объекты с заданным цветом, стилем и толщиной, такие как: прямоугольники с заливкой и без, отрезки трендлиний и нестандартный инструмент - "вилка Нео" в виде трезубца, так же есть возможность интерактивно настраивать цветовую палитру прямо с графика, настраивать видимость объектов для разных ТФ, толщину и стили... Панель переключается кла
FREE

This Expert uses multiple indicators and special algorithm to choose the entry points and provide the maximum Gain with the minimum Risk .
Run the BackTest and check the efficienty of the product.
Working Conditions : This EA works on all Pairs on 15M Timeframe. With 1000 $ Balance
Input Parameters :
Trading Mode : Choose between 3 modes. AutoManagement : The lot will increase with the increasing of the balance. Trading Lot : The Lot is set manually. Take Profit : Set it by points. Spread

Special Offer, The Prices For Limit Time Golden Sign is an indicator that signals entry into buying or selling positions that works best on GBPs pairs and a 4-hour frame. It can make 20 to 200 Pips at every signal. Its success rate is over 80%. It contains two types of signal for each direction, one is slow and the second is faster. You can use any of them, but when the two combine together they are the strongest signal. Or you can add it to your strategy. Note: (Make sure to download the clear
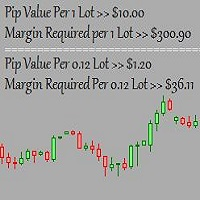
This is a basic tool that displays the Pip Value and Margin required for each symbol. It displays the same information for both a standard lot and the amount based on lot amount entered in the input section. It allows you to use different colors for each line Font Size FontType (Based on what fonts are installed in the system folder on the pc. Set to Ariel by default if the font entered is not available.) Allows X &Y coordinates so you can decide where on the chart the info is displayed.
FREE

추세 반전을 기반으로 작동하는 완전 자동 고급 거래 로봇입니다. 필요한 경우 그리드 전략을 사용할 수도 있습니다. 최대 카트 적재량에 도달하면 3가지 유형의 알림 및 위치 잠금 기능이 내장되어 있습니다. 기본 설정은 M15 시간대의 EURUSD에 권장됩니다. 기능 및 이점: 동시에 두 방향으로 작업할 수 있는 능력 여러 단계에서 정시에 작업하는 내장 기능 브로커가 볼 수 없는 가상 StopLoss를 사용합니다. 현재 추세의 활동을 기반으로 한 작업 알고리즘 자동 로트 계산 내장 모든 유형의 알림 사용 위치를 자동으로 잠그고 어드바이저를 비활성화하는 기능 장바구니의 후속 주문에 대한 TakeProfit 감소 현재 추세 또는 단계별로 개시 주문 조정 MT5 version -> HERE / Problem solving -> HERE 입력 변수에 대한 자세한 설명 및 설명 -> 여기 고문이 거래하는 방법: - 우선 거래 시 현재 추세 활동을 고려합니다("주요 추세

KT RSI Divergence robot은 가격과 RSI(Relative Strength Index) 오실레이터 사이에 형성되는 일반 및 숨겨진 다이버전스를 거래하는 100% 자동화된 전문가용 어드바이저입니다. 다이버전스 신호는 무료로 제공되는 RSI Divergence 지표에서 가져옵니다.
모든 다이버전스가 성공적인 가격 반전을 보장하는 것은 아닙니다. 따라서 이 EA는 원시 다이버전스 신호에 내장된 기술적 분석 모듈을 결합하여, 선택된 일부 다이버전스 이후 나타나는 가격 비효율성을 공략합니다.
권장 사항
Pairs: EURUSD, EURCAD, EURCHF, EURJPY, GBPJPY,USDCHF, USDJPY, XAUUSD Time-Frame: 1시간 Account Type: 제한 없음 Leverage: 1:100 R isk: 거래당 1%
특징 RSI 다이버전스 신호를 자동으로 거래하며, 수동 거래로는 구현이 거의 불가능한 다양한 고급 기능을 제공합
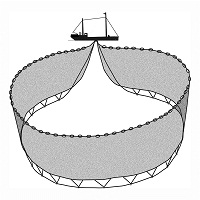
Dragnet Grid Expert Advisor는 보류 중인 주문 그리드와 함께 작동합니다. EA의 유연한 구성을 통해 지정가 및 지정가 주문은 물론 개별 주문도 동시에 배치할 수 있습니다. 또한 시장에는 현재 가격보다 높거나 낮은 한 가지 유형의 주문만 있을 수 있습니다. 권고자 설정에 대한 설명: ____1____ 주문 중지 - 정보 설정; Grid_Stop_BUY - 현재 가격 이상의 BUY STOP 주문에 대한 그리드를 활성화 또는 비활성화합니다. Grid_Stop_SELL - 현재 가격보다 낮은 SELL STOP 주문으로 그리드를 활성화 또는 비활성화합니다. Quantity_Stop_Orders - STOP 주문 그리드의 주문 수. Steps_Stop_Orders - STOP 주문 그리드에서 주문 사이의 단계. Take_Stop_Orders - STOP 주문 그리드의 이익 수준. Coefficient_Stop_Orders - = 0이 작동하지 않는 경우 STOP 주문

For the convenience of traders, many features have been added to make trading more comfortable and secure.
The Expert Advisor has a built-in author's indicator of protection against unidirectional grid.
Recommended tools : USDCHF; GBPUSD;
EURUSD;
USDJPY;
USDCAD;
AUDUSD;
EURJPY;
recommended minimum mm and settings: usdchf, deposit = $ 1000 , lot = 0.01 , expected annual profit on the instrument = 15-25% ;
GBPUSD , Deposit = $ 1000 , Lot = 0.01 , Expected annual profit on the i
FREE

Ea Stepper is a fully automated expert advisor for the mt4 platform,which can be used for short/medium/and long term strategies. The strategy is to find periods of very low volatility to place entries in the direction of daily trend. If trend direction changes and an open trade is in loss, a scaled lot trade will be opened in the opposite direction. It includes money management features such as an auto lot feature and stop loss by equity percentage to control risk.
SUGGESTED CONDITIONS:
ECN ac
FREE
This tool has proven itself well when tested on the Forex market on the EUR/USD currency pair. We also tested this tool for Binary Options and was able to show good quality signals on the EUR/USD currency exchange. SIGNALS DO NOT RENDERY MOVE THE ARROW BY 1 CANDLE MAXIMUM THIS IS EXTREMELY RARE TO ENCOUNTER
The signals of this instrument are formed during the candlestick. It is worth entering the trade after closing the candle on which the signal was generated. The green arrow indicates the po

I recommend you to read the product's blog (manual) from start to end so that it is clear from the beginning what the indicator offers. This multi time frame and multi symbol indicator identifies double top/bottom, head & shoulders, pennant/triangle and flag patterns. It is also possible to setup alerts only when a neckline/triangle/flagpole breakout has occured (neckline breakout = confirmed signal for top/bottoms and head & shoulders). The indicator can also be used in single chart mode.

The Rise of Sky walker is a trend indicator is a powerful indicator for any par and any timeframe. It doesn't requires any additional indicators for the trading setup.The indicator gives clear signals about opening and closing trades.This Indicator is a unique, high quality and affordable trading tool. Can be used in combination with other indicators Perfect For New Traders And Expert Traders Low risk entries. Never repaints signal. Never backpaints signal. Never recalculates signal. Great F

This indicator is looking for such market models as: head and shoulders, triangles, double tops and bottoms, flags, wedges and three touches.
Options:
barsToProcess - the initial number of bars to calculate;
ArrowSize - arrow size;
AllowablePatternLength - minimum length of the pattern (in bars);
AllowablePatternPriceDiv - the minimum height of the pattern, applicable for all but the 'head and shoulders', 'double top' patterns (for the latter there is another parameter);
AllowablePriceAberrat

The adviser uses a strategy based on the use of custom indicators; trading is carried out on 4 time frames. The expert uses the adaptive system for determining market entries for trading, which determines the most appropriate moment for opening an order. The adviser trades according to numerous patterns on currency pairs. The adviser uses economic news to achieve more accurate signals. Hidden Stop loss, Take Profit, Break Even and Trailing Stop are used. Use multicurrency testing for 11 currency

A real rarity for scalpers.
Are you looking for TFs lower than M1 ?
Do you want to see the price dynamics inside the candle?
This is a tool for you.
Visual Ticks is an indicator that shows the tick chart in a separate window.
He does it in real time waiting for changing ticks.
Thanks to Visual Ticks, we can look inside the traditional candle and see the dynamics of the moving price.
By setting "period_of_model" we can shape a chart made of candles.
"period_of_model" defines how many consecuti
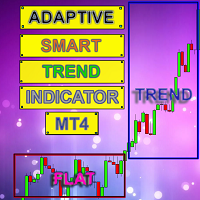
Smart indicator Adaptive Smart Trend Indicator determines the sectors of the Trend and the Flat and also in the form of a histogram shows the breakdown points of the levels (1 - 5).
The indicator performs many mathematical calculations to display more optimal Trend movements on the chart.
The program contains two indicators in one: 1 - draws the Trend and Flat sectors, 2 - the histogram indicator shows the best signals for opening an order. The indicator autonomously calculates the most

VisualTicks_EA is an Expert Advisor dedicated to the VisualTicks chart.
Works ONLY on the VisualTicks chart.
Is a tool that lets you open and close transactions directly on the VisualTicks chart.
There is only one parameter in EA settings:
magic - next EA number. If you use more than one VisualTicks_EA on MT4, you must enter a different magic number.
After starting VisualTicks_EA, the following buttons will appear on the chart:
Open BUY - opens one BUY transaction of a specified lot size.
Cl
FREE

BaxterStars is a fully automated trading system for the Metatrader4 platform. The robot trades on the scalping system. It opens trades for short positions. Depending on the market situation, it can open a different number of transactions, from 1-2 per week to 5 transactions per day. It all depends on how the market behaves. The robot works on a breakthrough strategy. It automatically determines the accumulation lines of the price range by setting virtual entry points at the level of these lines

This utility is a full game with a ball on a chart of a currency pair. The ball jumps along the line of the moving average, and it is controlled by arrows or the keys "w a s d". Try to keep the ball from falling out of bounds. There are several levels of difficulty, if at first it’s difficult, you can set a simple level, and when you train, increase difficulty. In this version, there are many more levels and there is an adversary who is chasing you.
When adding a game to a window with a chart,

Crazy Dancing moving RES/SUP Levels Automatic redrawing of moving Supports and resistances levels to indicate price breaking supports (signal SELL) or breaking resistance levels (signal BUY) Very simple appearing indicator but very clever and smart too !!!! Main Inputs: # of bars for the support and resistances levels + the initial shift from start + moving average for filter signaling Smaller values for bars /shift inputs when using Higher Time frames (D1-H4) and the reverse higher values for

KT CCI Divergence robot is a 100% automated expert advisor that trades regular and hidden divergence built between the price and Commodity Channel Index (CCI) oscillator. The divergence signals are fetched from our freely available CCI divergence indicator.
Not every divergence ends up in a successful price reversal, that is why this ea combines the raw divergences signals with its inbuilt technical analysis module to exploit the price inefficiency that occurs after some selected divergence si

KT Stochastic Divergence robot is a 100% automated expert advisor that trades regular and hidden divergence built between the price and Stochastic oscillator. The divergence signals are fetched from our freely available Stochastic Divergence indicator.
Not every divergence ends up in a successful price reversal, that's why this ea combines the raw divergences signals with its inbuilt technical analysis module to exploit the price inefficiency that occurs after some selected divergence signals.
MetaTrader 마켓 - 거래자를 위한 로봇 및 기술 지표는 거래 터미널에서 바로 사용할 수 있습니다.
The MQL5.community 결제 시스템은 MQL5.com 사이트의 모든 등록된 사용자가 MetaTrader 서비스에서 트랜잭션을 수행할 수 있습니다. 여러분께서는 WebMoney, 페이팔, 또는 은행 카드를 통해 자금을 예치하거나 인출하실 수 있습니다.
트레이딩 기회를 놓치고 있어요:
- 무료 트레이딩 앱
- 복사용 8,000 이상의 시그널
- 금융 시장 개척을 위한 경제 뉴스
등록
로그인
계정이 없으시면, 가입하십시오
MQL5.com 웹사이트에 로그인을 하기 위해 쿠키를 허용하십시오.
브라우저에서 필요한 설정을 활성화하시지 않으면, 로그인할 수 없습니다.