Rsi Decoder
- 지표
- 버전: 1.30
- 업데이트됨: 8 9월 2023
- 활성화: 5
Introducing RSI DECODER
"Time is the most important factor in determining market movements and by studying past price records you will be able to prove to yourself history does repeat and by knowing the past you can tell the future. There is a definite relation between price and time." - William Delbert Gann
Caution: RSI DECODER is not a Holy Grail System. It is a tool designed to give you insight into the current market structure. Trading decisions should be made in combination with an economic understanding of the underlying instrument, economic indicators, and economic news.
What is RSI DECODER?
RSI DECODER is a Price Action/Price Pattern detection Indicator that uses historical data to validate a current pattern or profile. It predicts the probability of future price movements based on forecast requirements.
Fundamentally, it forms a 3D (three-dimensional) box containing all historical data, clustering buy and sell probabilities for near-term forecasts. This provides users with well-informed predictions to trade confidently.
Primary Objective:
- Decrypt the relationship between future price and the RSI (Relative Strength Index) Indicator.
- Look back through the given historical period (Lookback period) to find the exact and closest matches of RSI and Smoothed RSI indicators for given maximum allowed errors.
- Form BUY - SELL probability ratios for the detected patterns based on the forecast period (Custom Input).
Advantages of Using RSI DECODER:
- Self-learning algorithm.
- Faster and superior to other machine learning models like Neural Networks, Regressions, SVM, Decision Tree, and Random Forest.
- Faster response rate when switching timeframes.
- Precision-based profile detection, controlling noise allocation based on user requirements.
- EA Integration.
- Custom precision percentage (Max_Allowed_Change).
- Custom email and push notification alerts.
- Complete knowledge about the current pattern (profile) and its future behavior.
- Identify potential reversals or trend continuations when RSI is in overbought or oversold regions.
- Operates smoothly up to a 20,000 lookback period (much faster than conventional methods).
Recommended TimeFrame:
- M30 and above
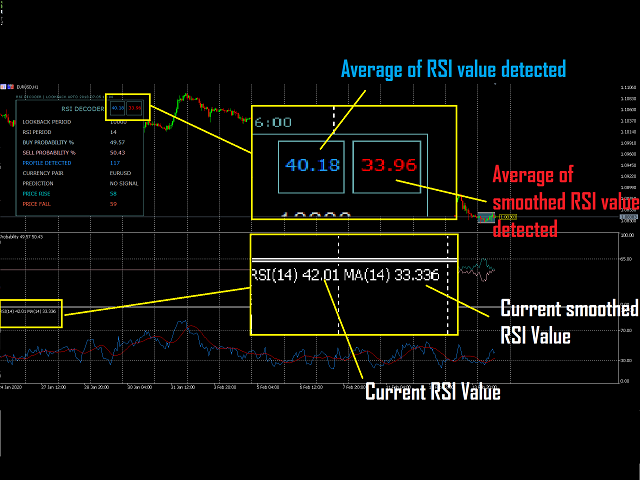
Major Features in Profile Detection:
- Relative Strength Index of the profile with respect to adjacent price.
- Smoothed Relative Strength Index.
- Profile dimension.
- Correlation with price.
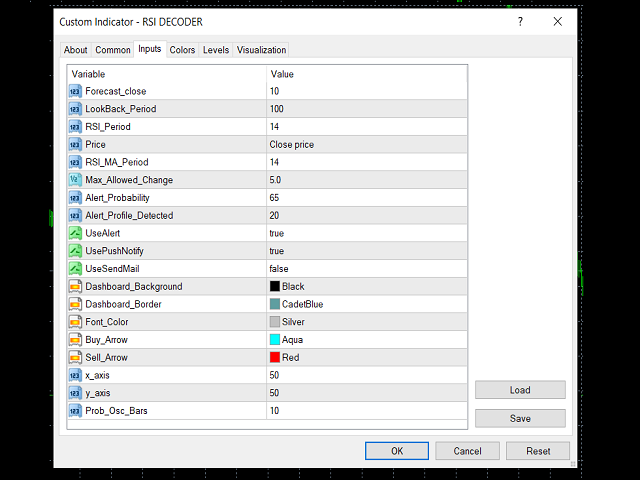
Important Input Parameters:
- Forecast_close: Close price of the specified bar in the future for prediction.
- LookBack_Period: Number of bars to look in historical memory for exact profile (download required historical data as per LookBack Period).
- RSI_Period: Number of bars to consider for calculating the Relative Strength Index.
- RSI_MA_Period: Number of bars to consider for calculating the average of the Relative Strength Index.
- Max_Allowed_Change: Percentage of exact match of the recent profile with respect to detected profiles.
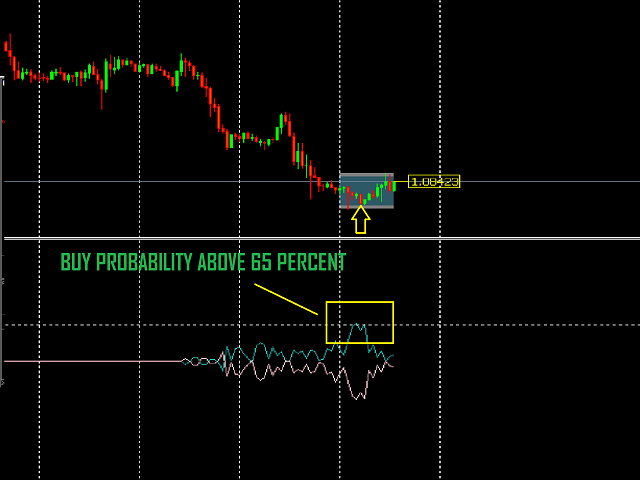
- Alert_Probability: Probability of getting an alert.
- Alert_Profile_Detected: Alert on exceeding the number of profiles detected.
- x_axis, y_axis: Positioning of the display dashboard on the chart.
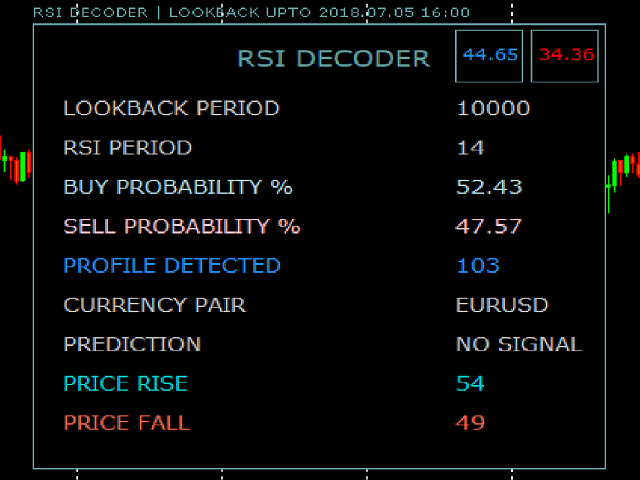
Probability Calculation:
- Buy Probability: (Price Rise / (Price Rise + Price Fall) * 100)
- Sell Probability: (Price Fall / (Price Rise + Price Fall) * 100)
Trade Setup:
- Buy: Up Arrow Popup
- Sell: Down Arrow Popup
Unlock the potential of your trading strategy with the RSI DECODER. Experience faster, more accurate predictions and make informed decisions based on comprehensive market analysis. For more information and to download the EA, visit: RSI DECODER EA
Thank you!


I am a big fan of RSI and find this indicator useful in my quiver of arrows . The fact that the author provides an EA is very helpful and merits a mention.