 MetaTrader 5
 Experts
 지표
지표 스크립트
스크립트 라이브러리
라이브러리 보관함
보관함당사 팬 페이지에 가입하십시오

Relative Moving Average Indicator - MetaTrader 5용 지표

- 조회수:
- 10
- 평가:
- 게시됨:
-
 이 코드를 기반으로 한 로봇이나 지표가 필요하신가요? 프리랜스로 주문하세요
프리랜스로 이동
이 코드를 기반으로 한 로봇이나 지표가 필요하신가요? 프리랜스로 주문하세요
프리랜스로 이동

개요
이것은 다니엘 알렉산드르 블로흐 박사가 저서 『RMA를 활용한 체계적 트레이딩 강좌』에서 소개한 상대 이동 평균(RMA) 프레임워크를 MetaTrader 5에 충실하게 이식한 것입니다. 고전적인 이동평균은 가격 창을 하나의 평활화된 수치로 축소하는데, 이는 가격 수준은 알려주지만 그 희소성은 알려주지 않습니다. 즉, 높은 종가는 주변 가격들과는 크게 차이가 날 수도 있고, 높으면서도 해당 창 내에서 전혀 특별할 것이 없을 수도 있습니다. RMA는 두 번째 질문에 답합니다. RMA는 추적 창을 작은 분포로 간주하고, 그 안에서 현재 가격을 순위 매긴 뒤, 모든 금융 상품과 모든 변동성 환경에서 동일한 의미를 갖는 [0, 1] 척도로 그 순위를 표시합니다.
이 프레임워크는 세 가지 계층으로 구성되어 있으며, 코드도 이를 정확히 반영합니다:
- W개의 종가를 포함한 후행 윈도우의SMA는 국소적 평형점으로 간주되어 0으로 고정됩니다.
- RMA 계열은 각 창(window)의 랜드마크가 해당 평형점에서 벗어난 편차를 순수한 비율 sma / (x - 1)로 표현한 것으로, 마지막 종가, 첫 번째 종가, 중간 종가, 그리고 창의 최저가 및 최고가에서 계산됩니다. 비율이기 때문에 규모에 구애받지 않으며 종목 간 비교가 가능합니다.
- 분위수(fractiles)는 윈도우를 정규화된 수익률([종가 / SMA - 1])로 재표현하고, 해당 분포 내에서 현재 가격, 최저 가격, 최고 가격의 순위를 매깁니다. 이는 논문의 부록 정의에서 그대로 인용한 순수한 경험적 누적분포함수(CDF)이며, f_w는 하류 단계의 모든 계산이 실제로 기반으로 하는 시계열입니다.

구성 방식: 종가들의 슬라이딩 윈도우가 SMA가 되고, 종가들은 해당 SMA를 중심으로 한 정규화된 수익률 분포로 재표현되며, 해당 분포 내에서 현재 가격의 순위가 [0, 1] 척도상의 프랙타일이 됩니다.
이 외에도 엔진에는 두 가지 파생 지표가 포함되어 있습니다. 체제 감지기는 논문에서 제시한 상대 극값 비율(Relative Extremum Ratios)을 최소제곱 기울기, z-점수 및 변동계수로 검증하여, 정규화된 수익률의 분포를 확장, 축소 또는 전환 상태로 분류합니다. 역방향 움직임 모니터는 중앙값을 기준으로 재조정된 사분위수인 d_med_w와, 최근 봉 간 변동 중 상승한 비율인 D_k를 산출합니다. D_k는 방향 일관성 지표로서, “이 움직임이 반대 방향으로 가고 있다”는 사실을 주관적인 판단이 아닌 정확한 수치로 제시합니다.
두 가지 프로그램이 포함되어 있습니다. RMA_Engine은 모든 시계열을 계산하여 19개 전부를 버퍼로 출력하므로, Expert Advisor나 다른 지표가 수학적 계산을 재구현하여 동기화 오류가 발생하는 대신 차트에서 정확한 수치를 직접 읽을 수 있습니다. RMA_Panel은 아무런 계산도 수행하지 않습니다: 차트에 이미 연결된 엔진을 찾아내어, 해당 엔진의 버퍼 그룹을 별도의 하위 창에 반영하기만 합니다. 이는 RMA 계열이 백분율의 소수점 단위로 측정되고 d_med_w가 0을 중심으로 하기 때문에, 둘 다 엔진의 0~1 축에서는 판독할 수 없기 때문입니다.
엔진이 그리는 것
엔진은 수직축이 [0, 1] 범위로 고정된 별도의 창을 열고 여섯 개의 그래프를 그립니다:
| 그래프 | 모양 | 표시 내용 |
|---|---|---|
| 영역 | 모든 요소 뒤에 전체 높이의 색상 띠 | 확장 시 녹색, 수축 시 빨간색, 확장 국면이 전환될 때 황색, 수축 국면이 돌파될 때 파란색. 체제가 아직 결정되지 않은 상태에서는 아무것도 그려지지 않으므로, ‘아직 답이 없다’는 의미의 색칠로 워밍업이 시작되지 않습니다. |
| f_w | 굵은 파란색 선 | 현재 종가의 분位수: 최근 정규화 수익률이 해당 창 내에서 차지하는 순위. 이것이 주요 시리즈입니다. |
| f_min / f_max | 빨간색 및 녹색 점선 | 창의 최소값과 최대값에 해당하는 분位수, 즉 f_w가 통과하는 엔벨로프의 하한과 상한입니다. |
| alpha_lo_mean / alpha_hi_mean | 보라색 및 주황색 선 | 평활화된 사분위수 수준: f_w와 그 보수의 EMA(지수 이동 평균)로, f_w의 급격한 변동이 스파이크로 인식될 수 있도록 더 느린 배경을 제공합니다. |
두 진입 임계값과 중앙값에 세 개의 수평 가이드가 그려집니다. 이 가이드들은 하드코딩된 것이 아니라 동반되는 Expert Advisor에 제공되는 것과 동일한 입력값을 기반으로 구축되므로, 임계값을 재조정하면 차트가 규칙과 조용히 어긋나는 상황을 남기지 않고 가이드가 함께 이동합니다.
해석 방법. f_w가 상단 가이드에 밀착되어 있다면, 현재 종가가 해당 창에서 관측된 모든 값 중 최고점에 위치함을 의미하며, 이는 하향 횡단(downward traversal)이 발동되는 지점입니다. f_w가 하단 가이드에 위치해 있다면 이는 그 반대의 경우입니다. 중위값은 횡단 움직임이 여전히 우측에 위치해야 하는 수준이며, 이를 넘어서면 자연스럽게 청산됩니다. 색상 띠는 이러한 해석에 맥락을 제공하는데, 이는 본 논문의 접근 방식이 확장 국면 시작 시점에 포지션을 개설하고 수축 국면 중에 청산하는 것을 원칙으로 하기 때문입니다.
권장 설정
| 설정 | 권장 값 | 비고 |
|---|---|---|
| 종목 | 임의 | 분위수 척도는 자체 정규화되므로, 판독값이 유의미하기 위해 기호별 보정이 필요하지 않습니다. 개발 과정 및 아래 스크린샷에서는 EURUSD를 사용했습니다. |
| 시간대 | M30 ~ H4 | 모든 시간대에서 작동합니다. 창 크기는 바(bar) 단위로 측정되므로, 동일한 W 값을 가진 더 짧은 시간대는 단순히 더 짧은 시장 구간을 나타낼 뿐입니다. |
| 창 크기 (W) | 106 바 | 기본값입니다. 본 논문에서는 윈도우를 자산별로 보정할 것을 의도하고 있으므로, 이는 권장값이라기보다는 출발점입니다. |
| 필요한 과거 데이터 | W + 체제 룩백 바 | 기본값 기준 126 바. 각 플롯은 세트 중 가장 긴 워밍업 시점부터 시작하는 것이 아니라, 해당 모듈이 최초로 응답할 수 있는 지점에서 시작하므로, 레짐 밴드보다 분位수가 먼저 나타납니다. |
주요 특징
논문에 충실
- 분위수는 논문 부록의 정의인 f_i = (1 / |W_i|) * sum_j I( W_ij <= v_i ) 를 그대로 구현했습니다. 논문의 본문과 부록의 내용이 일치하지 않는 경우, 부록의 내용을 우선하며, 불일치 사항은 묵묵히 수정하기보다는 소스 코드에 그 내용을 명시적으로 기록합니다.
- 정역 분류는 상대 극값 비율(Relative Extremum Ratios)을 따르며, 수축은 가장 엄격한 해석이고 확증이 필요하기 때문에 먼저 테스트하는 반면, 팽창은 의도적으로 도달하기 쉽게 설정되었습니다.
- 소스 코드가 명시적으로 요구하지 않는 스무딩, 임계값 또는 필터는 추가되지 않았습니다.
다른 프로그램에서 읽을 수 있도록 구축됨
- 19개 시리즈 모두 지표 버퍼로 노출되며, 6개는 그래프로 표시되고 13개는 계산 전용이므로, EA는 차트에 표시된 것과 동일한 수치를 읽을 수 있고 두 값이 서로 일치하지 않는 일은 절대 없습니다.
- 버퍼 맵은 단일 공유 헤더에 존재하므로, 엔진, 패널 및 모든 소비자는 누구에게도 경고하는 컴파일 오류 없이 서로 멀어지는 대신 하나의 공통 언어를 사용합니다.
- 수학적 계산은 차트나 주문에 의존하지 않는 헤더 전용 클래스에 전적으로 포함되어 있으므로, 동일한 코드로 스텁 처리 없이 스크립트나 테스트 하네스를 구동할 수 있습니다.
정확한 증분 재계산
- 각 패스는 prev_calculated가 아닌 prev_calculated-1부터 재계산합니다. 해당 인덱스의 막대는 이전 호출 시점에 아직 형성 중이었고, 그 종가는 지금에서야 최종값이 되었습니다. 이를 그대로 두면, 이에 의존하는 모든 시리즈에 반쯤 형성된 값이 고정되어 버리고, 막대 간 사분위수 차이는 두 개의 미완성 숫자 간의 차이가 되어 버릴 것입니다.
- 워밍업 바는 0이 아닌 EMPTY_VALUE를 가지므로, 워밍업 도중에 데이터에 접근하는 소비자는 타당한 숫자 대신 "부재"를 보게 됩니다.
- 체제 분류는 전환 대역 내에서 경로에 따라 달라지므로, 하나의 연속된 필드 대신 바별 이력이 유지되며, 이를 통해 증분 처리가 이전 바에서 체인을 다시 이어받을 수 있습니다.
두 번째 축을 차용하는 패널
- 엔진은 요청받은 패널을 자동으로 열며, 먼저 차트를 확인하여 이미 해당 패널을 포함하고 있는 템플릿이나 입력 변경 후 재초기화 시 첫 번째 패널 뒤에 두 번째 복사본이 중복되어 쌓이지 않도록 합니다. 패널은 엔진과 함께 제거되지만, 실제로 제거될 때만 제거되므로 시간대를 전환하면 떠나기 전의 레이아웃으로 돌아갑니다.
- 패널은 자체 핸들을 생성하는 대신 차트상의 짧은 이름을 일치시켜 엔진을 찾으므로, 실제 계산 결과 옆에 매개변수가 다른 두 번째 계산 결과가 중복되어 표시되는 일이 절대 발생하지 않습니다.
스크린샷
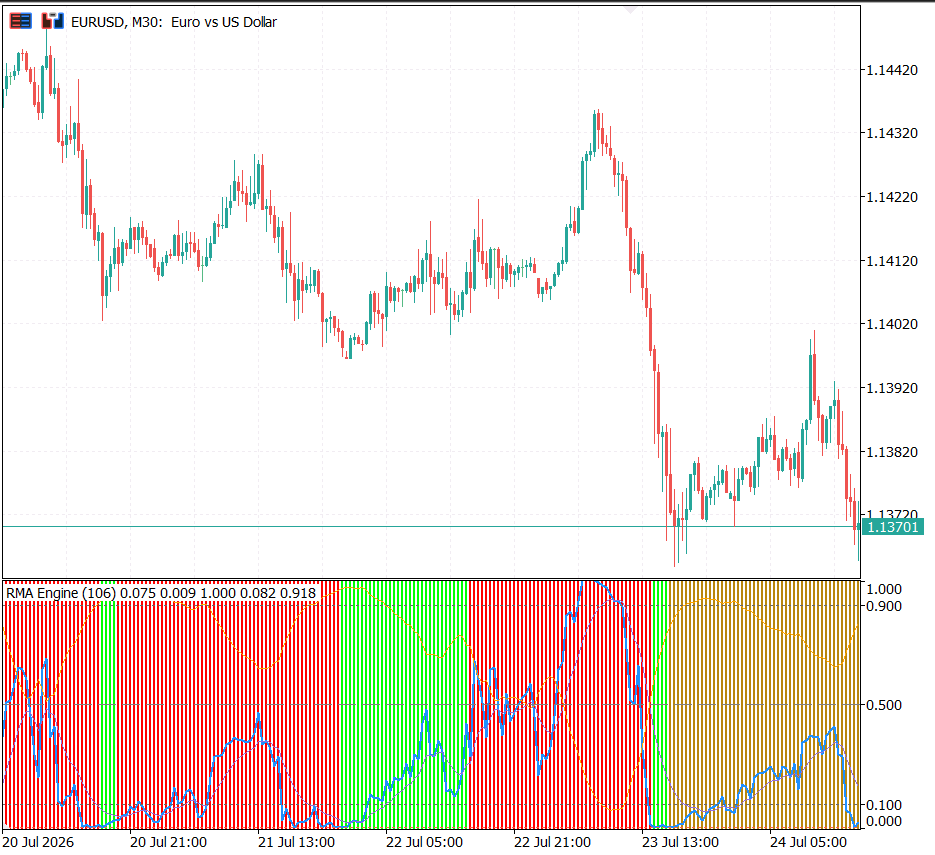
EURUSD, M30 차트의 엔진 창: f_w와 그 엔벨로프, 그리고 평활화된 사분위수 평균이 색상 구역 배경 위에 표시되어 있습니다.
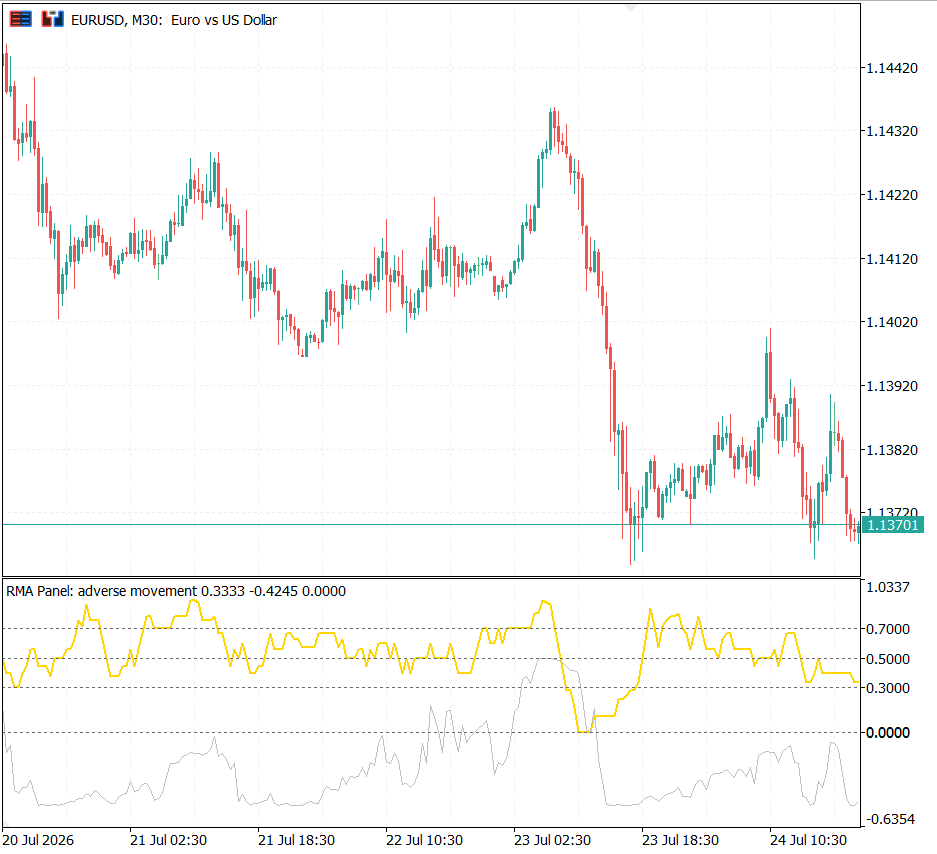
상반된 패널: 0을 중심으로 한 d_med_w와 그 위에 표시된 방향 일관성 지표인 D_k.
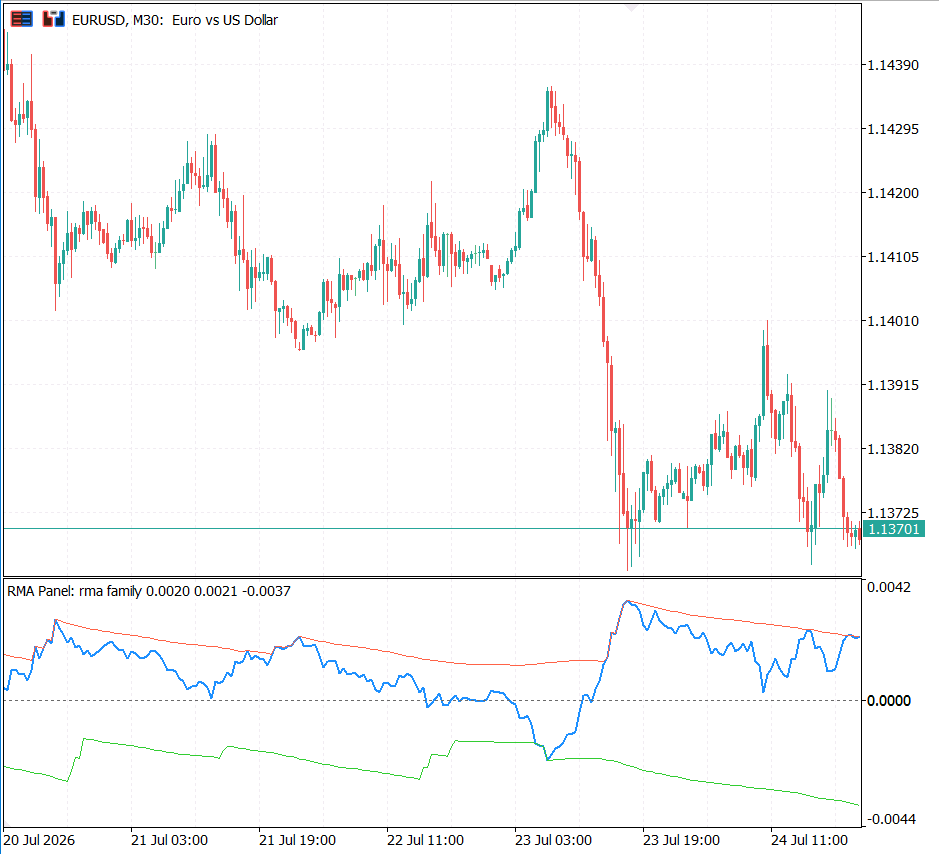
RMA 계열 패널: rma_w는 별도의 눈금에 창 최저값과 최고값을 표시하며, 엔벨로프는 현재 가격이 통과하는 경로를 나타냅니다.
설치 및 파일 구조
두 개의 지표와 네 개의 헤더 파일. 레이아웃이 중요합니다: 엔진은 상대 경로 RMA\RMA_Panel을 통해 패널을 불러오며, 헤더 파일은 <RMA\...> 형식으로 포함되므로 둘 다 RMA 하위 폴더에 위치해야 합니다.
| 파일 | 역할 | 설명 |
|---|---|---|
| Indicators\RMA\RMA_Engine.mq5 | 메인 지표 | 실시간 바에서 세 가지 모듈을 실행하고, 총 19개의 버퍼를 바인딩하며, 여섯 개의 차트와 레짐 밴드를 그리며, 패널을 엽니다. 자체적인 수학적 계산은 포함하지 않습니다. |
| Indicators\RMA\RMA_Panel.mq5 | 패스스루 패널 | 차트 상에서 엔진을 찾아내고, 엔진의 버퍼 그룹 하나를 별도의 눈금표를 가진 하위 창에 미러링합니다. 두 가지 모드: 역방향 움직임(D_k, d_med_w) 및 RMA 계열(rma_w, rma_min, rma_max). |
| Include\RMA\RmaTypes.mqh | 공유 어휘 | 레짐 및 크로스 스테이트 열거형, 버퍼 맵, 플롯 및 팔레트 개수. 엔진, 패널 및 모든 소비자 간에 공통으로 적용되는 유일한 부분입니다. |
| Include\RMA\RmaCore.mqh | 수치 핵심 | SMA, 5가지 RMA 계열, 정규화된 수익률 분포, 분位수 함수, 윈도우 범위 및 평활화된 알파 경계. |
| Include\RMA\RegimeDetector.mqh | 레짐 분류 | 기울기, z-점수 및 변동계수를 통해 검증된 극값 비율 엔벨로프로부터 도출된 확장, 수축 및 두 가지 과도 상태. |
| Include\RMA\AdverseMonitor.mqh | 방향성 일관성 | d_med_w: 중앙값을 중심으로 한 분位수, D_k: 최근 막대 간 변동 폭에서 상승 추세의 비중. |
자신만의 코드에서 버퍼 읽기
RMA\RMA_Engine 에서 iCustom을 사용하여 핸들을 확보하고, CopyBuffer를 통해 아래의 인덱스를 읽습니다. 인덱스 0~6은 플롯된 시계열이고 7~18은 계산 전용이지만, 19개 모두 읽을 수 있습니다.
| 인덱스 | 시리즈 | 의미 |
|---|---|---|
| 0, 1 | 리짐 밴드, 색상 인덱스 | 배경의 높이와 색상 슬롯. 수치는 포함되지 않으며, 오직 색상만 나타냅니다. |
| 2 | f_w | 창의 마지막 정규화된 반환값의 분위수([0, 1] 범위). 주 시계열. |
| 3, 4 | f_min, f_max | 창의 최소값과 최대값에 대한 분位수. |
| 5, 6 | alpha_lo_mean, alpha_hi_mean | 알파 하한 및 상한의 지수 이동 평균(EMA). |
| 7 | sma | 가격 단위로 표시된 창(window)의 단순 이동 평균. |
| 8~12 | rma_w, rma_1, rma_mid, rma_min, rma_max | RMA 계열: sma를 최근, 첫 번째, 중간, 최소 및 최대 종가로 나눈 값에서 1을 뺀 값. |
| 13 | 범위 | 창의 정규화된 수익률의 분산으로, 체제 탐지기가 판독하는 값입니다. |
| 14, 15 | alpha_lo, alpha_hi | f_w가 차지하는 원시 사분위수 수준과 그 보충값. |
| 16 | regime | 리짐 열거값(double 형식): 0 확장, 1 수축, 2 롤오버, 3 돌파, 4 알 수 없음. |
| 17, 18 | D_k, d_med_w | 방향 일관성과 중앙값 중심 사분위수. |
입력 매개변수
| 그룹 | 매개변수 | 기본값 |
|---|---|---|
| 창 | InpWindowSize, InpSmoothingPeriod | 106 바, 10 |
| 체제 감지 | InpEpsilonLow, InpEpsilonHigh, InpSlopeThreshold, InpRegimeLookback, InpVariationRatioLow, InpZScoreExpansion, InpRangeHistoryLookback | 0.15, 3.0, 0.0001, 20, 0.1, 1.0, 100 |
| 부정적 움직임 | InpAdverseLookback | 10봉 |
| 기준선 | InpEntryUpperThreshold, InpEntryLowerThreshold | 0.9, 0.1 |
| 패널 | InpAutoAttachPanels, InpPanelAdverse, InpPanelRmaValues, InpAdverseThresholdDown, InpAdverseThresholdUp | true, true, false, 0.3, 0.7 |
| 체제 배경 | InpShowRegimeBand 및 체제당 한 가지 색상 | true, 짙은 녹색 / 빨간색 / 호박색 / 파란색 |
연구 근거
구현은 다음을 따릅니다:
- Daniel Alexandre Bloch, 『 RMA를 이용한 체계적 거래 강좌(A Course on Systematic Trading with RMA)』, SSRN에서 이용 가능.
원문에서 직접 언급된 사항이므로 한 가지 주의할 점을 분명히 밝히겠습니다. 이 논문의 ‘결과(Results)’ 섹션은 향후 연구 과제로 남겨져 있습니다. 이 논문은 실증적인 실적 기록이 아닌, 프레임워크와 그 작동 원리를 제시합니다. 이 지표가 제공하는 것은 어디서나 동일한 의미를 지닌 척도로 기술된 시장 상태이며, 이는 원본에서 계승된 검증된 우위라기보다는 여러분이 직접 테스트를 수행할 수 있는 토대가 됩니다.
관련 논문에서는 수학적 배경과 각 모듈의 구현 과정을 단계별로 설명하며, 이러한 버퍼를 기반으로 거래하는 전문가 자문가(Expert Advisor)를 구축합니다: 『 MQL5를 이용한 블로흐의 상대 이동 평균(RMA) 프레임워크 구현』.
MetaQuotes Ltd에서 영어로 번역함.
원본 코드: https://www.mql5.com/en/code/75472
SMC Entry Using structure
Market Structure & Smart Trade Tracker (MT5) An advanced all-in-one Smart Money Concepts (SMC) indicator that combines automated market structure mapping, momentum heatmap candles, and institutional trade execution tracking.
Adaptive_MACD
Adaptive MACD is a dynamic momentum indicator that adjusts its smoothing based on market conditions. It calculates a Pearson correlation coefficient between price and bar index over a user-defined period, then uses the resulting R² to blend two different MACD coefficient sets. This makes the MACD line more responsive during strong trends and smoother in sideways markets. The indicator plots a color-coded histogram (strong/weak bullish/bearish) and an optional auto-contrast MACD line that adapts to the chart background. Inputs allow customization of the R² period, fast/slow lengths, signal period, and colors. Suitable for trend-following and detecting momentum shifts.
 Trading Panel EA
Pro Manager는 프로프 펌과 전문 트레이더를 위해 개발된 올인원 MT5 트레이딩 보조 도구입니다. 손익분기점(Break-even), 평균 목표가(Average TP), 매직 넘버 관리, 오토 그리드(Auto Grid)와 같은 강력한 도구를 활용하여 거래를 더 빠르게 실행하고, 포지션을 더 스마트하게 관리하며, 리스크를 효율적으로 통제하고, 일상적인 트레이딩 업무를 자동화할 수 있습니다.
 Broker Execution Diagnostics
A read only MT5 script that reports broker symbol specifications, volume limits, price settings, execution modes, trading permissions, margin requirements and estimated profit values.