당사 팬 페이지에 가입하십시오
- 조회수:
- 206
- 평가:
- 게시됨:
-
 이 코드를 기반으로 한 로봇이나 지표가 필요하신가요? 프리랜스로 주문하세요
프리랜스로 이동
이 코드를 기반으로 한 로봇이나 지표가 필요하신가요? 프리랜스로 주문하세요
프리랜스로 이동
켈트너 채널(메타트레이더 지표) - 1960년 체스터 W. 켈트너가 개발한 고전적 기술 분석 지표입니다. 이 지표는 볼린저 밴드 및 엔벨로프와 다소 유사합니다. 중간 선은 일반적인 가격((고가 + 저가 + 종가)/3)에 10일 단순이동평균을 적용한 것이고, 상단 및 하단 밴드는 중간 선에서 일일 가격 범위의 이동평균(고가 및 저가 차이)을 더하고 빼서 만들어집니다. 이런 식으로 변동성 기반 채널이 만들어집니다. 이 버전의 인디케이터에서는 MA의 모든 매개 변수를 수정할 수 있습니다. 이 인디케이터는 MT4 및 MT5 버전의 플랫폼에서 모두 사용할 수 있습니다.
입력 매개변수
- MA_기간 ( 기본값 = 10) - 이동평균(중간 선)의 기간입니다.
- Mode_MA ( 기본값 = MODE_SMA) - 이동평균(중간선)의 모드입니다.
- Price_Type ( 기본값 = PRICE_TYPICAL) - 이동평균(중간 선)의 적용 가격입니다.
예시 및 전략
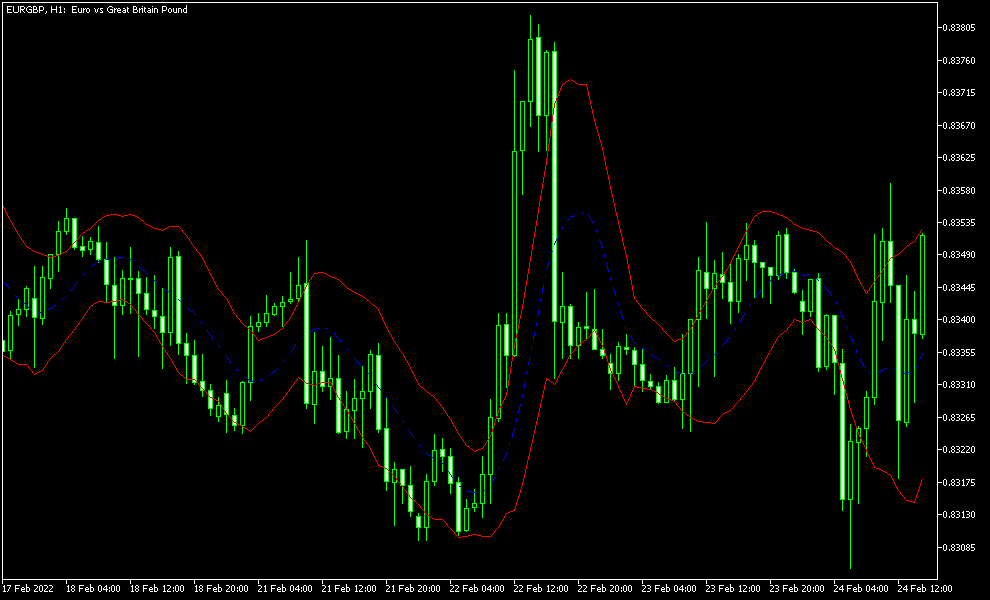

이 인디케이터의 고전적인 전략은 가격이 상단 밴드 위에서 마감되면 매수하고 하단 밴드 아래에서 마감되면 매도하는 것입니다. 이는 다소 실행 가능한 진입 시스템으로 보입니다. 출구는 매우 보수적인 스톱로스(차트에서 볼 수 있듯이 잘못된 신호가 드물지 않음), 다소 먼 테이크프로핏, 중간 선과의 교차 등 세 가지 구성 요소를 기반으로 할 수 있습니다. 일부 트레이더는 확인을 위해 다른 지표를 사용할 것을 제안하기도 합니다.
수학적으로 이 채널은 상승 추세에서는 위쪽, 하락 추세에서는 아래쪽에 더 많은 가중치가 부여된 밴드를 나타냅니다. 이는 이미 형성된 상승 추세에서 위쪽 선이 깨질 가능성이 적다는 것을 의미합니다. 이미 형성된 하락 추세에서는 그 반대의 경우도 마찬가지입니다.
MetaQuotes Ltd에서 영어로 번역함.
원본 코드: https://www.mql5.com/en/code/55392
 이동 평균 수렴/발산 표시기 Blau_MACD
윌리엄 블라우 이동 평균 수렴/발산 지표.
에르고딕 DTI 오실레이터 Blau_Ergodic_DTI
윌리엄 블라우의 에르고딕 DTI 오실레이터(방향성 추세 지수).
Float MT5
플로트 메타트레이더 지표 - 특정 통화쌍의 이전 차트 기록을 분석한 다음 현재 상황의 추세를 분석하는 정교한 지표입니다. 별도의 차트 창에서 추세가 시작되고 끝나는 지점과 피보나치 되돌림 수준을 기본 차트에서 디나폴리 수준과 결합하여 보여줍니다. 또한 로컬 고점과 저점이 감지된 시간도 표시합니다. 이 인디케이터는 MT4 및 MT5에서 사용할 수 있습니다.
Blau_CMI 캔들스틱 모멘텀 지수 인디케이터
윌리엄 블라우의 캔들 모멘텀 지수(CMI) 지표.