거래 로봇을 무료로 다운로드 하는 법을 시청해보세요
당사를 Telegram에서 찾아주십시오!
당사 팬 페이지에 가입하십시오
스크립트가 흥미로우신가요?
그렇다면 링크 to it -
하셔서 다른 이들이 평가할 수 있도록 해보세요
스크립트가 마음에 드시나요? MetaTrader 5 터미널에서 시도해보십시오
지표

Hammer Indicator - MetaTrader 5용 지표

조회수:
8625
평가:
(11)
게시됨:
2024.10.31 01:49
Hammer.mq5 (8.5 KB) 조회
MQL5 프리랜스 이 코드를 기반으로 한 로봇이나 지표가 필요하신가요? 프리랜스로 주문하세요 프리랜스로 이동

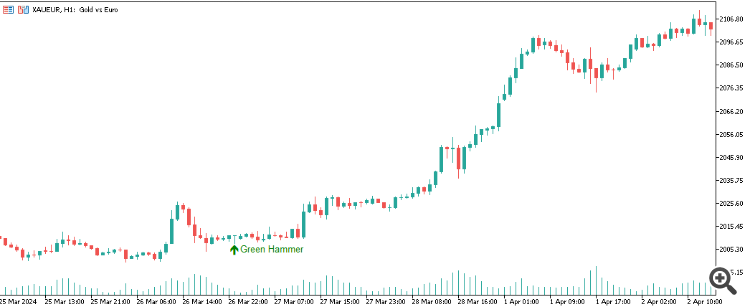
The Hammer Indicator identifies key candlestick formations, specifically green and red hammers as well as inverted hammers, on a MetaTrader 5 chart. It is designed to highlight potential reversal points in price by analyzing the candlestick structure on each bar. A hammer is generally characterized by a small body and a long lower wick, indicating potential buying pressure after a downtrend. The inverted hammer, in contrast, has a long upper wick and may suggest a possible reversal following an uptrend.

This indicator calculates the size and ratio of candlestick wicks and bodies to detect these patterns, using three main customizable parameters:

  • MaxRatioShortWick: Sets the maximum ratio for the short wick relative to the full candlestick, filtering for patterns with minimal top wicks.
  • MinRatioLongWick: Defines the minimum ratio for the long wick, ensuring that the detected patterns have significant wick lengths compared to the candlestick body.
  • MinCandleSize: Specifies the minimum size of the candlestick required to qualify as a hammer or inverted hammer pattern.

Once a pattern is identified, the indicator will display an arrow in a designated color (green or red) on the chart, placed near the highest or lowest price of the candlestick, depending on the direction of the pattern. The functions within the code handle the creation and positioning of these graphical objects, as well as cleaning up the objects when the indicator is removed from the chart.

This indicator is suitable for traders looking to spot potential reversals, and its parameters can be tailored to suit different timeframes and market conditions. It is a versatile tool that can complement various trading strategies by providing early visual cues for potential price changes.

Hammer Indicator
Day Of Week, Week Of Year and other marks in Data Window and on chart Day Of Week, Week Of Year and other marks in Data Window and on chart

WeekDays indicator displays Day Of Week, Week Of Year, Day Of Year or Bar Index in the Data Window, and optionally in labels on the chart.

AutoFibo indicator of two last swings based on ZigZag AutoFibo indicator of two last swings based on ZigZag

The AutoFibo indicator is an advanced Fibonacci retracement tool that automatically draws Fibonacci levels based on the ZigZag pattern. This indicator is designed to help traders quickly identify potential support and resistance levels in trending markets.

Extreme highs and lows with tick prices Extreme highs and lows with tick prices

Marking the extreme highs and lows (OHLC) together with the extreme bid and ask prices

Economic Calendar Monitor and Cache for Backtesting on History Economic Calendar Monitor and Cache for Backtesting on History

This indicator displays current events on the chart and allows you to export the calendar to archives for backtesting, automatically fixing time discrepancies between the history of bars and the history of events. This is an improved version of CalendarMonitorCached indicator from the algotrading book.