
|
10+ 年
経験
|
60
製品
|
241
デモバージョン
|
|
629
ジョブ
|
0
シグナル
|
0
購読者
|


Taras Slobodyanik

· 1
chidex
2018.04.20
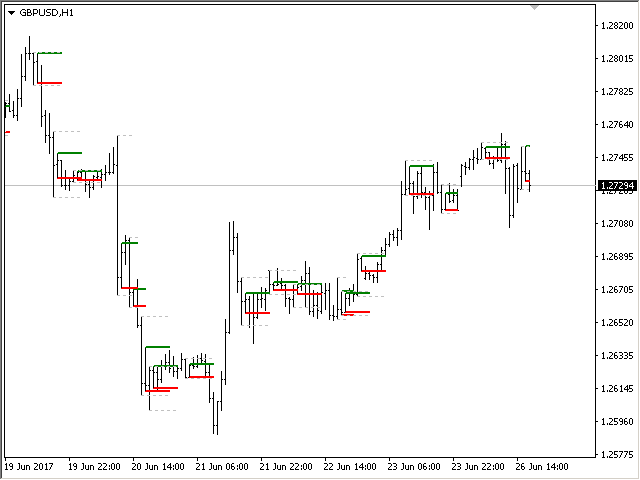
This is a very helpful indicator that has revolutionized my trade experience. Thanks for sharing it free. It will be nice if alert is added to know when the inside bars form and when they are broken up/down. Please I need the link to download the free MT% version, any help?
chidex
2018.04.20
This is a very helpful indicator that has revolutionized my trade experience. Thanks for sharing it free. It will be nice if alert is added to know when the inside bars form and when they are broken up/down. Please I need the link to download the free MT5 version, any help?
Taras Slobodyanik
パブリッシュされたプロダクト
· 1
PJ CHAWLA
2018.04.20
This my 2nd request to make indicator which give alerts only on change of direction. I am willing to pay for your work. Please reply at pjchawla@gmail.com